Paraconsistent artifi cial neural
networks and Alzheimer disease
A preliminary study
Jair Minoro Abe
1, Helder Frederico da Silva Lopes
2, Renato Anghinah
3Abstract – EEG visual analysis has proved useful in aiding AD diagnosis, being indicated in some clinical pro-tocols. However, such analysis is subject to the inherent imprecision of equipment, patient movements, electric registers, and individual variability of physician visual analysis. Objectives: To employ the Paraconsistent Artifi cial Neural Network to ascertain how to determine the degree of certainty of probable dementia diagnosis. Methods:
Ten EEG records from patients with probable Alzheimer disease and ten controls were obtained during the awake state at rest. An EEG background between 8 Hz and 12 Hz was considered the normal pattern for patients, al-lowing a variance of 0.5 Hz. Results: The PANN was capable of accurately recognizing waves belonging to Alpha band with favorable evidence of 0.30 and contrary evidence of 0.19, while for waves not belonging to the Alpha pattern, an average favorable evidence of 0.19 and contrary evidence of 0.32 was obtained, indicating that PANN was effi cient in recognizing Alpha waves in 80% of the cases evaluated in this study. Artifi cial Neural Networks – ANN – are well suited to tackle problems such as prediction and pattern recognition. The aim of this work was to recognize predetermined EEG patterns by using a new class of ANN, namely the Paraconsistent Artifi cial Neural Network – PANN, which is capable of handling uncertain, inconsistent and paracomplete information. An architecture is presented to serve as an auxiliary method in diagnosing Alzheimer disease. Conclusions: We believe the results show PANN to be a promising tool to handle EEG analysis, bearing in mind two considerations: the growing interest of experts in visual analysis of EEG, and the ability of PANN to deal directly with imprecise, inconsistent, and paracomplete data, thereby providing a valuable quantitative analysis.
Key words: EEG, Alzheimer disease, pattern recognition, artifi cial neural network, paraconsistent logic.
Rede neural artifi cial paraconsistente e doença de Alzheimer: estudo preliminar
Resumo – A análise visual de EEG tem se mostrado útil na ajuda de diagnóstico de DA, sendo indicado em alguns protocolos clínicos. Porém, tal análise está sujeita à imprecisão inerente de equipamentos, movimentos do paciente, registros elétricos e variação individual da análise visual do médico. Objetivos: Utilizar a Rede Neural Artifi cial Paraconsistente para saber como determinar um grau de certeza no diagnóstico da doença de Alzhei-mer provável.Métodos: Dez pacientes com doença de Alzheimer provável e 10 controles foram submetidos ao registro de exames de EEG durante a vigília em repouso. Considerou-se como padrão normal de um paciente, a atividade de base entre 8,0 Hz a 12,0 Hz, permitindo uma variação de 0.5 Hz. Resultados: A RNAP foi capaz de reconhecer ondas que pertencem à banda Alfa como banda Alfa com evidência favorável de 0.30 e evidência contrária de 0.19, enquanto ondas não pertencentes ao padrão Alfa, foi obtido uma evidência favorável média de 0.19 e evidência contrária de 0.32, mostrando que a RNAP foi efi ciente para reconhecer ondas Alfa, o que leva a uma concordância com o diagnóstico clínico de 80%. Conclusões: RNAP pode ser ferramenta promissora para manipular análise de EEG, tendo em mente ambas considerações: o interesse crescente de especialistas em análise visual de EEG e a capacidade da RNAP tratar diretamente dados imprecisos, inconsistentes e paracompletos, fornecendo uma interessante análise quantitativa.
Palavras-chave: EEG, doença de Alzheimer, rede neural artifi cial, reconhecimento de padrões, lógica paracon-sistente.
1Institute For Advanced Studies - University of São Paulo, Brazil. 2Graduate student of M edical School of University of São Paulo - Brazil. 3Reference
Center of Behavioral Disturbances and Dementia (CEREDIC) of the Medical School of University of São Paulo, Brazil.
Several studies on behavioral and cognitive neurology have been conducted to characterize dementias by means of biological and functional markers aimed at understand-ing the evolution of Alzheimer disease (AD), followunderstand-ing its progression, as well as leading toward better diagnostic cri-teria for early detection of cognitive impairment.1,2
At present, there is no method able to determine a de-fi nitive diagnosis of dementia, where a combination of tests is needed to reach a probable diagnosis.3
The electroencephalogram (EEG) is a record of brain electrical signal activity, providing a space-time represen-tation of synchronic postsynaptic potentials. The main generating sources of these electrical fi elds are most likely perpendicular in relation to the cortical surface, such as in the cortical pyramidal neurons.4 During the relaxed awake
state, normal EEG in adults is predominantly composed by the alpha band frequency, which is generated by inter-actions of the slum-cortical cortical and thalamocortical systems.5,6
Several studies have shown that EEG visual analysis is useful in aiding AD diagnosis, being indicated in some clinical protocols.3,4
The most common fi nding in EEG visual analysis is the slowing background of the brain electrical activity compounds regarding delta and theta rhythms, and the decreasing or absence of the alpha rhythm. However, these findings are more common in moderate and advanced stages of AD.3
The majority of theories and techniques available for quantitative EEG analysis are based on classical logic and so cannot adequately such sets of information, at least di-rectly. Although several theories have been developed in order to overcome these limitations, e.g. Fuzzy set theory, Rough theory, non-monotonic reasoning, among others, they cannot deal with inconsistencies and paracomplete-ness. Thus, we need a new kind of logic to deal with uncer-tain, inconsistent and paracomplete data.7,8
The Artificial Neural Network – ANN – can be de-scribed as a computational system consisting of a set of highly interconnected processing elements, called artifi cial neurons, which process information as a response to ex-ternal stimuli. An artifi cial neuron is a simplistic represen-tation that emulates the signal integration and threshold fi ring behavior of biological neurons by means of math-ematical structures. Like their biological counterparts, artifi cial neurons are bound together by connections that determine the fl ow of information between peer neurons. Stimuli are transmitted from one processing element to another via synapses or interconnections, which can be excitatory or inhibitory.9,10
The advantage of neural networks over conventional
programming lies in their ability to solve problems that do not have an algorithmic solution or where the available solution is too complex to be found.11 Neural networks
are well suited to tackle problems that people are good at solving, such as prediction and pattern recognition. Neural networks have been applied within the medical domain for clinical diagnosis,15 image analysis and interpretation,12,13
signal analysis and interpretation, and drug development.14
Therefore, ANN constitutes an interesting tool for EEG qualitative analysis. On the other hand, in EEG analysis we are faced with imprecise, inconsistent and paracom-plete data. In order to manipulate this information directly, some interesting theories have been proposed recently: Fuzzy sets, Rough sets, among others.
In this study we employed a new kind of ANN based on Paraconsistent Annotated Evidential Logic Eτ, which is capable of manipulating imprecise, inconsistent and para-complete data in order to make a fi rst study of the recogni-tion of EEG standards with the aim of using this further in AD diagnosis.
Paraconsistent Artifi cial Neural Networks – PANN is a new artifi cial neural network that will be presented briefl y below.
The atomic formulas of the logic Eτ are of the type
p(µ,λ), where (µ, λ) ∈ [0, 1]2 and [0, 1] is the real unitary
interval (p denotes a propositional variable). p(µ,λ) can be
intuitively read: “It is assumed that p’s favorable evidence is µ and contrary evidence is λ.” Thus,
p(1.0, 0.0) can be read as a true proposition.
p(0.0, 1.0) can be read as a false proposition.
p(1.0, 1.0) can be read as an inconsistent proposition.
p(0.0, 0.0) can be read as a paracomplete (unknown)
prop-osition.
p(0.5, 0.5) can be read as an indefi nite proposition.
We introduce the following concepts (all considerations are made with 0 ≤ µ, λ≤ 1): Uncertainty Degree: Gun(µ,λ)
= µ+λ–1; Certainty Degree: Gce(µ, λ) = µ–λ; an order
rela-tion is defi ned on [0, 1]2: (µ
1, λ1) ≤ (µ2, λ2) ⇔µ1≤µ2 and
λ1≤λ2, constituting a lattice that will be symbolized by τ.
With the uncertainty and certainty degrees we can achieve the following 12 output states: extreme states that are, False, True, Inconsistent and Paracomplete, and non-extreme states.
Some additional control values are:
Vcic=maximum value of uncertainty control=Ftct
Vcve=maximum value of certainty control=Ftce
Vcpa=minimum value of uncertainty control= –Ftct
Vcfa=minimum value of certainty control= –Ftce
For the discussion in the present paper we have used: Ftct=Ftce= ½.
• • • •
•
All states are represented in Figure 1.
In the PANN the main aim is to ascertain how to de-termine the certainty degree concerning a proposition, i.e. if it is False or True. To this end, we take into account the certainty degree Gce. The uncertainty degree Gun indicates
the ‘measure’ of the inconsistency or paracompleteness. If the certainty degree is low or the uncertainty degree is high, it generates an indefi nition.
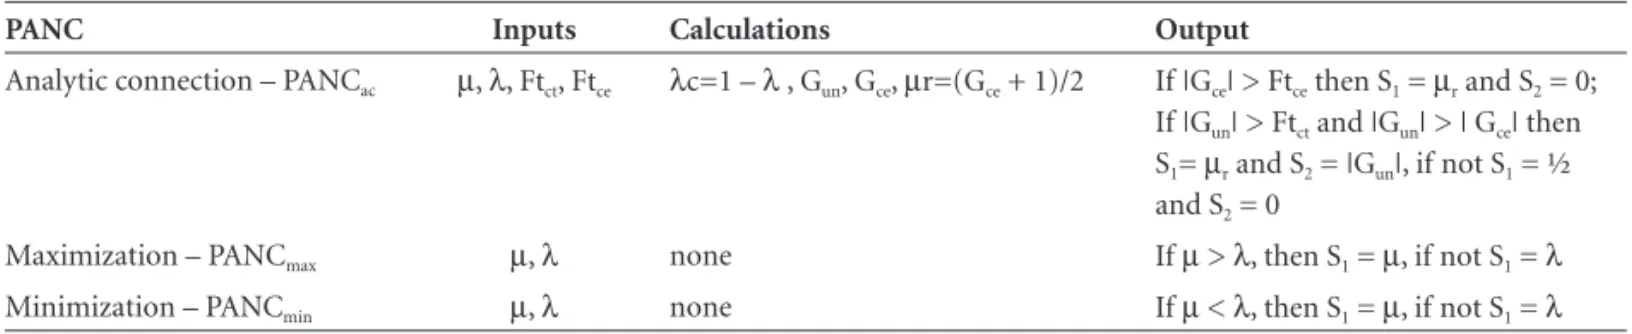
Using the concepts of basic Paraconsistent Artificial Neural Cell – PANC, we can obtain the family of PANC considered in this work, as described in Table 2.
Methods
We analyzed 10 controls and 10 AD EEGs records, dur-ing the awake state at rest, with subjects closdur-ing their eyes. We used electrodes placed according to the 10-20 interna-tional system, a 32 EEG channel EMSA device, with 200Hz sample frequency.
The process of wave analysis by PANN consists previ-ously of:
Data capturing •
Adaptation of the values for screen examination Elimination of the negative cycle
Normalization of the values for PANN analysis
It is worth observing that the process above does not allow the loss of any essential wave characteristics for our analysis. The capturing of the data is obtained from magnetic fi les (suitable software for physical capture of the signals) or manually (TXT fi les - American National Standard Code for Information Interchange).
As the actual EEG examination values can vary highly, •
• •
Table 1. Extreme and non-extreme states.
Extreme states Symbol Non-extreme states Symbol
True V Quasi-true tending to Inconsistent QV→T
False F Quasi-true tending to Paracomplete QV→⊥
Inconsistent T Quasi-false tending to Inconsistent QF→T
Paracomplete ⊥ Quasi-false tending to Paracomplete QF→⊥
Quasi-inconsistent tending to True QT→V
Quasi-inconsistent tending to False QT→F
Quasi-paracomplete tending to True Q⊥→V
Quasi-paracomplete tending to False Q⊥→F
Figure 1. The fi gure displays the output regions of the lattice, consti-tuting the decision-making of the inputs. In this lattice we have 12 out-put states: extreme and non-extreme states. See Table 1 for symbology.
Figure 2. Basic cell of PANN.
The resulting certainty degree Gce is obtained as follows:
If: Vcfa≤ Gun≤ Vcve or Vcic≤ Gun≤ Vcpa⇒ Gce = Indefi nition
For: Vcpa≤ Gun≤ Vcic
If: Gun≤ Vcfa⇒ Gce = False with degree Gun
Vcic≤ Gun⇒ Gce = True with degree Gun
A Paraconsistent Artifi cial Neural Cell – PANC – is called basic
PANC when a given pair (µ, λ) is used as input, and resulting as
output: Gun=resulting uncertainty degree, Gce=resulting certainty
degree, and X=constant of Indefi nition.
C1=Vcve=truth control value
C2=Vcfa=falsity control value
C3=Vcic=inconsistency control value
C4=Vcpa=paracompleteness control value
µ=input of favorable evidence
λ=input of contrary evidence
T=inconsistent
⊥=paracomplete V=true F=false
Vcve=truth control value
Vcfa=falsity control value
Vcic=inconsistency control value
Vcpa=paracompleteness control value
S2a=output with uncertainty degree Gun
S2b=output with certainty degree Gce
S1=output with true, false or indefi nite
in a module, somewhere between 10 µV to 1500 µV, we proceed with normalization of the values to between 100µV and –100 µV by a simple linear conversion, to facilitate the processing and to visualize on the screen:
x = 100.a m
where m is the maximum value of the exam; a is the current value of the exam. Therefore, x is the current nor-malized value.
Elimination of the negative cycle
The minimum value of the exam is taken as a zero value and the remaining values are translated proportionally.
Data analysis, expert system, and wave morphology
In analyzing EEG signals, one important aspect to take into account is the morphological aspect. To perform this task, it is valuable to build one very simple Expert System,
which allows “abnormalities” to be verifi ed, such as spikes and artifacts. Also, it analyses the signal behavior, verifying which band it belongs to (delta, theta, alpha and beta).
Morphological analysis
The process of the morphological analysis of a wave is performed by comparing with a certain set of wave patterns (considered normal). A wave is associated to a vector (fi nite sequence of natural numbers xi) through digital sampling.
This vector characterizes a wave pattern and is registered by the PANN. Thus, new waves are compared, allowing their recognition or otherwise. For the sake of completeness, we show some basic aspects of how PANN operates. Let us take three vectors: V1=(8, 5, 4, 6, 1); V2= (8, 6, 4, 6, 5); V3=(8,
2, 4, 6, 9). The favorable evidence is calculated as follows: given a pair of vectors, we take ‘1’ for equal elements and ‘0’ for different elements, and calculate their percentage. Comparing V2 with V1: 1+0+1+1+0=3; in percentage:
(3/5)*100=60%.
Comparing V3 with V1: 1+0+1+1+0=3; in percentage:
(3/5)*100=60%.
The contrary evidence is the weighted addition of the differences between the different elements, in the module: Comparing V2 with V1=0+1/10+0+0+4/10=(5/10)/5
=10%.
Comparing V3 with V1=0+3/10+0+0+8/10=(11/10)/5
=22%.
Therefore, we can state that V2 is ‘more similar’ to V1
than V3. We use a PANN to recognize this system
tech-nique.
Also, the PANN is capable of adjusting its own recog-nizing factor and propagate to other layers, improving both ‘proximity’ level and ‘recognizing’ level, while also provid-ing the approximate frequency of an analyzed wave.
For the purposes of this study, the favorable evidence was obtained by counting the wave peaks, i.e., the closer to the peak quantity, the greater the degree of favorable evidence:
EF=1–((|bd – vt|)/(bd + vt)), where: •
•
•
•
Table 2. Paraconsistent artifi cial neural cells.
PANC Inputs Calculations Output
Analytic connection – PANCac µ, λ, Ftct, Ftce λc=1 – λ , Gun, Gce, µr=(Gce + 1)/2 If |Gce| > Ftce then S1 = µr and S2 = 0;
If |Gun| > Ftct and |Gun| > | Gce| then
S1= µr and S2 = |Gun|, if not S1 = ½
and S2 = 0
Maximization – PANCmax µ, λ none If µ > λ, then S1 = µ, if not S1 = λ
Minimization – PANCmin µ, λ none If µ < λ, then S1 = µ, if not S1 = λ
0 1 2 3 4 5 6 7 8 9 10
1 2 3 4 5
V 1 V 2 V 3
Figure 3. Comparison of the vectors. Taking as basis the vector V1,
visually we can observe that vector V2 is ‘more similar’ to V1 than
Vt=number of wave peaks of the exam
Bd=number of the wave peaks being compared (pat-tern stored in the database)
Each peak is a 1 Hz morphological approximation; so a wave with 8 peaks is classifi ed as 8 Hz wave (Alpha band).
Data analysis
Expert system for detecting the diminishing average fre-quency level – An expert system verifi es the average fre-quency level of Alpha waves and compares them with a fi xed external one (external parameter wave).
Such external parameter can be, for instance, the aver-age frequency of a population or the averaver-age frequency of the last exam of the patient. This system also generates two outputs: favorable evidence µ (normalized values ranging from 0 (corresponds to 100% – or greater frequency loss) to 1 (which corresponds to 0% of frequency loss) and con-trary evidence λ (=1–µ).
The population pattern used in this work is 10 Hz (6).
Expert system for Alpha band concentration – This ex-pert system is utilized for Alpha band concentration in the exam. For this, we consider the quotient of the sum of fast Alpha and Beta waves over slow Delta and Theta waves, i.e., (Alpha + Beta) / (Delta + Theta).
This expert system generates two outputs:
Favorable evidence µ: fast waves / (fast waves + slow waves). Contrary evidence: λ=1–µ.
• •
• •
Expert system for Theta band concentration – This ex-pert system is utilized for Delta band concentration in the exam. We consider (slow waves Delta + slow waves Theta) / (fast waves Alpha + fast waves Beta).
This expert system generates two outputs:
Favorable evidence µ: 1–((slow waves) / (fast waves + slow waves)).
Contrary evidence: λ=1–µ.
Data analysis
When analyzing information from sources, we may en-counter contradictory, fuzzy or paracomplete data. How-ever, a decision can still be reached. For this, suppose that we have three items of information PA, PB, and PC, where PA and PB are being analyzed. If we cannot decide with this expert information, we take into account the third PC in the following way.
The fi rst layer is composed of three analytical PANC connections: C1, C2, and C3 whose signals are analyzed by means of the Basic Structural Equation: BSE: S=(µ–(1–λ) +1) / 2 resulting in the output signals SA, SB, and SC.
In the internal layers, the cells C4 and C6 constitute the Maximization Neural Unit (it takes the maximum value SG among output values SA, SB, and SC) and the cells C5 and C7, the Minimization Neural Unit (which takes the mini-mum value SE among output values SA, SB, and SC).
Another way to defi ne the interpretation of the analy-sis is to use the resultant value (µr) and complements it;
this generates a complemented resultant value (λr). In this
•
•
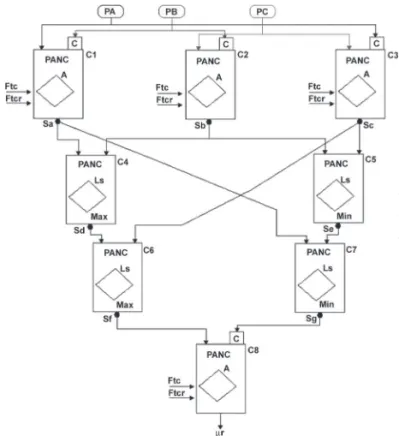
Figure 4. A decision-making architecture for global analysis. Three expert systems operate: PA, for detecting the diminishing average frequency level; PB, for Alpha band concentration, and PC, for Theta band concentration.
C1–PANC which processes input data of PA and PB
C2–PANC which processes input data of PB and PC
C3–PANC which processes input data of PC and PA
C1, C2, and C3 constitute the 1st layer of the architecture
C4–PANC which calculates the maximum evidence value between cells C1 and C2
C5–PANC which calculates the minimum evidence value between cells C2 and C3
C4 and C5 constitute the 2nd layer of the architecture
C6–PANC which calculates the maximum evidence value between cells C4 and C3
C7–PANC which calculates the minimum evidence value between cells C1 and C5
C6 and C7 constitute the 3rd layer of the architecture
C8 analyzes the experts PA, PB, and PC and gives the resulting decision value
PANC A = Paraconsistent artifi cial neural cell of analytic connection
PANC Ls Max = Paraconsistent artifi cial neural cell of simple logic connection of maximization
PANC Ls Min = Paraconsistent artifi cial neural cell of simple logic connection of minimization
Ftc = Certainty tolerance factor
Ftcr = Contradiction tolerance factor Sa = Output of C1 cell
Sb = Output of C2 cell Sc = Output of C3 cell Sd = Output of C4 cell Se = Output of C5 cell Sf = Output of C6 cell Sg = Output of C7 cell C = Complemented value of input
Table 3. Test with normal patients.
Casuistic Patient FE CE Mean Diagnosis
7601 JS 0.4813 0.1404 6.9184 1
7701 RKG 0.4813 0.0712 8.475 2
5401 EC 0.4959 0.1377 7.025 2
7801 JIS 0.5191 0.0603 8.5 1
6501 LANG 0.5207 0.0548 8.425 1
7101 JTBT 0.5419 0.0594 8.6 1
7201 OTWNV 0.5896 0.0301 8.4 1
1202 RA 0.8162 0.0613 10.2 1
2102 DYT 0.8546 0.0485 18.825 1
1802 DO 0.8818 0.0394 10.15 1
FE, favorable evidence; CE, contrary evidence; 1, normal patient; 2, prob-able AD patient.
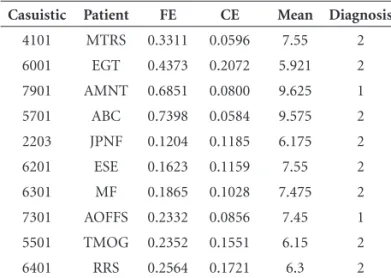
Table 4. Test with non-normal patients.
Casuistic Patient FE CE Mean Diagnosis
4101 MTRS 0.3311 0.0596 7.55 2
6001 EGT 0.4373 0.2072 5.921 2
7901 AMNT 0.6851 0.0800 9.625 1
5701 ABC 0.7398 0.0584 9.575 2
2203 JPNF 0.1204 0.1185 6.175 2
6201 ESE 0.1623 0.1159 7.55 2
6301 MF 0.1865 0.1028 7.475 2
7301 AOFFS 0.2332 0.0856 7.45 1
5501 TMOG 0.2352 0.1551 6.15 2
6401 RRS 0.2564 0.1721 6.3 2
FE, favorable evidence; CE, contrary evidence; 1, normal patient; 2, prob-able AD patient.
Table 5. Diagnosis – Normal x Probable AD patients.
Gold Standard
AD patient Non AD patient Total
Negative Positive Total
2 8 10
2 8 10
4 16 20
Gold Standard
AD patient Non AD patient Total
Negative Positive Total
10.00% 40.00% 50.00%
10.00% 40.00% 50.00%
20.00% 80.00% 100.00%
Sensitivity 0.8
Specifi city 0.8
manner, we acquire resultant favorable evidence (µr) and
resultant contrary evidence (λr), as exemplifi ed below: We applied this methodology in two subjects (blind study), one of them normal and the other with AD, and the method was able to distinguish both, classifying the normal subject in the normal standard of waves and the AD subject under the abnormal model.
Results
The proposed method was tested on 10 EEGs and the system correctly classifi ed normal subjects at a rate of 80% with 20% as false-positive (Table 3).
In the following study, a further 10 EEGs were tested and the system correctly classifi ed AD cases at a rate of 80% with 20% false-negative, as shown in Table 4.
Figure 5. Final lattice of diagnosis decision states – Normal x Probable AD patients. We can observe two groups of normality: those non AD patients with Alpha concentration higher or equal to the average rate popula-tion (triangle of right side) and remaning non AD patients with Alpha concentration lower than average population rate. F, false output state; V, true output state.
Discussion
For this preliminary test the normal pattern of a patient was considered as waves from 8 Hz to 12 Hz, allowing a variance of 0.5 Hz, thus representing the Alpha band. We stored 9 positive cycle wave patterns plus 9 negative cycle wave patterns. In this test periods were selected contain-ing characteristics of the Alpha band, totalcontain-ing 10 seconds. The PANN was capable of recognizing waves belonging to the Alpha band with favorable evidence of 0.30 and con-trary evidence of 0.19, while for waves not belonging to the Alpha pattern, an average favorable evidence of 0.19 and contrary evidence of 0.32 was achieved, demonstrating that PANN was effi cient in recognizing Alpha waves.
The lattice in Figure 5 depicts two true state regions. This can be indicative of the existence of two groups of normality: non AD patients with Alpha concentration higher or equal to the average population rate (triangle to right side) and the remaining subjects which are non AD patients with Alpha concentration lower than the average population rate. The same observation seems applicable to the probable AD patients. A more complete study is cur-rently underway the results of which are set to appear in forthcoming papers.
Acknowledgements – The authors are grateful to the anonymous referees who provided useful comments to improve the fi nal version of the paper.
References
1. Duffy FH, Albert MS, Mcnulty G, Garvey AJ. Age differences in brain electrical activity of healthy subjects. Ann Neural 1984;16:430-438.
2. Nuwer MR, Comi G, Emerson R, et al. IFCN standards for digital recording of clinical EEG. Electroencephalogr Clin Neurophysiol 1998;106:259-261.
3. Nitrini R, Caramelli P, Bottino CM, Damasceno BP, Brucki SM, Anghinah R. Academia Brasileira de Neurologia. Diagno-sis of Alzheimer’s disease in Brazil: diagnostic criteria and
au-xiliary tests. Recommendations of the Scientifi c Department of Cognitive Neurology and Aging of the Brazilian Academy of Neurology. Arq Neuropsiquiatr 2005;63:713-719. 4. Montenegro MA, Cendes F, Guerreiro MM, Guerreiro CAM,
edi-tors. EEG na Prática Clínica, São Paulo: Lemos Editorial; 2001. 5. Abe JM. Fundamentos da lógica anotada. Thesis, Faculdade
Filosofi a Letras e Ciências Humanas da Universidade de São Paulo, São Paulo, Brazil, 1992.
6. Anghinah R. Estudo da densidade espectral e da coerência do eletrencefalograma em indivíduos adultos normais e com doença de Alzheimer provável. Thesis, Faculdade de Medicina da Universidade de São Paulo, São Paulo, Brazil, 2003. 7. Da Costa NCA, Abe JM, Silva Filho JI, Murolo AC, Leite CFS.
Lógica Paraconsistente Aplicada. São Paulo: Editora Atlas; 1999. 8. Da Silva Filho JI, Abe JM. Fundamentos das redes neurais pa-raconsistentes: destacando aplicações em neurocomputação. São Paulo: Editora Arte & Ciência; 2001.
9. Erganian A, Mahmoudi B. Real-time ocular artifact suppres-sion using recurrent neural network for electro-encephalo-gram based brain-computer interface. Med Biol Eng Comput 2005;43:296-305.
10. Fausett L. Fundamentals of neural network architectures, algorithms, and applications, US Ed edition, New York: Prentice Hall, 1994. 11. Subasi A, Alkan A, Koklukaya E, Kiymik MK. Wavelet neural network classifi cation of EEG signals by using AR model with MLE preprocessing, Neural Netw 2005;18:985-997.
12. Ventouras EM, Monoyou EA, Ktonas PY, et al. 25 Sleep spin-dle detection using artifi cial neural networks trained with fi l-tered time-domain EEG: a feasibility study. Comput Methods Programs Biomed 2005;78:191-207.
13. Miller A. The application of neural networks to imaging and sig-nal processing in astronomy and medicine. Thesis, Faculty of Sci-ence, Department of Physics, University of Southampton, 1993. 14. Weinstein J, Kohn K, Grever M. Neural computing in cancer
drug development: predicting mechanism of action. Science 1992;258:447-451.