AR
TICLE
1 Seção de Meio Ambiente, Instituto Evandro Chagas. Rodovia BR-316 Km 07 S/N, Levilândia. 67030-000 Ananindeua PA Brasil. adaelsonmedeiros@ iec.pa.gov.br
2 Fundação Oswaldo Cruz. Rio de Janeiro RJ Brasil.
Assessment of the quality of water for consumption
by river-bank communities in areas exposed to urban
and industrial pollutants in the municipalities of Abaetetuba
and Barcarena in the state of Pará, Brazil
Abstract In spite of the great technological
ad-vances in processes for treatment of water for hu-man consumption, water actually used for supply has become a major public health challenge. This study assesses the quality of the water consumed in two riverside communities in the Brazilian state of Pará, in an area exposed to domestic and indus-trial pollutants. Four campaigns of sampling were carried out in the two communities. The variables used for the calculation of the water quality index – Índice de Qualidade da Água, or IQA – were: pH, total solids, chloride, fluoride, hardness and N-Nitrate. The waters used for human consump-tion in the Maranhão Community, where there is no contamination by industrial pollutants, presented adequate samples, with improvement in the dry season; on the other hand the waters of the Vila do Conde, a location close to the in-dustrial activity, had quality that was unaccept-able for human consumption in both the seasonal periods. The principal parameters affected were pH and N-Nitrate, with values up to 25 times the reference level of the Brazilian legislation for water for human consumption. These results indicated greater anthropic interference in the vicinity of Vila do Conde, in Barcarena. It is concluded that this population is in need of clinical assessments by specialized professionals on the state of its health.
Key words Index, Water quality, Water for hu-man consumption, Environmental exposure, Health
Adaelson Campelo Medeiros 1
Marcelo de Oliveira Lima 1
M
e
d
e
ir
Introduction
Water is an essential good that ensures the pop-ulation’s health, and is thus considered a prior-ity for action in environmental health oversight
in Brazil1. However, non-sustainable patterns of
development have worked in favor of degrada-tion of the environment, as a result of significant alterations in the natural environment, and de-struction of various ecosystems (including espe-cially aquatic systems), which lead to changes in the patterns of distribution of diseases and in the
health conditions of various population groups2.
Article 200 of Brazil’s 1988 Federal Constitu-tion attributes the duty of oversight and inspec-tion of water for human consumpinspec-tion, and par-ticipation in policy and execution of basic water services, to the Brazilian Single Health System (Sistema Único de Saúde, or SUS)3. An enabling law under the Constitution, the Organic Health Law (Law 8080/1990), in its Article 6, also lays down specifications for the field of activity of the SUS in relation to oversight/inspection of water
for human consumption in Brazil4.
The debate on questions relating to water quality, and consequently, the activity of the Health Ministry in governing parameters of po-tability is not recent. The competency for prepar-ing rules and standards for potability of water for human consumption has been a duty of the Health Ministry since 1977. And it was thus that Oversight of Quality of Water for Human Con-sumption was the first area of oversight in
envi-ronmental health in Brazil5.
This inspection and oversight of quality of water for human consumption is applicable to the various forms of supply of water – in public and private management; in city and rural situa-tions; and in indigenous areas and isolated com-munities. The forms of supply of water can have very varied characteristics. For example, water may be distributed by a network or transported by vehicles; supply may be restricted to a single household or may be for various districts or mu-nicipalities; water tables from which water is col-lected may be on the surface or underground; the treatment may be complete, or may be simplified – with only disinfection. In all these, monitoring of water quality is the instrument of verification of potability of water for human consumption, according to a standard established in legislation. For monitoring or water quality, laboratory anal-yses of samples are required to be carried out, in accordance with specific sampling plans for this control, which are described in the Drinking
Wa-ter Rules (Norma de Potabilidade da Água), and in
accordance with the oversight sampling plans, de-scribed in the National Directive of the Oversight
Plan (Diretriz Nacional do Plano da Vigilância)6.
The standard of potability in Brazil is es-tablished in Ministerial Order GM/MS 2914, of
December 12, 2011, which governs Procedures
for control, monitoring and oversight of quality of water for human consumption, and its standard of potability, and also establishes the competen-cies and responsibilities attributed to the public health authorities (the Oversight function), in the three spheres of management of the SUS, and the people responsible for the system, or for providing an alternative collective solution for supply of water for human consumption (the
Control function)7.
The action of Vigiagua demonstrates and confirms that management of water resources in Brazil involves great difficulties. Waters collected for purposes of public supply are increasingly adversely affected in terms of quality and quan-tity, and even subterranean waters that have the barrier of the soil as protection are more vulner-able to the environmental pollutants arising from anthropogenic sources such as domestic waste, industrial waste, leaching of slurry from sanitary
landfills, etc.8,9.
e C
ole
tiv
a,
21(3):695-708,
2016
buildings in the form of slums and an
overbur-den of population10.
At present, the municipality of Barcarena (in the state of Pará), not unlike other Brazilian municipalities, faces problems of lack of ade-quate water services, absence of housing policies, precarious health services, etc. As well as these aggravating factors, there are frequently envi-ronmental accidents around the industrial area, resulting in pollution/contamination of surface and underground bodies of water and other ele-ments of the environment, causing considerable damage to flora, fauna and the health of the
pop-ulation11,12.
That is the context of this study which pres-ents results of monitoring of underground water sources used for human consumption around the riverside communities that are exposed to pollution and environmental contaminants in the municipalities of Abaetetuba and Barcarena in the State of Pará.
Materials and methods
Description of the area of the study
Abaetetuba and Barcarena are large mu-nicipalities in the State of Pará with estimated populations (in 2014) of 148,873 and 112,921, and reported territorial areas of 1,610.108 and
1,310.588 square kilometers, respectively13. They
are to the southwest of the city of Belém, about 90 km from its center, and are within the basin of the Pará River.
The hydrogeological systems of Abaetetuba and Barcarena were classified according to the classification criteria of Belém and Ananindeua, based on the proximity of the areas and similar geometric configurations identified in the litho-logical profiles. According to those authors, there are five hydrogeological systems in the area cor-responding to these two municipalities, formed by aquicludes, aquitards and aquifers belonging to the stratigraphic units Pirabas, Barreiras and Quaternary Cover. These systems are referred to as Alluvium, Post-Barreiras, Barreiras, Upper Pirabas and Lower Pirabas, with predominance of the Barreiras group in these areas and other regions of the Pará River. Close to the principal surface bodies of water, however, the
predomi-nant systems are the Alluvium14.
Maranhão and the Vila do Conde Commu-nity are in the municipalities of Abaetetuba and Barcarena, respectively, both in the State of Pará,
at the geographical coordinates 1°40’ 10.58” S / 48°49’12.26” W and 1°34’3.17” S / 48°45’55.36”
W (WGS 84). Maranhão Community (
Comuni-dade Maranhão) is approximately 8.5 km (in a straight line) from the city of Abaetetuba, Pará, and 12 km from Vila do Conde, in Barcarena, Pará (as can be seen on Google Earth), with ac-cess by State Highway PA-252 and Ramal do Ma-ranhão, a riverside community on the left margin of the river Guajará do Beja, which is a tributary of the Pará River. Vila do Conde is one of the districts of the municipality of Barcarena, and is located around the port area of Vila do Conde, where there are industrial companies that pro-cess and export kaolin, alumina, aluminum and electricity power cables, and several companies
producing agribusiness products10,11,13.
The water consumed in both locations orig-inates from subterranean aquifers, and there is no type of treatment in these sources of sup-ply – there is only capture of the source water, channeled or otherwise, storage in water tanks or raised reservoirs, and distribution to the points of consumption. The well that is used for the general supply in Vila do Conde – through piped distribution by the water service of the munic-ipality – functions intermittently – i.e. not 24 hours per day.
Collection of data
Four campaigns of sampling of waters were carried out in 2012, two in the rainy period (Jan-uary and April) and two in the dry period (Au-gust and November), aiming to portray the influ-ence of rainfall and the change in the quality of the waters consumed in the area of study.
M
e
d
e
ir
Analysis of data
The samplings and analyses were carried out respectively according to the
recommenda-tions of: (i) the Brazilian Guide for Collection and
Preservation of Samples: Water, sediment, aquatic communities and liquid effluents (Guia Nacional de Coleta e Preservação de Amostras: água, sedi-mento, comunidades aquáticas e efluentes
líqui-dos)15 and (ii) the U.S. Standard Methods for
Ex-amination of Water and Wastewater16.
The samples of water were collected: in 1-li-ter polyethylene flasks directly at the wells, using a stainless steel bucket; or in the suction tubing prior to the water tank or reservoir; or from con-tainers used for household storage, considered in this study as household water; and in waters from the collective supply distribution network (taps). The analyses of pH and total dissolved solids
were carried out on Hanna® HI 769828
multipa-rameter equipment (methods SM 4500B and SM 2540C). Total solids in suspension were
deter-mined using a Hach® DR2800
spectrophotome-ter (UV-VIS, SM 2540D method). The variables
chloride, fluoride and hardness (CaCO3 and
MgCO3) and N-Nitrate were determined on the
Dual Dionex™ ICS-2100 system manufactured by Thermo Scientific™ (USA SM 4110A meth-od).
For the calculation of WQI in underground waters in this study, the variables pH, total sol-ids (sum of total dissolved solsol-ids and total solsol-ids in suspension), fluoride, chloride, hardness and N-Nitrate were determined. These calculations followed the same criterion for WQI of the Na-tional Sanitation Foundation (NSF) and Cetesb (Environmental Water Technology Company of
São Paulo State)17. The methodologies developed
by Oliveira et al.18, applied to subterranean water
through the index of natural quality of subter-ranean waters (IQNAS) were taken as a point of reference.
This mathematical model developed by
Ol-iveira et al.18 and Silva et al.19 was based on the
same principle as the mathematical formulation used in the WKI of the NSF and Cetesb, which adopts the product of the values for quality of subterranean water based on the variables cho-sen through the opinion of specialists in the sub-ject (qpH, q-total solids, q-chloride, q-fluoride, q-hardness and q-nitrate), raised to the weight defined by each variable in accordance with their importance, as per Equation 01:
(Equation 01)
Thus, the GNQI (Groundwater Natural Quality Index) is represented by a number be-tween 0 and 100, divided into four (4) categories and weightings, that is, from 0 to 36 classifies the waters as in the unfit for human consumption category, from 37 to 51 acceptable, from 52 to 79
good and from 80 to 100 very good; Qibeing the
quality of the i-th variable, where i is a number between 0 and 100, obtained from the respective curve of average quality variation (Figure 2), as a function of its concentration or through math-ematical equations for the curves of quality vs.
concentration; and wi is the weight
correspond-ing to the i-th variable, a number between 0 and 1, attributed as a result of the importance for global quality compliance (Table 1).
The mathematical models built for the cal-culation of WQI in subterranean waters were prepared based on quality marks applied to each variable, the mark of 37 being used for acceptable quality at the end of the interval for each variable, taking the values recommended by Health Min-istry Order 2914 of 2011 as reference.
For the descriptive statistics, Microsoft
Cor-poration Excel 2013© was used, and the software
Minitab 17 OnTheHub Inc.® was used for the
Analyses of Principal Components, with rights to use under license.
Since there is no type of chemical treatment directly on the sources of capture of water, and they originate from subterranean aquifers, as a way of comparing the quality of the waters of the subterranean aquifers with the waters collected in households and in the distribution network, the calculation of the IQNAS was also carried out on the household waters and water from the dis-tribution network with the same methodology applied for subterranean waters.
Ethical considerations
Complying with the specifications of Minis-terial Order 466/2012, the plan of the study was approved by the Ethics Committee of the Evan-dro Chagas Institute.
GNQI =
P
qiwin
e C ole tiv a, 21(3):695-708, 2016
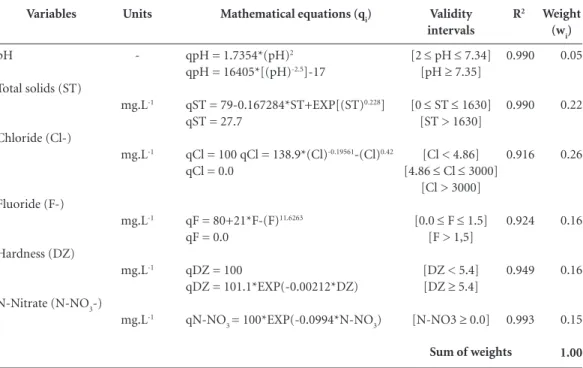
Figure 1. Score-plot analysis of principal components (ACP) on data for subterranean water in rainy period
(a), dry period (b) and rainy vs. dry (c); of household water in rainy period (d), dry period (e) and rainy vs. dry (f); and household water and network water in rainy period (g), dry period (h) and rainy vs. dry (i) for the Maranhão Community and Vila do Conde.
Key: VCAS: Vila do Conde underground water; CMAS: Maranhão Community underground water; VCAD: Vila do Conde household water; CMAD: Maranhão Community household water; VCAR: Vila do Conde network water.
PC1 (86,0%)
PC2 (14,0%)
-3 -2 -1 0 1 2
-0,5 0,0 0,5 1,0 VCAS-03 VCAS-06 VCAS-05 VCAS-01 VCAS-02 VCAS-04 VCAS-07 CMAS-09 CMAS-01 CMAS-08 CMAS-07CMAS-10 CMAS-03 CMAS-06 CMAS-04 CMAS-05 CMAS-02 (a) PC1 (96,5%) PC2 (3,5%)
-2,5 -1,5 -1,0 0,0 0,5 1,5
-0,50 0,00 0,25 0,50 VCA S-03 VCA S-06 VCA S-05 VCA S-01 VCA S-02 VCA S-04 VCA S-07 CMA S-09 CMA S-01 CMA S-08 CMA S-07 CMA S-10 CMA S-03 CMA S-06 CMA S-04 CMA S-05 CMA S-02 (b) -0,25 -0,75
-2,0 -0,5 1,0
PC1 (66,6%)
PC2 (33,4%)
-2 -1 1 2
-1,0 0,0 0,5 2,0 VCAD-05 CMAD-04 (c) -0,5 -1,5 0 1,5 1,0 VCAD-03 VCAD-09 VCAD-07 VCAD-06 VCAD-04 VCAD-10 VCAD-02 VCAD-01 VCAD-11 VCAD-12VCAD-13 VCAD-08 CMAD-08 CMAD-07 CMAD-06 CMAD-05 CMAD-03 CMAD-02 CMAD-01 CMAD-10 CMAD-09 PC1 (85,9%)
PC2 ( 14,1%)
-2 -1 1 2
-1,0 0,0 1,0 1,5 (d) -0,5 0,5 0 VCAD-01 VCAD-09 VCAD-06 VCAD-07 VCAD-13 VCAD-08 VCAD-03 VCAD-11 VCAD-10 VCAD-05 VCAD-12 VCAD-04 VCAD-02 CMAD-07 CMAD-08 CMAD-01 CMAD-02 CMAD-03 CMAD-04 CMAD-05 CMAD-06CMAD-09 CMAD-10 PC1 (58,1%) PC2 (41,9%)
-1,5 -0,5 1,5 2,5
0 2 (e) -1 -2 0,5 1 VCAD-12 VCAD-08 VCAD-07 VCAD-06 VCAD-05 VCAD-04 VCAD-03 VCAD-02 VCAD-01 VCAD-09 VCAD-11 VCAD-10 VCAR-01 VCAR-02 VCAR-03 VCAR-04 VCAR-05 VCAR-06 VCAR-07 VCAR-08 VCAR-09 VCAR-10 VCAR-11 VCAR-12 VCAR-13 VCAD-13
0,0 1,0 2,0
-1,0
PC1 (64,7%)
PC2 ( 35,3%)
-1 2 3
M
e
d
e
ir
Results
The analysis of the waters was carried out sep-arated by source, into subterranean, households and distribution network. Data for distribu-tion network water is presented only for Vila do Conde, because the Maranhão Community does not have this water distribution option.
Underground waters
In the rainy period, the WQIs calculated on the waters of the wells of the Maranhão Commu-nity showed acceptable quality (WQI = 46) in 5 % of the samples, good quality (WQI 53-78) in 80% of the samples, and very good quality (WQI 80- 86) in 15% of the samples. In the dry peri-od, there was an improvement in the quality of waters of these wells, with WQI results varying from good (57-79) to very good (80-82) of 55% and 45% respectively. At Vila do Conde, in the rainy period, the waters of the wells presented unfit quality (WQI from 4-36) in 64.28% of the samples, acceptable quality (WQI = 39-50) in 14.28% of the samples and good quality (WQI 55-65) in 21.44% of the samples. In the dry
peri-od, the water quality of the wells assessed in Vila do Conde was unfit (WQI 2-34) in 78.57% of the samples, acceptable (WQI = 39-46) in 14.29% of the samples and good (WQI = 62) in 7.14% of the samples.
It is observed that the subterranean water in these two locations had very different quali-ty conditions when compared between the rainy and dry periods (Figures 1a and 1b), with quality significantly better in the Maranhão Community – where results were less strong in the rainy sea-son: its waters improved even more in quality in the dry period. The waters of Vila do Conde were unfit for human consumption in the two periods, including the well that is used for general supply of the population of Vila do Conde, which pre-sented unfit quality with WQI values varying be-tween 16 and 32. PC1 (86.0%) showed an excel-lent separation of two groups on the y axis in the rainy season, associated with the characteristics of the subterranean waters between the commu-nities of Maranhão and Vila do Conde.
This result confirms a significant discrepan-cy in relation to the results of evaluation of the quality of the waters of these aquifers. In the Maranhão community the waters show a
high-Weight (wi)
0.05
0.22
0.26
0.16
0.16
0.15
1.00 Variables
pH
Total solids (ST)
Chloride (Cl-)
Fluoride (F-)
Hardness (DZ)
N-Nitrate (N-NO3-)
Units
-mg.L-1
mg.L-1
mg.L-1
mg.L-1
mg.L-1
Mathematical equations (qi)
qpH = 1.7354*(pH)2
qpH = 16405*[(pH)-2.5]-17
qST = 79-0.167284*ST+EXP[(ST)0.228]
qST = 27.7
qCl = 100 qCl = 138.9*(Cl)-0.19561-(Cl)0.42
qCl = 0.0
qF = 80+21*F-(F)11.6263
qF = 0.0
qDZ = 100
qDZ = 101.1*EXP(-0.00212*DZ)
qN-NO3 = 100*EXP(-0.0994*N-NO3)
Table 1. Mathematical equations of quality curves of the variables pH, total solids, chloride, fluoride, hardness and N-Nitrate for determination of qi.
Validity intervals
[2 ≤ pH ≤ 7.34] [pH ≥ 7.35]
[0 ≤ ST ≤ 1630] [ST > 1630]
[Cl < 4.86] [4.86 ≤ Cl ≤ 3000]
[Cl > 3000]
[0.0 ≤ F ≤ 1.5] [F > 1,5]
[DZ < 5.4] [DZ ≥ 5.4]
[N-NO3 ≥ 0.0]
R2
0.990
0.990
0.916
0.924
0.949
0.993
Source: Adapted from Oliveira et al.18.
e C
ole
tiv
a,
21(3):695-708,
2016
er standard reflected by higher WQI indices, in contrast to the results of Vila do Conde, whose WQI values show the degradation of the aquifers, being reflected in the quality of the underground water used for supply to the population. Howev-er, although PC2 (14.0%) did not show a good separation on the x axis where the samples col-lected in the Maranhão community are grouped, in the samples of Vila do Conde, two VCAS points, 4 and 7, stand out, denoting that in them there is a major differentiation in relation to the other points of this region, possibly due to the worse increase in the quality of the waters based on the WQI values of these sampling points.
These results were repeated in the dry period in which PC1 reached 96.5%, showing a greater distancing in relation to the quality of the under-ground waters in the communities assessed. This fact may be associated with lower percolation of other contaminants and nutrients that are nor-mally more intense in the rainy period, that is to say, the characteristics of the waters have lower variation in the levels of the parameters assessed that are reflected in the WQI indices. However, it is also observed that in this period PC2 (3.5%) does not succeed in successfully separating any of the points of either region, these results being considered more homogenous for a single area.
Water in households
In the rainy period, the household waters of the Maranhão Community presented acceptably quality (WQI=45-51) in 10 % of the samples, good quality (WQI= 52-79) in 65% of the sam-ples, and very good quality (WQI=80-87) in 25% of the samples. In the dry period, there was an improvement in the quality of the waters of these households, with WQI results varying from good (59-78), in 75% of the total, to very good (80-87), in 25% of the total. In Vila do Conde in the rainy period, the waters of the wells assessed showed unfit quality (WQI=12-34) in 65.39% of the sam-ples, acceptable quality (WQI=43-47) in 7.69% of the samples and good quality (WQI 52-65) in 15.38% of the samples, and very good quality (WQI=82-85) in 11.54% of the samples. In the dry period, the quality of the waters of the wells evaluated in Vila do Conde was unfit (WQI=7-35) in 65.38% of the samples, acceptable (WQI=39-48) in 11.54% of the samples, good (WQI=54-65) in 15.39% of the samples, and very good quality (WQI=82-85) in 7.69% of the samples.
There were also differences in quality, in the households of the Maranhão Community and
Vila do Conde, between the two seasonal peri-ods (Figures 1c and 1d), and they had identical patterns to those of their sources (wells), that is to say, The Maranhão Community presented good quality in the majority of the samples as-sessed and Vila do Conde presented unfit qual-ity in the largest percentage of the samples. This is evidenced in Figures 2c and 2d: PC1 (66.6%) showed a good separation of the two groups on the Y axis in the rainy period, associated with the characteristics of the household waters when compared between the Maranhão and Vila do Conde communities. This result confirms a sig-nificant difference in the quality of the waters collected in the household recipients of the two communities. In the Maranhão community, the waters had better WQI levels, but the results of Vila do Conde show degradation of the quality of the underground waters consumed, reflect-ing the same characteristics of the aquifers used to supply the population. PC2 (33.4%) did not present a good separation on the x axis. These results were repeated in the dry period in which PC1 (85.9%) and PC2 (14.1%) showed a greater distancing and separation on the y axis in rela-tion to the quality of the household waters in the communities assessed.
Water of the distribution network
The waters of the distribution network were assessed only in Vila do Conde, and also main-tained the same pattern of quality as the wells as-sessed in that district, including, indeed, the same level of quality of the well that is used for general supply to the population. The quality conditions of the water of the network were as follows: In the rainy period, 88.46% of the samples had unfit quality (WQI 9-30), 3.85% had acceptable quali-ty (WQI = 39) and 7.69% had good qualiquali-ty (WQI = 55-61). In the dry period, the quality of the waters in the network in Vila do Conde deteri-orated, presenting unfit quality in 92.31% of the samples (WQI 13-31) and good quality in 7.69% = (WQI = 54).
M
e
d
e
ir
axis. These results were repeated in the dry period in which PC1 (64.7%) and PC2 (35.3%) showed a greater distancing and separation on the y axis in relation to the quality of the household wa-ters and the wawa-ters of the distribution network in the community assessed. Comparing the waters of the distribution network with the household waters in the two seasonal periods, an identical pattern of quality with small improvements of quality at some sampling points, probably due to boiling of water, addition of chemical products such as hypochlorite, etc., was observed.
Finally, Table 2 shows the applied descriptive statistics on the values of the variables and WQIs determined in this study in the subterranean wa-ters, household waters and distribution network waters in the two locations, presenting values of geometric mean, standard deviation, minimum and maximum for the data of the rainy period
and the dry period. It is seen that, according to the parameters evaluated, there is a better qual-ity level for the Maranhão Communqual-ity, with improvement of quality in the dry period, with predominance of good and very good quality. In opposition to this, Vila do Conde maintained a quality level varying from regular to bad in its waters – thus, unfit for consumption. It is worth remembering that the periods considered to be rainy are the months of January and April, and the dry periods are the months of August and November.
Discussion
The use of a a Water Quality Index (WQI) is a mathematical instrument used to transform large quantities of water quality data into a single
Table 2. Descriptive statistics applied to the data from the water samples by location and period.
it continues
Place
Maranhão Community
Vila Do Conde
Period Rainy Dry Rainy Dry Variables pH Total solids Chloride Fluoride Hardness N-Nitrate WQI pH Total solids Chloride Fluoride Hardness N-Nitrate WQI pH Total solids Chloride Fluoride Hardness N-Nitrate WQI pH Total solids Chloride Fluoride Hardness N-Nitrate WQI Units -mg.L-1 mg.L-1 mg.L-1 mg.L-1 mg.L-1 -mg.L-1 mg.L-1 mg.L-1 mg.L-1 mg.L-1 -mg.L-1 mg.L-1 mg.L-1 mg.L-1 mg.L-1 -mg.L-1 mg.L-1 mg.L-1 mg.L-1 mg.L-1 -N 20 20 20 20 20 20 20 20 20 20 20 20 20 20 20 20 20 20 20 20 20 20 20 20 20 20 20 20
MG ± DP
4.62 ± 0.25 30 ± 19 9 ± 8.91 0.011 ± 0.009
4.74 ± 7.70 11.21 ± 8.89
69 ± 10 4.81 ± 0.57
26 ± 20 6.00 ± 7.77 0.014 ± 0.012
0.83 ± 0.73 7.70 ± 5.13
75 ± 8 4.18 ± 0.50 112 ± 50.41 32 ± 16.56 0.020 ± 0.012
7.27 ± 7.27 61.35 ± 48.74
24 ± 20 3.96 ± 0.33 109 ± 51.99 29 ± 12.47 0.026 ± 0.021
4.76 ± 8.05 77.52 ± 59.50
19 ± 16
e C ole tiv a, 21(3):695-708, 2016
number that represents the level of quality of the water. It is a tool very much used for planning of land use and management of water resourc-es, especially in developing countries. It can be measured on the basis of different quantities and types of parameters, most frequently calculat-ed considering the weight of each parameter. A
study developed in Iran20, which developed an
WQI and validated its measures with the use of
remote sensing, concluded that the index map that was created based on the index provides a wide-ranging vision that is easy to interpret for better planning and management.
Considering the references of the Brazilian legislation Ministerial Order 2914 of 2011, which governs procedures for control and oversight of water quality for human consumption and its
level of potability7, the waters assessed in this
study, from capture up to the points of
consump-tion, presented pH with acid characteristics in al-most the totality of the two communities studied, not coming within the values recommended for human consumption (6.0-9.5).
The results for total solids showed low values when compared with the reference of legislation
applied for total dissolved solids (1,000 mg.L-1),
but high in certain sampling points probably due to interference of rains and due to the lack of ad-equate protection of the capture wells. Also, the results of chloride, fluoride and hardness were all in accordance with the legislation (250, 500 and
1.5 mg.L-1 respectively).
Finally, the parameter that had the most in-fluence in the quality of the waters assessed was N-Nitrate, presenting high levels in both com-munities, principally in Vila do Conde. The level on water for human consumption sets an upper
limit of 10 mg.L-1, but levels were found that were
Table 2. continuation
it continues
Place
Maranhão Community
Vila Do Conde
Period Rainy Dry Rainy Dry Variables pH Total solids Chloride Fluoride Hardness N-Nitrate WQI pH Total solids Chloride Fluoride Hardness N-Nitrate WQI pH Total solids Chloride Fluoride Hardness N-Nitrate WQI pH Total solids Chloride Fluoride Hardness N-Nitrate WQI Units -mg.L-1 mg.L-1 mg.L-1 mg.L-1 mg.L-1 -mg.L-1 mg.L-1 mg.L-1 mg.L-1 mg.L-1 -mg.L-1 mg.L-1 mg.L-1 mg.L-1 mg.L-1 -mg.L-1 mg.L-1 mg.L-1 mg.L-1 mg.L-1 -N 20 20 20 20 20 20 20 20 20 20 20 20 20 20 26 26 26 26 26 26 26 26 26 26 26 26 26 26
MG ± DP
5.12 ± 0.53 24 ± 20 10 ± 8.14 0.013 ± 0.008
3.91 ± 5.80 10.78 ± 11.73
67 ± 13 5.12 ± 0.53
29 ± 20 9.00 ± 8.16 0.015 ± 0.012
1.02 ± 1.08 8.85 ± 4.73 74 ± 7 4.36 ± 0.67
79 ± 48.59 22 ± 13.69 0.035 ± 0.021
6.52 ± 4.82 43.74 ± 37.68
31 ± 23 4.11 ± 0.58
92 ± 52.40 20 ± 14.72 0.025 ± 0.020
4.65 ± 4.85 46.06 ± 41.55
29 ± 24
M
e
d
e
ir
10 and even up to 25% higher than the Brazilian legislative benchmark. Nitrate is an important component for human health: in surface waters there are low concentrations, but they can reach high levels in deep waters. Their consumption in supply waters can cause adverse effects on health such as the induction of methemoglobinemia in children, principally in children under the age of three, who are more susceptible due to the alka-line conditions in their gastrointestinal systems, the formation of nitrosamines and nitrosamides present carcinogenic potentials.
The findings of this study are in line with the evidences shown in the literature on water pollu-tion in locapollu-tions with industrial activity. A study in an important province of subterranean water
in the south of India21, where there was a
demo-graphic explosion and intense growth of farm-ing and industrial activities, found an increase
in the concentration of weak acids, an increase in permanent hardness, and alterations in sodi-um adsorption, residual calcisodi-um carbonate and permeability, showing that in 56% of the samples collected in the region with industrial activity the water was considered unfit for human consump-tion.
Further, the pollution caused by emission of metals and other ions in effluents has an effect of creating an environment that is favorable for proliferation of microorganisms. A study in
Pa-kistan22, where the majority of people obtain
po-table water from subterranean water as a source, established the relationship between the bacterio-logical quality of water and socio-economic indi-cators with gastroenteritis in the study area. The results with the calculation of the WQI showed a supply of water that was unfit for consumption in terms of its physical-chemical parameters, and
Table 2. continuation
N: Number of data. MG: Geometric mean; SD: Standard deviation; MIN: Minimum; MAX: Maximum.
Place
Maranhão Community
Vila Do Conde
Period Rainy Dry Rainy Dry Variables pH Total solids Chloride Fluoride Hardness N-Nitrate WQI pH Total solids Chloride Fluoride Hardness N-Nitrate WQI pH Total solids Chloride Fluoride Hardness N-Nitrate WQI pH Total solids Chloride Fluoride Hardness N-Nitrate WQI Units -mg.L-1 mg.L-1 mg.L-1 mg.L-1 mg.L-1 -mg.L-1 mg.L-1 mg.L-1 mg.L-1 mg.L-1 -mg.L-1 mg.L-1 mg.L-1 mg.L-1 mg.L-1 -mg.L-1 mg.L-1 mg.L-1 mg.L-1 mg.L-1 -N -26 26 26 26 26 26 26 26 26 26 26 26 26 26
MG ± DP
-4.24 ± 0.50 128 ± 25.44 33 ± 7.03 0.048 ± 0.016
11.53 ± 5.49 80.08 ± 26.73
21 ± 12 3.95 ± 0.41 124 ± 18.85 27 ± 5.78 0.037 ± 0.047
8.18 ± 3.57 72.86 ± 21.63
25 ± 10
e C
ole
tiv
a,
21(3):695-708,
2016
also with a significant correlation for concentra-tion of fecal coliforms. It was also observed that the correlation was stronger in locations with a higher rate of illiteracy, evidencing a situation of environmental injustice.
Analogously to the industrial processes, the process of urbanization carried out in a disor-ganized way also contributed to the pollution of subterranean waters, as the results of this present study show. Chemical analyses made
in India23, adopting multivariate analysis
tech-niques, similarly to this present study, found differences in the quality of water in accordance with the rainy period: the pollution index in the pre-monsoon period was greater (at 9.27) than in the post-monsoon period (8.74). Further, also similar to our study, the Water Quality Index was worse in the pre-monsoon period (217.59) than in the post-monsoon period (233.02). The study indicated, thus, that an extensive process of urbanization takes place when there is gradual development of various small and large-scale in-dustrial companies, and this process, as a whole, is responsible for degradation of the quality of water, principally through processes like agricul-tural runoff, elimination of wastes, leaching and irrigation with waste water.
This result corroborates a prior study in a
nearby region, also in India24, which indicates
that there is a change in the quality of the water in accordance with the period of the monsoons, which shows seasonal variation in the deteriora-tion of the quality of underground waters.
In the same direction, a study on
subter-ranean waters in Bangladesh25 showed that, in
spite of the influence of the geological process in reduction of concentration of dissolved oxygen and on the traces of metal present in the water, the route of mobilization of some metals, such as chromium, is spatially associated with the loca-tion of, for example, industrial companies deal-ing with leather.
Finally, to evaluate the effect of
anthropo-genic sources, a study in Morocco26 evaluated the
impact of three sources of pollution (slurry-pro-ducing activities, wastewater, and mining) on the physical-chemical characteristics of the surface and subterranean waters in the northern region of Marrakech. The analysis of principal compo-nents (PCA) enabled identification of the impact of the sources of pollution and the results showed that subterranean and superficial waters had al-terations in their properties due to the pollution. It is also important to point out that only six parameters were used for the assessment. It
is believed that the inclusion of other parame-ters, such as thermotolerant coliforms, sulfate, betex (benzene, toluene, ethyl benzene and xy-lenes), mercury and other toxic elements in the panel could add sensitivity to the evaluation. It is known that these variables are associated with emission of untreated domestic effluents, and wastes resulting from industrial activities, prin-cipally through construction of wells without ap-propriate technical criteria and vulnerability of the subterranean aquifer of the region. However, the use of the parameters adopted has already been sufficient to observe differences in the re-gions studied. More recent studies indicate, fur-ther, the need for specification of chemical char-acteristics of the parameters used, such as which isotopes are involved in the process of
pollu-tion27, which could help to identify the routes of
exposure of the subterranean waters, and also to establish the levels of normality (which may vary in accordance with the geological formation, and
not only due to anthropogenic sources28). For
example, a study in Saudi Arabia29 sought to
es-tablish the parameters for chemical indices such as chlorine and alkaline compounds, the sodi-um adsorption ratio, the percentage of sodisodi-um, concentration of residual sodium carbonate, and permeability index. The results show that the chemical composition of the underground wa-ters of the study location is strongly influenced by the lithology of rocks of the country, rather than anthropic activities.
Conclusion
Monitoring of water quality aims to evaluate the quality of the water consumed by the population over time, assess the efficiency of treatment, and whether there are any breakages in the distribu-tion system. The parameters used for the calcu-lation of the index of subterranean water quality indicated a better level of quality for the Mara-nhão Community, presenting an improvement in quality in the dry period, with predominance of good and very good quality, while at Vila do Conde there was a low, adverse level of quality in its waters, that is to say, at the majority of the sampling points the conditions were unaccept-able for human consumption.
M
e
d
e
ir
by these populations could be contributing to the existence or worsening of illnesses, since this consumption has been going on for a long time.
This study will be able to serve as a comple-ment to other investigations of other multidis-ciplinary areas, and alert the local authorities of these municipalities, especially in Vila do Conde in Barcarena, which requires extra efforts for at-tention to the water consumed in that district
Collaborations
AC Medeiros, MO Lima and RM Guimarães par-ticipated equally in all stages of preparation of the article.
e C
ole
tiv
a,
21(3):695-708,
2016
Agência Nacional de Águas (ANA). Guia nacional de coleta e preservação de amostras água, sedimento, co-munidades aquáticas e efluentes líquidos. Brasília: ANA; 2011.
American Public Health Association. Standard meth-ods for the examination of water and wastewater. 22th ed. Washington: American Public Health Association; 2012.
Companhia de Tecnologia de Saneamento Ambiental do Estado de São Paulo. (CETESB). Índice de Qualida-de das Águas (IQA). São Paulo, 2015. [acessado 2015 ago 28]. Disponível em: http://aguasinteriores.cetesb. sp.gov.br/wpcontent/uploads/sites/32/2013/11/02. df Oliveira IB, Negrão FI, Silva AGLS. Mapeamento dos Aquíferos do Estado da Bahia utilizando o Índice de Qualidade Natural das Águas Subterrâneas – IQNAS. Rev Científica Água Subterrânea 2007; 21(1):123-137. Silva AGL, Oliveira IB, Negrão FI. Determinação do Índice de Qualidade Natural das Águas Subterrâneas IQNAS, com Base nos Dados de Poços Tubulares do Es-tado da Bahia. Livro de Resumo do XXIV Seminário Estudantil de Pesquisa - SEMEP, UFBa. Salvador, BA, 9-12 de Novembro de 2005.
Saeedi M, Abessi O, Sharifi F, Meraji H. Development of groundwater quality index. Environ Monit Assess 2010; 163(1-4):327-335.
Vasanthavigar M, Srinivasamoorthy K, Prasanna MV. Evaluation of groundwater suitability for domestic, ir-rigational, and industrial purposes: a case study from Thirumanimuttar river basin, Tamilnadu, India. Envi-ron Monit Assess 2012; 184(1):405-420.
Shahid SU, Iqbal J, Hasnain G. Groundwater quality as-sessment and its correlation with gastroenteritis using GIS: a case study of Rawal Town, Rawalpindi, Pakistan. Environ Monit Assess 2014; 186(11):7525-7537. Singh SK, Srivastava PK, Singh D, Han D, Gautam SK, Pandey AC. Modeling groundwater quality over a humid subtropical region using numerical indices, earth observation datasets, and X-ray diffraction tech-nique: a case study of Allahabad district, India. Environ Geochem Health 2015; 37(1):157-180.
Rajankar PN, Tambekar DH, Ramteke DS, Wate SR. Statistical assessment of groundwater resourc-es in Washim district (India). J Environ Sci Eng 2011; 53(1):81-84.
Nahar MS, Zhang J, Ueda A, Yoshihisa F. Investigation of severe water problem in urban areas of a developing country: the case of Dhaka, Bangladesh. Environ Geo-chem Health 2014; 36(6):1079-1094.
Oufline R, Hakkou R, Hanich L, Boularbah A. Impact of human activities on the physico-chemical quali-ty of surface water and groundwater in the north of Marrakech (Morocco). Environ Technol 2012; 33(16-18):2077-2088.
Xue D, Pang F, Meng F, Wang Z, Wu W. Deci-sion-tree-model identification of nitrate pollution activities in groundwater: A combination of a dual isotope approach and chemical ions. J Contam Hy-drol 2015; 180:25-33.
15.
16.
17.
18.
19.
20.
21.
22.
23.
24.
25.
26.
27.
References
Barcellos C, Quitério LAD. Vigilância ambiental em saúde e sua implantação no Sistema Único de Saúde. Rev Saude Publica 2006; 40(1):170-177
Souza MM, Gastaldini MCC. Avaliação da qualidade da água em bacias hidrográficas com diferentes impac-tos antrópicos. Eng Sanit Ambient 2014; 19(3):263-274. Brasil. Constituição da República Federativa do Brasil de 1988. Diário Oficial da União 1988; 5 out.
Brasil. Lei nº 8.080, de 19 de setembro de 1990. Dispõe sobre as condições para a promoção, proteção e recu-peração da saúde, a organização e o funcionamento dos serviços correspondentes e dá outras providências. Diá rio Oficial da União 1990; 20 set.
Brasil. Ministério da Saúde (MS). Diagnóstico da estru-tura de controle e vigilância da qualidade da água para consumo humano: portaria MS n.518/2004. Resumo executivo. Brasília: MS; 2009.
Daniel MHB, Cabral AR. A Vigilância da Qualidade da Água para Consumo Humano (Vigiagua) e os Obje-tivos do Desenvolvimento do Milênio (ODM). Cad. Saúde Colet. 2011; 19(4):487-492
Brasil. Ministério da Saúde. Portaria 2.914, de 12 de dezembro de 2011. Dispõe sobre os procedimentos de controle e de vigilância da qualidade da água para consumo humano e seu padrão de potabilidade. Diário Oficial da União 2011; 14 dez.
Freitas MB, Brilhante OM, Almeida LM. Importância da análise de água para a saúde pública em duas regiões do Estado do Rio de Janeiro: enfoque para coliformes fecais, nitrato e alumínio. Cad Saude Publica 2001; 17(3):651-660.
Colvara JG, Lima AS, Silva WP. Avaliação da contami-nação de água subterrânea em poços artesianos no sul do Rio Grande do Sul. Braz. J. Food Technol. 2009; II SSA:11-14.
Companhia Docas do Pará. Relatório técnico 003: Atu-alização do plano de desenvolvimento e zoneamento do Porto de Vila do Conde, situado no Município de Barca-rena, Belém/Pará. Belém: Companhia Docas do Pará; 2010.
Instituto Internacional de Educação do Brasil. Posicio-namento da rede da sociedade civil Pró-Fórum em Bar-carena. Belém: Instituto Internacional de Educação do Brasil; 2012.
Instituto Evandro Chagas (IEC). Relatório técnico SA-MAM 001: caracterização dos impactos ambientais, da-nos ao ecossistema e riscos à saúde decorrentes do lança-mento no rio Murucupi de efluentes do processo de be-neficiamento de bauxita, Barcarena-Pará. Ananindeua: IEC; 2009.
Instituto Brasileiro de Geografia e Estatística (IBGE). Informações gerais sobre as cidades de Abaetetuba e Bar-carena no Estado do Pará. [acessado 2015 ago 30]. Dis-ponível em: http://cidades.ibge.gov.br/xtras/uf.php? lang=&coduf=15&search=para
Almeida FM, Matta MAS, Prado JB, Dias RF, Bandeira IN, Figueiredo AB, Brasil RO. Análise geométrica e sus-ceptibilidade à contaminação dos sistemas aquíferos da região de Barcarena/Pa. In: Revista Águas Subterrâneas -XIV Congresso Brasileiro de Águas Subterrâneas; 2006; São Paulo; Brasil.
1.
2.
3. 4.
5.
6.
7.
8.
9.
10.
11.
12.
13.
M
e
d
e
ir
Urresti-Estala B, Vadillo-Pérez I, Jiménez-Gavilán P, Soler A, Sánchez-García D, Carrasco-Cantos F. Appli-cation of stable isotopes (δ³4S-SO
4, δ¹
8O-SO
4, δ¹ 5
N-NO3, δ¹
8O-NO
3) to determine natural background and
contamination sources in the Guadalhorce River Basin (southern Spain). Sci Total Environ 2015; 506-507:46-57.
Toumi N, Hussein BH, Rafrafi S, El Kassas N. Groundwater quality and hydrochemical properties of Al-Ula Region, Saudi Arabia. Environ Monit As-sess 2015;187(3):84.
Article submitted 09/08/2015 Approved 04/12/2015
Final version submitted 07/12/2015 28.