VALIDATING RANKINGS IN SOCCER CHAMPIONSHIPS
Annibal Parracho Sant’Anna* and
Jo˜ao Carlos Correia Baptista Soares de Mello
Received April 14, 2010 / Accepted September 5, 2011
ABSTRACT.The final ranking of a championship is determined by quality attributes combined with other factors which should be filtered out of any decision on relegation or draft for upper level tournaments. Factors like referees’ mistakes and difficulty of certain matches due to its accidental importance to the op-ponents should have their influence reduced. This work tests approaches to combine classification rules considering the imprecision of the number of points as a measure of quality and of the variables that pro-vide reliable explanation for it. Two home-advantage variables are tested and shown to be apt to enter as explanatory variables. Independence between the criteria is checked against the hypothesis of maximal correlation. The importance of factors and of composition rules is evaluated on the basis of correlation between rank vectors, number of classes and number of clubs in tail classes. Data from five years of the Brazilian Soccer Championship are analyzed.
Keywords: soccer, performance management, probability.
1 INTRODUCTION
In 2006, the Brazilian Football Confederation (CBF) inaugurated a new structure for Brazilian football championships with the two highest leagues (1stand 2nddivision) with 20 teams playing against each other in a double robin format with 3 points per win and one per draw. The four teams with the lowest number of points in each division are relegated. The four with the highest number of points in the 2nd division are promoted to the 1st, while the four with the highest number of points in the 1stare selected to play Americas’s Liberators Cup, the Latin Amer-ican equivalent to the Champions Cup of Europe. This model, copied from European countries, intended to emphasize technical criteria and to stimulate offensive tactics, making the games more interesting and bringing more attendance to the soccer fields.
The practice did not accomplish the intentions of this move. In 2010 the average attendance per game was well below 15000 in the 1stdivision and around 5000 in the 2nd against an average
*Corresponding author
around 17000 and 7000 in the preceding years. The number of goals scored declined. Experts link that to disillusion of fans with clearly unfair relegation of important clubs. The rule of three points per win makes the final round decisive for relegation and promotion for many clubs, while the lack of motivation of opponents by then away from that dispute brings abnormal results, suspects of bribing and violent protests.
The effects of the three-points-per-win rule were studied already, for instance, by Palacios-Huerta (2004) and Bloyce & Murphy (2008). It is supposed to induce more offensive moves when the game is drawn, but what has been observed is that it inhibits the offensive posture of the team that scores first or gets a one goal lead along the game. Its evident flaw is that it assigns different weights to matches that finish with or without a winner.
Passion for soccer in Brazil developed along the twentieth century with limited influence of social factors like disputes between cities. There was a rivalry between the neighbour states of Rio de Janeiro, where was located the country capital for the largest part of the century and S ˜ao Paulo, with the economic hegemony in the country long before it was accomplished the move of the capital to Brasilia, in the hinterland. During the decades of 50 and 60 the unique inter-states tournament involved only clubs of the states of Rio de Janeiro and S˜ao Paulo. In the other states there was frequently a double preference for a time of Rio de Janeiro or S˜ao Paulo and a local team, the national sympathy prevailing over the local preference. A National championship only started to happen by the end of the 60’s. After that, in each state there remains some emulation between a small number of local clubs, usually two, and in matches between the team preferred in a national view and another antagonized in local grounds, the fan would strongly favour the team out of the state. This results in a culture where fidelity to the club plays an important role.
The Board ruling Soccer maintains, against a trend observed in other sports, that soccer rules are simple enough to be applied by a monocratic referee without any technical help to revise con-troversial decisions. For youngsters, seeing their preferred team presenting good performances and being unfairly evaluated is a motive for upheaval. Field game invasion and stadium plunder followed the relegation of Coritiba in 2009. This is not a general rule, since, for instance, Santa Cruz, a club that suffered successive relegations, although strongly complaining of referees’ ma-licious decisions, keeps driving large and well-behaved crowds to support it. Recently, even relegated to the 4thnational division, it won the Pernambuco state championship with national
records of attendance. But if injustice could be avoided, it would certainly help to raise moral standards.
Sant’Anna (2008) developed probabilistic procedures to derive alternative distributions into or-dered classes that would avoid the anticipation of promotion and of relegation. In this approach, small differences in the official number of points contradicted by the performance according to other criteria are erased. On the other hand, a parallel classification may be applied to untie clubs with the same number of points earned.
These relations need neither be transitive nor complete. They are set in terms of probabil-ities of preference between pairs. From these pairwise comparisons are derived probabilprobabil-ities of global preference according to the decision relations and according to the condition relations and the granularity of the classes is derived from the roughness in the measurement of such global preferences.
The inconsistencies between the two classifications give rise to a revision of the basic one, pro-duced by sectioning or aggregating its classes. Aggregation is propro-duced by erasing contradic-tions: if ‘X’ is preferred to ‘Y’ according to one of the classifications and ‘Y’ is preferred to ‘X’ according to the other, then a draw between ‘X’ and ‘Y’ is established. Sectioning occurs because, if elements ‘X’ and ‘Y’ are in the same class in one of the classifications, but ‘X’ is preferred to ‘Y’ according to the other, this last preference prevails.
There must be some coherence between the decision and condition relations. If they are highly contradictory, the final classes will be too large. On the other hand, if they are highly coin-cident the procedure will not reach its goal of improving the initial classification by increasing indiscernibility when needed.
A set of alternative classification rules to assure clearer cut points in the official ranking was studied by Sant’Annaet al.(2010), to the championships of 2006 and 2007. These rules com-bined three explanatory variables: number of goals scored by the team, number of goals taken and the balance of goals in the two games against each opponent. More consistent results are derived here from the analysis of a period of five years.
The preceding study did not take into account the phenomenon of “home advantage”. The importance of this element has been stressed in a large set of studies (Courneya & Carron, 1992; Balmeret al., 2001, 2003; Thomaset al., 2004; Jacklin, 2005; Pollard, 2006; Lacerda & Soares de Mello, 2007; Lewiset al., 2007; Page & Page, 2007). The existence of two turns in a long championship is not enough to deal with the distortions due to it, as in the second turn the games become more decisive. Just one error of the referee under pressure of the stands may result in a decisive difference of points. The contribution of the referees for the home advantage is studied, for instance, by Nevillet al.(2002), Groot (2005), Boykoet al.(2007), Dawsonet al.(2007) and Downward & Jones (2007).
The balance in direct confrontation helps taking this last feature into account as playing at home may affect differently games, for instance, against more popular or unpopular opponents, as observed by Leifer (1995), Madrigal & James (1999) and Nevilet al.(2002). But this is only one of many possible effects of playing at home.
Other factors affecting the results of soccer games are suggested in the literature (Carmichael
condition relations if a more precise representation is required. The criteria composition must be formulated then in such a way as preventing that the increase in the number of explanatory factors reduce excessively the number of resulting classes.
Here, classifications rules that take into account, besides the three factors considered in Sant’Annaet al.(2010), one more variable related to home advantage are studied here. Two new factors are considered separately: the presence of less games with home advantage for clubs of states with a larger number of clubs in the championship and the quality of the team playing away, measured by the balance of goals scored and taken in such games.
Different forms of composition were extensively compared in Sant’Anna et al. (2010). The composition algorithms here employed are those that produced the best fit to the number of points in those analyses. They take, as scores for the joint ranking, probabilities of simultaneous preference according to the whole set of criteria. This composition approach is in accordance with the idea that in Sports, excellence under every criterion must be required.
The composition rules proposed for promotion are different of those proposed for relegation. For promotion, the alternative classification is derived from the probability of being the best according to every criterion. For relegation, is tried, instead, the probability of not being the worst, again according to all the criteria.
Two different forms of computation of these probabilities are employed. The first assumes inde-pendence between the disturbances affecting the score of each club on each factor. The second preserves the independence between different teams but the scores of the same team according to different criteria are assumed to present maximal correlation.
The next section describes the probabilistic composition rules applied. Peculiarities of the application of the probabilistic approach to the classification of teams in a championship are discussed in Section 3. An introductory example of its application is described in Section 4. The inclusion of the explanatory variable measuring home advantage is more deeply discussed in Sec-tion 5. Changes in the results due to taking correlaSec-tion into account in the criteria composiSec-tion procedure are examined in Section 6. Section 7 presents general conclusions.
2 PROBABILISTIC CRITERIA COMPOSITION
In the first composition procedures here studied, designed to assist on the cuts at the top of the Standings, the probabilistic composition employs as the global preference score the probability of being the best according to all the criteria. That means, the score of each team is the prob-ability of, when compared to every opponent, beating it under every criterion. Assuming inde-pendence, this probability is the product of the probabilities of beating each opponent according to each criterion.
The other composition, designed to assist on relegation decisions, considers the inverted pref-erences. The global score combines the probabilities of not being beaten by all the opponents according to all the criteria. It is given, assuming independence, by the rest to 1 of the product, along the set of all opponents, of the probabilities of being beaten according to each criterion.
An assumption of positive correlation between the criteria may be more reasonable than that of independence. In fact, good offensive and defensive abilities help each other. Besides, the performance along the whole championship is related to the performance against each opponent. Simpler measures may be derived if we assume that these correlations are as high as possible. In that case, the product of probabilities according to each criterion must be replaced by the minimum of the factors of such product. This is so by the simple reason that the probability of joint occurrence of two events cannot be larger than the probability of each of them isolated. It will be verified in the development of this study that employing the product, instead of the minimum, increases the explanatory power of the alternative classification.
Before combining the criteria, the distribution of probabilities of preference according to each criterion must be determined. To estimate these probabilities, Sant’Anna et al. (2010) pro-posed a Pareto law, relating to the positive value z of the difference between teams X andY
the probability pY X(z) = 1/(z+1)/(z+2)of preference of Y over X and the probability
pX Y(z)=1−pY X(z)of preference of X overY. In the case of a draw, that means, ofz =0,
the probability is pX Y(0)= pY X(0)=1/2.
With that, the composition will assign less importance to direct confrontation balances, which present, naturally, smaller values than the comparisons by the sums of goals in all matches. This suitably reflects, without the need of assigning weights to the criteria, the fact that the total values provide more stable information. On the same way, for the variables related to home advantage, the variable indicating the number of games with home advantage will be given less importance than the balance of goals away from home.
3 STRATEGIES FOR JOINT EVALUATION OF THE TEAMS
The basic idea is that of placing any club that is ranked above another in one of the two classi-fications and not below it in the other in a class above it and placing in the same class clubs that are ranked in opposite orders in the two classifications.
The confirmation of the cutting points by alternative rules based on a set of relevant criteria reinforces the legitimacy of relegation and promotion decisions. The relegation of important clubs, like Corinthians in 2006, Atl´etico-MG in 2007, Vasco da Gama in 2008 and Coritiba in 2009, all easily returning the next year to the 1stdivision, was a source of hard questioning of the validity of soccer results. The menace of facing surprising relegations like those is considered an important cause of loss of interest in the championship.
The use of a rule that employs different factors in alternative classifications helps to avoid anti-cipation of ranks that would result in loss of motivation for some clubs in the final rounds dis-torting the final outcome. Besides, when the technical alternative classification contradicts the official classification this may be an indication of extra-field influences affecting the results of the games of some teams.
Along the five years, the application of the alternative classification separates small classes at the upper and lower extremes of the ranking. Specially, the champion and the last ranked usually form a unitary class. Only in 2009, it is found the ranking based on the variables alternatively measuring the quality of the teams in strong disagreement to the ranking based on points earned from wins and draws. Two clubs, Flamengo and Fluminense, developed strong drives along the last weeks of the championship. The first is traditionally known as able to, driven by the enthusiasm of its huge crowd of supporters, overcome its limitations when there is a chance of being the champion, what finally happened, and the second was motivated by the possibility of escaping relegation after a pretty bad first half of the championship. On the other side, Palmeiras, who had been leading the Standings most of the time, scored only eight points along the last ten games when it faced opponents highly motivated, two of them being precisely Flamengo and Fluminense.
4 THE ALTERNATIVE CLASSIFICATIONS
Different classifications to confront the official ranking by points are here considered. All of them include, as explanatory variables, the number of goals scored and taken and the balance of direct confrontations. Compositions with a fourth variable related to home advantage are also considered. This fourth variable may be an indicator of the presence of local opponents or the balance of goals as a visitor. The effect of addition of these variables will be compared in the next section. In the present section, only the balance of goals as a visitor will be added.
Two composition approaches are taken: the promotion composition, by the probability of being the best according to all the explanatory variables, or the relegation composition, by the probab-ility of not being the worst according to all these variables.
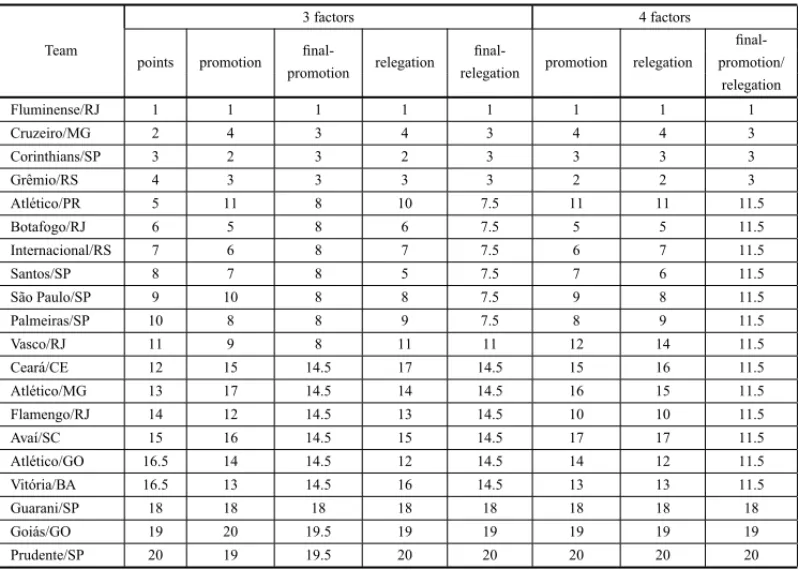
Table 1– 2010 rankings for different composition rules.
3 factors 4 factors
Team final- final-
final-points promotion
promotion relegation relegation promotion relegation promotion/ relegation
Fluminense/RJ 1 1 1 1 1 1 1 1
Cruzeiro/MG 2 4 3 4 3 4 4 3
Corinthians/SP 3 2 3 2 3 3 3 3
Grˆemio/RS 4 3 3 3 3 2 2 3
Atl´etico/PR 5 11 8 10 7.5 11 11 11.5
Botafogo/RJ 6 5 8 6 7.5 5 5 11.5
Internacional/RS 7 6 8 7 7.5 6 7 11.5
Santos/SP 8 7 8 5 7.5 7 6 11.5
S˜ao Paulo/SP 9 10 8 8 7.5 9 8 11.5
Palmeiras/SP 10 8 8 9 7.5 8 9 11.5
Vasco/RJ 11 9 8 11 11 12 14 11.5
Cear´a/CE 12 15 14.5 17 14.5 15 16 11.5
Atl´etico/MG 13 17 14.5 14 14.5 16 15 11.5
Flamengo/RJ 14 12 14.5 13 14.5 10 10 11.5
Ava´ı/SC 15 16 14.5 15 14.5 17 17 11.5
Atl´etico/GO 16.5 14 14.5 12 14.5 14 12 11.5
Vit´oria/BA 16.5 13 14.5 16 14.5 13 13 11.5
Guarani/SP 18 18 18 18 18 18 18 18
Goi´as/GO 19 20 19.5 19 19 19 19 19
Prudente/SP 20 19 19.5 20 20 20 20 20
strategies of composition of the explanatory factors assuming independence and the ranks of the classes they come to belong after the aggregating and sectioning procedures are applied.
The columns of Table 1 headed by the wordpromotionpresent the ranks of the clubs when their scores are calculated by multiplying the probabilities of beating every opponent according to each criterion. For thek-th club these probabilities are given by 1/(zi j k+1)/(zi j k+2)where
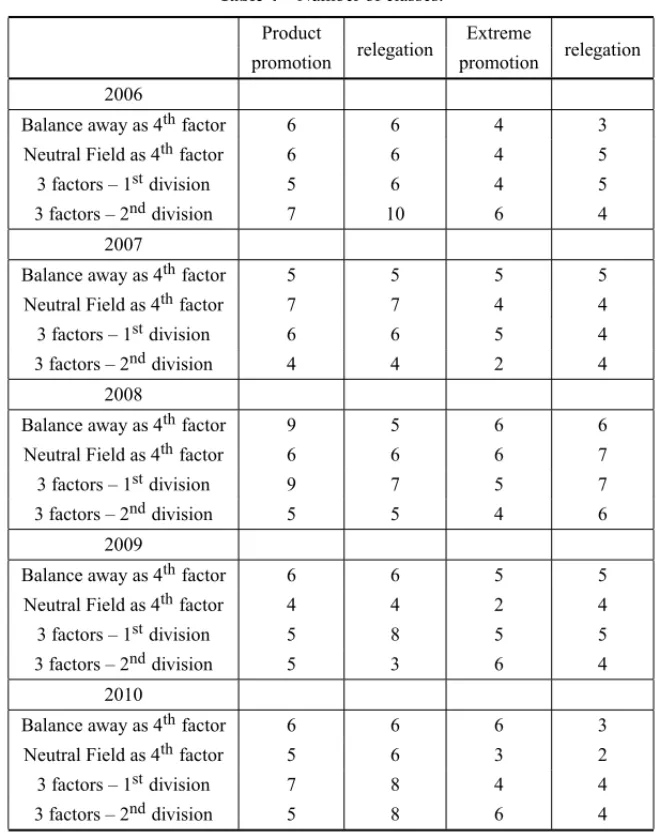
zi j k is the difference between the values for thek-th and j-th row in Table 2 fori representing variables in that table andzi j kis the entry in thek-th row andj-th column of Table 3 for the case ofi representing direct confrontation. Conversely, rankings derived from the multiplications of the complements to 1 of these factors form the columns headed by the wordrelegation.
Those columns with the wordfinalin the heading present the rankings generated by eliminating all contradictions between the respective promotion or relegation column and the second column, that with the ranking according to points earned.
When the fourth variable, balance away, is added, the final rankings are the same, whether as-suming the promotion composition or the relegation composition. This final ranking is presented in the last column of Table 1.
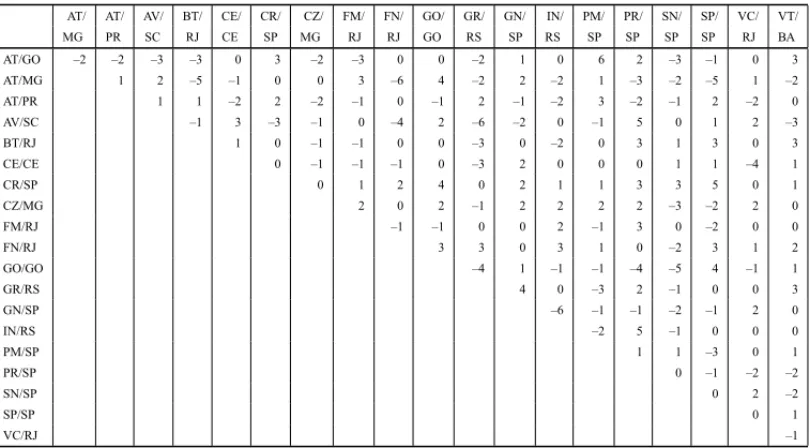
Table 2– 2010 Data of single variables.
Club points goals pro goals against Balance away
Fluminense/RJ 71 62 36 10
Cruzeiro/MG 69 53 38 3
Corinthians/SP 68 65 41 –3
Grˆemio/RS 63 68 43 4
Atl´etico/PR 60 43 45 –13
Botafogo/RJ 59 54 42 –1
Internacional/RS 58 48 41 –3
Santos/SP 56 63 50 –3
S˜ao Paulo/SP 55 54 54 –4
Palmeiras/SP 50 42 43 –4
Vasco/RJ 49 43 45 –15
Cear´a/CE 47 35 44 –19
Atl´etico/MG 45 52 64 –16
Flamengo/RJ 44 41 44 –8
Ava´ı/SC 43 49 58 –23
Atl´etico/GO 42 51 57 –13
Vit´oria/BA 42 42 48 –11
Guarani/SP 37 33 53 –22
Goi´as/GO 33 41 68 –18
Prudente/SP 31 39 64 –25
standings and below the 10thin most of the alternative classifications. On the opposite hand, clubs of Rio de Janeiro, like Fluminense and Vasco da Gama, present better ranks in the alter-native classifications than in the classification by points. This seems to confirm a saying that the kind of soccer played by the clubs of the South is more driven to outcomes while the soccer played by the teams of Rio de Janeiro, even though more attractive for the spectators, is less appropriate to win the competitions.
Table 1 reveals that it is easy to separate the champion as well as the set of four clubs at the upper end in 2010. It is also easy to separate three clubs at the lower end. In the other years, except in 2009, it was easy to separate one team at the upper end,i.e., the champion, and another as the last in line, at the lower end. Cuts at inner points are more difficult to determine.
Noticeable in Table 1 is also that the only tie in number of points in 2010 happened between Atl´etico-GO and Vit´oria, for the last relegation decision. Vit ´oria, which would be ahead of Atl´etico-GO if the symmetric instead of the three-points-per-win counting were adopted, was relegated on the basis of an untying rule that overvalued once more the number of wins.
If the untying rule were based on attendance in hosted games, Vit ´oria would stay in the 1st divi-sion and Atl´etico-GO would be relegated. In fact, even though in a bad championship campaign, Vit´oria was ranked 12th in attendance to the 2010 Brazilian championship, while Atl´etico-GO was the 17th, ahead only of the three other relegated clubs: Guarani was the 18th, Goi´as the 19th and Prudente the 20th, in attendance as well as in number of points won. The attendance crite-rion is in 2010 in good agreement with the points critecrite-rion. In Brazil, this critecrite-rion, if carefully applied, would award states of lower per capita income like Bahia, Cear´a and Pernambuco the presence in the 1stdivision of the Brazilian championship that has been sometimes denied and, technically, would do justice to the quality of the teams of these states.
Table 2 presents the points earned and the values of three explanatory variables: goals scored and suffered and balance away. Table 3 presents the balance of direct confrontations. The official rankings, as well as the values of the explanatory variables, were extracted from CBF (2010).
5 THE EFFECT OF HOME ADVANTAGE
Adding a fourth variable representing home advantage to those employed in Sant’Anna (2010) to derive the alternative classifications is here considered. Home advantage frequently decides soccer matches. Nevillet al.(1996) verified, comparing outcomes of matches of different divi-sions that the teams playing at home would more probably beat the visitors in those dividivi-sions with higher public interest.
By this reason, and because, along all the period considered, the Brazilian 2nd division rarely had clubs of the same city, the analysis of home advantage is here limited to the 1st division, where clubs of Rio de Janeiro, S˜ao Paulo, Minas Gerais and Goi´as face the teams of the same state in a neutral field. The states of Paran´a, Pernambuco and Rio Grande do Sul had also more than one team in the 1stdivision each, but, there, each team plays in its own stadium and limits presence of opponent supporters to a small space, what allows to preserve some home advantage even against teams of the same city. So, the first variable created to represent home advantage was built assigning a handicap of two for the teams of that first set of states and a handicap of one for the teams of these last states.
A second proxy for home advantage was built with a smaller expected effect on changing the classification, but with a higher expected quality on evaluating the strength of the teams. It is given by the balance of goals in the games hosted by the opponent. i.e., the difference between the number of goals scored and the number of goals taken in all the games played on foreign grounds.
The addition of these variables had a small effect along the 5 years studied, as we will see in more detail when analysing the tables of the next section. This result shows that they can be employed in practice to improve the classification without excessively reducing the number of final classes. The addition of a fourth variable in the composition has generally the effect of mixing up the objects that we intend to separate, an effect that is expected to increase as the new variable has a smaller explanatory power.
In fact, adding, as a fourth explanatory variable, a variable measuring factors with a more in-direct effect on the outcomes, such as popularity, measured by the number of spectators in the championship games of the clubs during the last years, or long range power of the teams, measured by their sum of points along the preceding championships, could not be recommended, as the number of classes generated became much smaller.
6 COMPARISON OF ALTERNATIVE ASSUMPTIONS
In this section the results obtained for the different models under the assumption of independ-ence between preferindepend-ences according to the various criteria are compared to the results obtained under the assumption of dependence above discussed. The joint probabilities assuming such de-pendence between the distinct criteria are given by the minimum of the probabilities according to each criterion isolated, instead of the product. This leads to disregard in the computations part of the available numerical information, what, in previous analyses, resulted in smaller ex-planatory power relatively to the composition under independence, with the vectors of scores derived from independence presenting a higher correlation with the official classification. For this reason, we consider here only dependence between the criteria, not between the evaluations of different clubs by the same criterion. This limited dependence assumption leads to vectors of scores closer to those obtained by independence, with the same set of classes sometimes.
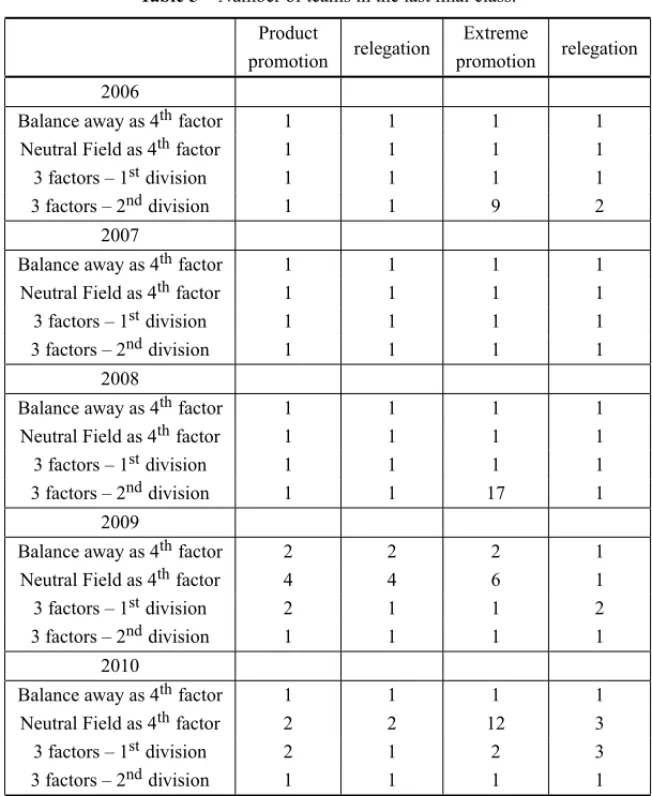
Tables 4, 5 and 6 reveal, by diverse features, the differences between classification approaches. They show clearly the best explanatory power obtained when independence is assumed and the final scores are given by the products of the evaluations according to the different criteria instead of the minima, but other differences can also be noticed. Table 4 presents the number of classes obtained after the alternative classification is combined with the official classification. Table 5 presents the number of teams in the lowest final class. Similar results are obtained for the number of teams in the front class. Table 6 presents the Spearman correlation between the initial and final classifications,i.e., the coefficients of correlation between the vectors of ranks obtained before and after applying the comparison between the official and the alternative classifications.
In all these tables, for each year, the values in the first row correspond to the classification with the balance of goals away included as a fourth explanatory variable for the results of the 1stdivision and the second row corresponds to the handicap for games in neutral field included instead. The third and fourth rows correspond to the models with the three variables employed in Sant’Anna
et al.(2010), respectively for the 1stand the 2nddivision.
In Table 4, only four times the number of classes generated is larger when the hypothesis of correlation is applied, showing the advantage of employing the product of the probabilities of preference by each criterion. The differences from one row to the other are all small, showing that the inclusion of a variable to take into account home advantage will not reduce the number of cuts in an important manner. It can be noticed also that no systematic difference can be noticed between the results for the 1stand the 2nddivision.
Table 4– Number of classes.
Product Extreme
promotion relegation promotion relegation
2006
Balance away as 4thfactor 6 6 4 3
Neutral Field as 4thfactor 6 6 4 5
3 factors – 1stdivision 5 6 4 5
3 factors – 2nddivision 7 10 6 4
2007
Balance away as 4thfactor 5 5 5 5
Neutral Field as 4thfactor 7 7 4 4
3 factors – 1stdivision 6 6 5 4
3 factors – 2nddivision 4 4 2 4
2008
Balance away as 4thfactor 9 5 6 6
Neutral Field as 4thfactor 6 6 6 7
3 factors – 1stdivision 9 7 5 7
3 factors – 2nddivision 5 5 4 6
2009
Balance away as 4thfactor 6 6 5 5
Neutral Field as 4thfactor 4 4 2 4
3 factors – 1stdivision 5 8 5 5
3 factors – 2nddivision 5 3 6 4
2010
Balance away as 4thfactor 6 6 6 3
Neutral Field as 4thfactor 5 6 3 2
3 factors – 1stdivision 7 8 4 4
3 factors – 2nddivision 5 8 6 4
Table 5– Number of teams in the last final class.
Product Extreme
promotion relegation promotion relegation
2006
Balance away as 4thfactor 1 1 1 1
Neutral Field as 4thfactor 1 1 1 1
3 factors – 1stdivision 1 1 1 1
3 factors – 2nddivision 1 1 9 2
2007
Balance away as 4thfactor 1 1 1 1
Neutral Field as 4thfactor 1 1 1 1
3 factors – 1stdivision 1 1 1 1
3 factors – 2nddivision 1 1 1 1
2008
Balance away as 4thfactor 1 1 1 1
Neutral Field as 4thfactor 1 1 1 1
3 factors – 1stdivision 1 1 1 1
3 factors – 2nddivision 1 1 17 1
2009
Balance away as 4thfactor 2 2 2 1
Neutral Field as 4thfactor 4 4 6 1
3 factors – 1stdivision 2 1 1 2
3 factors – 2nddivision 1 1 1 1
2010
Balance away as 4thfactor 1 1 1 1
Neutral Field as 4thfactor 2 2 12 3
3 factors – 1stdivision 2 1 2 3
3 factors – 2nddivision 1 1 1 1
7 FINAL COMMENTS
Identification with clubs has an important role in behaviour in present times, mainly for younger generations. It has effects on the identity development of children (Erikson, 1968; Hughsonet al., 2005). Thus the fair classification of the clubs is a matter of social concern.
The evidence here brought is in the direction to sustain that the number of points earned, in a count of three points by win and one by draw, may not even choose the best as the champion and the worst as the last ranked. At least for intermediary cuts, it has been made pretty clear that other variables should help the classification.
Table 6– Correlation to the vector of points earned.
Product Extreme
promotion relegation promotion relegation
2006
Balance away as 4thfactor 0.96 0.76 0.76 0.62
Neutral Field as 4thfactor 0.96 0.96 0.76 0.85
3 factors – 1stdivision 0.88 0.96 0.76 0.85
3 factors – 2nddivision 0.95 0.97 0.94 0.88
2007
Balance away as 4thfactor 0.70 0.70 0.71 0.71
Neutral Field as 4thfactor 0.81 0.82 0.63 0.63
3 factors – 1stdivision 0.85 0.82 0.71 0.63
3 factors – 2nddivision 0.86 0.86 0.88 0.71
Balance away as 4thfactor 0.93 0.63 0.81 0.96
2008
Balance away as 4thfactor 0.93 0.63 0.81 0.96
Neutral Field as 4thfactor 0.94 0.95 0.93 0.94
3 factors – 1stdivision 0.96 0.97 0.92 0.97
3 factors – 2nddivision 0.76 0.76 0.62 0.85
2009
Balance away as 4thfactor 0.97 0.88 0.85 0.69
Neutral Field as 4thfactor 0.81 0.81 0.80 0.69
3 factors – 1stdivision 0.88 0.85 0.87 0.87
3 factors – 2nddivision 0.89 0.52 0.91 0.62
2010
Balance away as 4thfactor 0.85 0.85 0.85 0.52
Neutral Field as 4thfactor 0.95 0.96 0.88 0.62
3 factors – 1stdivision 0.97 0.97 0.81 0.93
3 factors – 2nddivision 0.87 0.91 0.93 0.88
taken, attends the interest in stimulating offensive strategies. Composing these explanatory vari-ables in an aggregate score helps to avoid manipulation and leads the interest for each club game till the last round.
The results obtained show that the validation of the classification by points by alternative classi-fication rules taking into account multiple performance variables can be done. In particular, the influence of home advantage can be taken into account in different manners.
ACKNOWLEDGMENTS
We are grateful for the referees comments, that helped us to considerably improve the text, even though mistakes eventually remaining are no doubt of our entire responsibility. We are also thankful for the support provided by CAPES, CNPq and FAPERJ.
REFERENCES
[1] BALMER NJ, NEVILL AM & WILLIAMS AM. 2001. Home advantage in the Winter Olympics (1908-1998).Journal of Sports Sciences,19(2): 129–139.
[2] BALMERNJ, NEVILLAM & WILLIAMSAM. 2003. Modelling home advantage in the Summer Olympic Games.Journal of Sports Sciences,21(6): 469–478.
[3] BARROSCP & LEACHS. 2006. Performance evaluation of the English premier football league with data envelopment analysis.Applied Economics,38(12): 1449–1458.
[4] BLOYCE D & MURPHY P. 2008. Sports administration on the hoof: The three points for a win “experiment” in English soccer.Soccer and Society,9(1): 14–27.
[5] BOYKO RH, BOYKO AR & BOYKO MG. 2007. Referee bias contributes to home advantage in English premiership football.Journal of Sports Sciences,25(11): 1185–1194.
[6] CALOBAGM & LINSMPE. 2006. Performance assessment of the soccer teams in Brazil using DEA. Pesquisa Operacional,26(3): 521–536.
[7] CARMICHAELF, THOMASD & WARDR. 2000. Team performance: The case of English premier-ship football.Managerial and Decision Economics,21(1): 31–45.
[8] CBF. 2010. Site of Brazilian Championships, http://www.cbf.com.br.
[9] COURNEYA KS & CARRON AV. 1992. The home advantage in sport competitions: A literature review.Journal of Sport & Exercise Psychology,14(1): 13–27.
[10] DAWSONP, DOBSONS, GODDARDJ & WILSONJ. 2007. Are football referees really biased and inconsistent? Evidence on the incidence of disciplinary sanction in the English premier league. Journal of the Royal Statistical Society. Series A: Statistics in Society,170(1): 231–250.
[11] DOWNWARDP & JONESM. 2007. Effects of crowd size on referee decisions: Analysis of the FA cup.Journal of Sports Sciences,25(14): 1541–1545.
[12] ERIKSONEH. 1968. Identity: Youth and crisis. New York: W.W. Norton.
[13] ESPITIA-ESCUER M & GARC´IA-CEBRIAN´ LI. 2004. Measuring the efficiency of Spanish first-division soccer teams.Journal of Sports Economics,5(4): 329–346.
[14] GELADEGA & DOBSONP. 2007. Predicting the comparative strengths of national football teams. Social Science Quarterly,88(1): 244–258.
[15] GODDARDJ. 2006. Who wins the football?Significance,3(1): 16–19.
[16] GRECOS, MATARAZZOB & SLOWINSKIR. 1999. Rough Approximation of a Preference Relation by Dominance Relations.European Journal of Operations Research,19: 63–83.
[17] GROOTL. 2005. Referees among most important players in soccer tournaments.Journal of Sport and Social Issues,29(4): 437–442.
[19] HOFMANNR, GINGLC & RAMASAMYB. 2002. The socio-economic determinants of international soccer performance.Journal of Applied Economics,5(2): 253–272.
[20] HUGHSONJ, INGLISD & FREEM. 2005. The uses of sports: A critical study. London: Routledge.
[21] JACKLINPB. 2005. Temporal changes in home advantage in English football since the Second World War: What explains improved away performance?Journal of Sports Sciences,23(7): 669–679.
[22] LACERDAFG & SOARES DEMELLO JCCB. 2007. An´alise preliminar de existˆencia de home ad-vantage aplicada ao desempenho da Rep ´ublica Dominicana na hist ´oria dos jogos pan americanos. Relat´orios de Pesquisa em Engenharia de Produc¸ ˜ao,7(8).
[23] LEIFER EM. 1995. Perverse effects of social support: Publics and performance in major league sports.Social Forces,74: 81–118.
[24] LEWISHF, SEXTONTR & LOCKKA. 2007. Player salaries, organizational efficiency, and compet-itiveness in major league baseball.Journal of Sports Economics,8(3): 266–294.
[25] MADRIGALR & JAMESJ. 1999. Team quality and the home advantage.Journal of Sport Behavior, 22: 381–398.
[26] NEVILLAM, BALMERNJ & WILLIAMSAM. 2002. The influence of crowd noise and experience upon referring decisions in football.Psychology of Sport and Exercise,3(4): 261–272.
[27] NEVILLAM, NEWELLSM & GALES. 1996. Factors associated with home advantage in English and Scottish soccer matches.Journal of Sports Sciences,14(2): 181–186.
[28] PAGEL & PAGEK. 2007. The second leg home advantage: Evidence from European football cup competitions.Journal of Sports Sciences,25(14): 1547–1556.
[29] PALACIOSHUERTAI. 2004. Structural Changes During a Century of the World’s Most Popular Sport. Statistical Methods and Applications,13(2): 241–258.
[30] PAWLAKZ. 1982. Rough Sets.International Journal of Computer and Information Sciences, 11: 341–356.
[31] POLLARDR. 2006. Worldwide regional variations in home advantage in association football.Journal of Sports Sciences,24(3): 231–240.
[32] SANT’ANNAAP. 2002. Data Envelopment Analysis of randomized ranks. Pesquisa Operacional, 22(2): 203–215.
[33] SANT’ANNAAP. 2008. Rough sets analysis with antisymmetric and intransitive attributes: Classifi-cation of Brazilian soccer clubs.Pesquisa Operacional,28(2): 217–230.
[34] SANT’ANNA AP, UCHOAE & SOARES DE MELLO JCCB. 2010. Classification of the teams in the Brazilian soccer championship by probabilistic criteria composition.Soccer and Society,11(3): 261–276.