Experimental analysis of reinforced concrete
beams strengthened in bending with carbon iber
reinforced polymer
Análise experimental de vigas de concreto armado
reforçadas à lexão com polímero reforçado com ibra
de carbono
a Programa de Pós-Graduação em Engenharia Civil: Estruturas e Construção Civil, Universidade Federal do Ceará, Fortaleza, CE, Brasil; b Grupo de Pesquisa em Materiais de Construção e Estruturas - GPMATE, Universidade Federal do Ceará, Fortaleza, CE, Brasil; c Módulo Engenharia Ltda, Fortaleza, CE, Brasil.
Abstract
Resumo
The use of carbon iber reinforced polymer (CFRP) has been widely used for the reinforcement of concrete structures due to its practicality and versatility in application, low weight, high tensile strength and corrosion resistance. Some construction companies use CFRP in lexural strengthening of reinforced concrete beams, but without anchor systems. Therefore, the aim of this study is analyze, through an experimental program, the structural behavior of reinforced concrete beams lexural strengthened by CFRP without anchor ibers, varying steel reinforcement and the amount of carbon ibers reinforce
-ment layers. Thus, two groups of reinforced concrete beams were produced with the same geometric feature but with diferent steel reinforce-ment. Each group had ive beams: one that is not reinforced with CFRP (reference) and other reinforced with two, three, four and ive layers of carbon ibers. Beams were designed using a computational routine developed in MAPLE software and subsequently tested in 4-point points lexural test up to collapse. Experi
-mental tests have conirmed the efectiveness of the reinforcement, ratifying that beams collapse at higher loads and lower deformation as the amount of ibers in the reinforcing layers increased. However, the increase in the number of layers did not provide a signiicant increase in the performance of strengthened beams, indicating that it was not possible to take full advantage of strengthening applied due to the occurrence of premature failure mode in the strengthened beams for pullout of the cover that could have been avoided through the use of a suitable anchoring system for CFRP.
Keywords: lexural strengthening, carbon iber reinforced polymer, reinforced concrete beam.
Os polímeros reforçados com ibra de carbono (PRFC) têm sido bastante utilizados no reforço de estruturas de concreto armado devido à sua prati
-cidade e versatilidade na aplicação, baixo peso e elevada resistência à tração e à corrosão. Algumas empresas que atuam no mercado da constru
-ção civil utilizam o PRFC no reforço à lexão de vigas de concreto armado, contudo sem fazer uso de sistemas de ancoragem, o que inluencia na capacidade resistente da viga. Portanto, o objetivo desse trabalho é analisar, por meio de um programa experimental, o comportamento estrutural de vigas de concreto armado reforçadas à lexão com PRFC variando-se a taxa de armadura e a quantidade de camadas do reforço, sem fazer o uso de sistemas de ancoragem. Para tanto, foram produzidos dois grupos de vigas de concreto armado, de mesma característica geométrica mas com taxas de armadura distintas. Cada grupo possuía cinco vigas: uma que não foi reforçada (de referência) e as demais reforçadas com duas, três, quatro e cinco camadas de ibra de carbono. As vigas foram dimensionadas utilizando-se uma rotina computacional desenvolvida no pacote comercial MAPLE, sendo posteriormente ensaiadas à lexão em 4 pontos até o seu colapso. Os ensaios experimentais comprovaram a eicácia do reforço, constatando-se que as vigas colapsavam com cargas superiores e deformações inferiores à medida que se aumentava a quantidade de camadas de ibra no reforço. Contudo o aumento do número de camadas não proporcionou um incremento expressivo na capacidade resistente das vigas reforçadas, indicando que não foi possível tirar proveito por completo do reforço aplicado devido a ocorrência nas vigas reforçadas do modo de ruína prematuro por arrancamento do cobrimento que poderia ter sido evitado com o uso de um sistema de ancoragem adequado para o PRFC.
Palavras-chave: reforço à lexão, polímero reforçado com ibra de carbono, viga de concreto armado.
M. M. VIEIRA a
A. R. S. SANTOS b
A. M. MONT’ALVERNE b
L. M. BEZERRA b
L. C. S. MONTENEGRO c
A. E. B. CABRAL a, b
1. Introduction and justiication
A reinforced concrete structure must withstand various assaults and actions over time, and at the same time, must meet the re
-quirements of its users. However, occasionally interventions in these structures may be required to restore or increase their origi
-nal load capacity.
Among the various existing strengthening techniques of reinforced concrete structures, the carbon iber reinforced polymers (CFRP) have advantages over other strengthening materials, such as their ease of application, the material lightness, high mechanical strength, corrosion resistance, electromagnetic neutrality, among other [1].
The CFRP has been internationally studied to enhance the lexural strength of reinforced concrete beams since the 1990s [2]. Cur
-rently, it’s already being compared the performance of the carbon ibers with other ibers, such as glass [3], or being investigated the efectiveness of the transverse clamping with CFRP layers to prevent the premature debonding of the strengthening [4], as well as, being researched the use of the CFRP in the strengthening of the shear of beams [5].
In Brazil, there is already a history of research and application of CFRP in the lexural strengthening of reinforced concrete beams, such as: Beber’s work [6-7] that show the main structural implica
-tions of CFRP bonded externally to the reinforced concrete beams strengthened in bending and shear; Ferrari [8], who evaluated the eiciency of the strengthening technique in reinforced concrete beams with CFRP, with the stressed chord previously reconstitut
-ed with a high-performance composite; and Costa [9], who evalu
-ated the behavior of reinforced concrete beams strengthened with CFRP and optimization parameters of the strengthening using the reduction of anchor length. It is worth noting that in all these works the CFRP was anchored with bands on the transversal edges (transverse clamping).
According to the studies cited above, the use of the CFRP for the lexural strengthening of reinforced concrete beams has been efective both to increase the load capacity and the rigidity of the beams.
However, there are cases in Brazil in which the lexural strength
-ening of reinforced concrete beams with CFRP still has been de
-signed using commercial packages based on the requirements of the 2002 release of ACI 440.2R guide [10], which allows the design of the strengthening without the use of an anchor system for the CFRP. Thus, there are still several CFRP lexural strengthenings made commercially in beams without the use of anchor systems. It is important to highlight that the recommendation for the use of anchor systems aims to prevent a premature failure of the struc
-tural element and it can be found in various scientiic papers [6-9; 11-14]. Comparing the requirements of the 2008 release of ACI 440.2R guide [15] with the requirements of the 2002 release of the same guide [10], it can be observed that 2008 release imposed a greater constraint for the strain of the CFRP in order to avoid the occurrence of the premature failure mode.
Thus, the objective of this study is to evaluate the structural behav
-ior of reinforced concrete beams lexural strengthened with CFRP once the reinforcement rate and the amount of layers of carbon iber are varied, without the use of an anchor system for them, enabling to make an analysis of eicacy of the strengthening as a function of the load increase that is desired. The diferential of this work from others already published on the subject is that this does not use an anchor system for the CFRP, being possible use its re
-sults to guide the design of the lexural strengthening of reinforced concrete beams that do not yet use an anchor system, considering the economy and safety.
2. Materials and experimental program
2.1 Characteristics of the beams
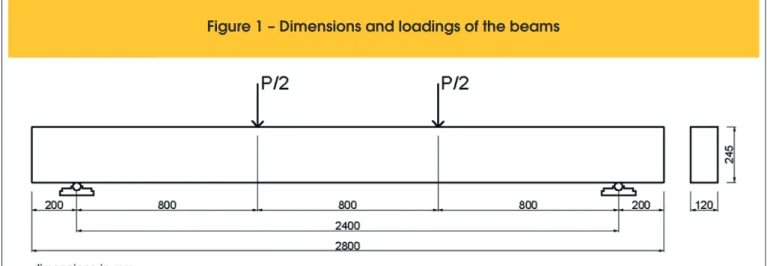
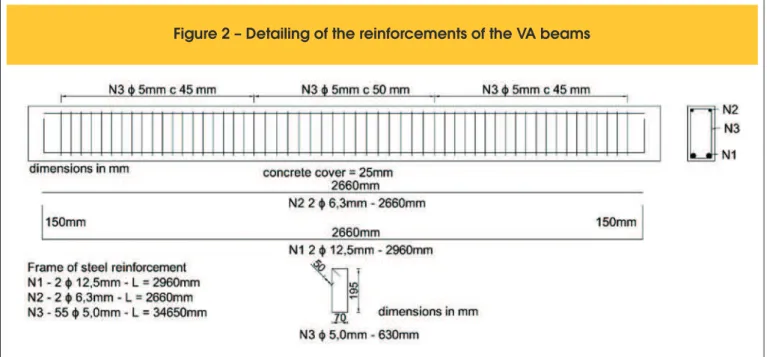
Ten reinforced concrete beams were made with rectangular cross section of 120 mm (width) by 245 mm (height) with total length of 2800 mm and span of 2400 mm, which were divided into two groups (VA and VB), diferentiated by the reinforcement rate. For the assay, the beams were simply supported and loaded with con
-centrated loads (P/2) acting on two points as shown in Figure 1. Both VA and VB beams were designed to the collapse occurs due to the yielding of the bottom longitudinal reinforcement with no crushing of the concrete in compression. In both groups, the top
reinforcement consisted of two CA-50 steel bars with diameter of 6.3 mm and stirrups of CA-60 steel bars with diameter of 5.0 mm. For the VA beams, the bottom reinforcement was composed of two CA-50 steel bars with 12.5 mm of diameter, while for the VB beams, this reinforcement was composed of two CA-50 steel bars with 10.0 mm of diameter. The Figure 2 provides the detailing of the reinforcements of the VA beams. The detailing of the VB beams is identical to the VA beams. The exception is the bottom longitudi
-nal reinforcement (N1), which is 10 mm in diameter in VB beams. All beams were built on the same day with the use of ready-mix concrete and manual casting. The concrete vibration was made with a needle immersion vibrator with 25 mm diameter. The beams and the concrete specimens were kept in wet curing on the upper surface after the concreting until the stripping, which took place three days after the concreting. After the stripping, for a period of seven days, the beams were kept in wet curing covered with geo
-textile sail humidiied twice daily. After the curing, the beams and the specimens were kept at laboratory environment until the date of the tests.
2.2 Characteristics of the CFRP strengthenings
The CFRP lexural strengthening in the beams has 2360 mm long and is centered between the supports and bonded on the bottom of the beams (Figure 3). For each group of beams were produced one reference beam (unstrengthened) and four strengthened beams with carbon iber fabric (ibers with unidirectional orien
-tation), which were positioned in the longitudinal direction of the beams, with the number of iber layers ranging from two to ive. The speciic characteristics of the concrete, steel and carbon iber used in this work are presented in Table 1.
After fourteen days from the date of the casting, the beams were strengthened following manufacturer execution procedure, which consisted of the following steps: preparation of the surface using electric sander, application of one layer of primer bicomponent (in the ratio 2:1), application of one resin layer of bicomponent regu
-larization (in the ratio 3.75:1), application of the irst layer of the bicomponent saturating epoxy resin (in the ratio 2:1) and applica
-tion of the carbon iber layers interleaved with the saturating resin.
Figure 2 – Detailing of the reinforcements of the VA beams
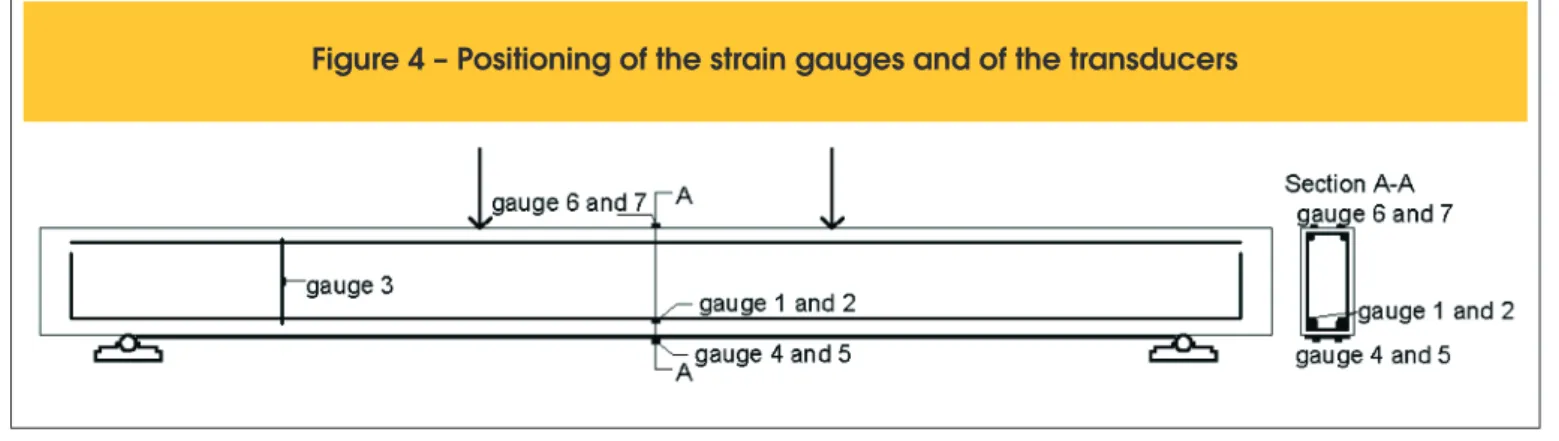
2.3 Instrumentation and description of the test
The structural behavior of the beams was monitored during the tests by the measurements of the strains on the bottom longitu
-dinal reinforcement, on the shear reinforcement, on the concrete in the compression zone and on the strengthening with the use of electrical strain gauges, while vertical displacements were mea
-sured at the mid of the central span, in one of the points of loads’
application and in the supports by displacement transducers. The load cells used had 500 KN load capacity. The Figure 4 presents, illustratively, the positioning of the beams’ instrumentation. The load, strain and displacement data were obtained in real time and simultaneously by an HBM automatic acquisition system, Spi
-der 8 model, using the Catman Easy software. The beams were tested using a frame ixed to a reaction slab positioned on both support devices. Loads were applied by means of combination
Table 1 – Characteristics of the concrete, steel and carbon fiber used
Material Input Type/Value
Concrete
Cement CP II E 32 Sand Natural; FM=2.7 Gravel Granitic; MDS=19 mm
Additive Plasticizer polyfunctional with retardant Water From the public distribution network
fck 30.0 MPa fcj 28 days 33.5 MPa fcj 135 days 44.0 MPa Ecj 135 days 30.5 GPa
Steel
Es 10 mm 189.6 GPa Es ∅ 12,5 mm 217.0 GPa fst ∅ 10 mm 655.0 MPa fst ∅ 12,5 mm 656.3 MPa
ey ∅ 10 mm 2.43 ‰
ey ∅ 12,5 mm 2.55 ‰
Carbon fiber
CFW300 Efc 230 GPa CFW300 Fabric thickness 0.166 mm Epoxy resin Ultimate strain 2.1% Epoxy resin ft 29 MPa fck: characteristic strength of the concrete; fck 28: average compressive strength of the concrete at 28 days;
fcj 135: average compressive strength of the concrete at 135 days;
Ecj 135: average modulus of elasticity of the concrete at 135 days; Es: modulus of elasticity of the steel; fst: tensile strength of the steel; ey: yield strain of the steel;
Efc: modulus of elasticity of the carbon fiber; ft: tensile strength of the epoxy resin.
Figure 5 – Beams of the VA group in the collapse. a) VA-R; b) VA-2; c) VA-3; d) VA-4; e) VA-5
VA-R beam in the collapse
VA-3 beam in the collapse
A
C
VA-5 beam in the collapse
E
VA-2 beam in the collapse
VA-4 beam in the collapse
B
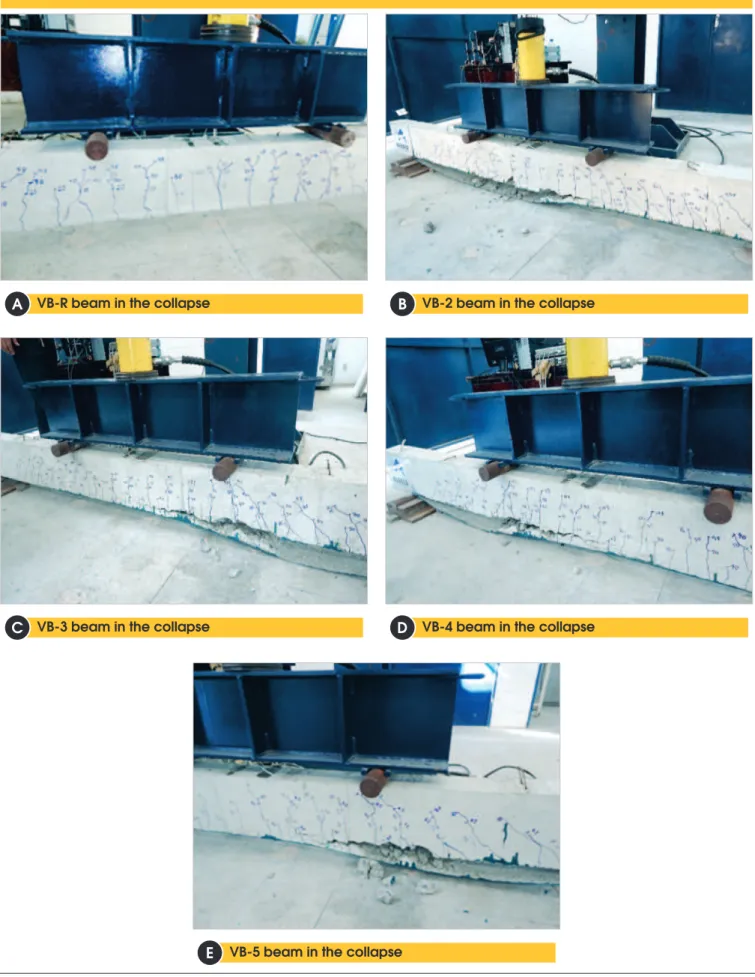
Figure 6 – beams of the VB group in the collapse. a) VB-R; b) VB-2; c) VB-3; d) VB-4; e) VB-5
VB-R beam in the collapse
VB-3 beam in the collapse
A
C
VB-5 beam in the collapse
E
VB-2 beam in the collapse
VB-4 beam in the collapse
B
composed by a hydraulic cylinder (load actuator) and a manual hydraulic jack.
The beams were subjected to simple lexural test. At the beginning of each test, the beams were subjected to a load for the accommodation of the structure, unloaded, and then loaded with increasing load until failure with intervals of load of 20 KN approximately, monitoring the propagation of the cracks in the beams throughout the tests.
3. Results and discussions
3.1 Experimental ultimate loads and failure modes
Several authors classify the failure modes of strengthened beams with CFRP in classics, namely: crushing of the concrete [16-17], yielding of the steel could be followed by the crushing of the con
-crete [16-17], yielding of the steel could be followed by the rup
-ture of the strengthening [16] and shear failure [8]; and prema-ture, such as: debonding of the strengthening by crack of bending [18] or lexure-shear, failure by debonding of the strengthening caused by critical diagonal crack [18-19], failure by rupture of the concrete cover [18], debonding of the strengthening [20], failure by debond
-ing of the strengthen-ing and by delamination of the concrete cover [18], interlaminar rupture of the strengthening [16] and debonding at the interface between the adhesive and the concrete or between the adhesive and the CFRP [16].
Figures 5-a to 5-e present the reference beams (VA-R) and of the strengthened beams with two 2), three 3), four (VA-4) and ive (VA-5) iber layers, respectively, in the collapse, while Figures 6-a to 6-e are presented the collapse of the beams of the VB group, in this same order.
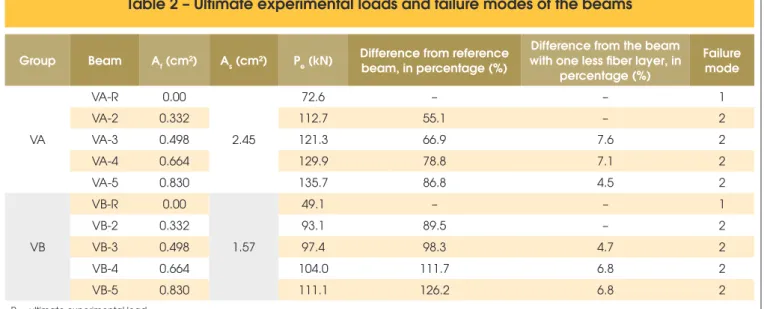
Table 2 shows the values of the ultimate experimental loads (Pe)
and the failure modes observed in the tested beams.
According to Table 2, as for VA group as for VB group, it is observed that there is an increment in the ultimate experimental load once the amount of iber layers of the strengthening is increased. In the strengthened beams of the VA group, there was a considerable increase of the load capacity with additions between 55.1% and 86.8%, for two and ive strengthening layers, respectively, relative to the reference beam VA-R, while strengthened beams of the VB group increases load even more signiicantly, ranging from 89.5% to 126.2% for two and ive strengthening layers, respectively, rela
-tive to the reference beam VB-R.
The highest increase in VB group is because all beams have lower reinforcement rate when compared with the beams of VA group. Thus, it is observed that the use of the strengthening for increas
-ing the load capacity of the beams is limited by the reinforcement rate of them. It can further be seen that for the two groups of tested beams, the largest increase in load capacity of the beams considering the number of layers used was obtained with beams strengthened with two layers of iber.
According to Table 2 data, when going from two to three, three to four and four to five layers of fiber, there were in
-creases of 7.6%, 7.1% and 4.5% respectively, to VA group and 4.7%, 6.8% and 6.8%, respectively, to VB group. This indicates that for strengthenings with more than two layers of fiber, increasing the number of layers does not provide a sig
-nificant increase in load capacity, since all the strengthened beams showed premature failure by delamination of concrete cover (failure mode 2), indicating that was not possible to take advantage completely of the applied strengthening. One solution to prevent this premature failure mode would be to use an anchor system suitable for CFRP, which has not been used intentionally in this experiment.
As can be seen in Figures 5-a, and 6-a, reference beams VA-R
Table 2 – Ultimate experimental loads and failure modes of the beams
Group Beam Af (cm²) As (cm²) Pe (kN)
Difference from reference beam, in percentage (%)
Difference from the beam with one less fiber layer, in
percentage (%) Failure mode VA VA-R 0.00 2.45
72.6 – – 1
VA-2 0.332 112.7 55.1 – 2
VA-3 0.498 121.3 66.9 7.6 2
VA-4 0.664 129.9 78.8 7.1 2
VA-5 0.830 135.7 86.8 4.5 2
VB
VB-R 0.00
1.57
49.1 – – 1
VB-2 0.332 93.1 89.5 – 2
VB-3 0.498 97.4 98.3 4.7 2
VB-4 0.664 104.0 111.7 6.8 2
VB-5 0.830 111.1 126.2 6.8 2
Pe – ultimate experimental load Af – carbon fiber area
As – area of the bottom longitudinal reinforcement 1 – failure by bending
and VB-R, respectively, showed failure by bending with exces
-sive strain in the longitudinal bottom reinforcement, observed by bending cracks in the middle of the span, followed by large strains in the concrete, occurring only in the inal loading stages, despite crushing concrete in the upper lange of the beam has not been observed.
With respect to the strengthened beams, the beginning of the failures occurred with a crack at the edge of the strengthen
-ing spread-ing in the horizontal direction, trigger-ing a process of rupture of the concrete layer near to the bottom longitudinal reinforcement (concrete cover) along the length between one of
the supports and one of the load application points, as can be
seen in Figures 5-b to 5-e and Figures 6-b to 6-e. This failure mode is well known in specialized literature and is associated with the mechanism of strain transfer between concrete and strengthening, with rupture associated with the combination of shear and tensile stresses in this region starting from the edge of the strengthening [21].
3.2 Comparison between the analytical
and experimental ultimate load results
Table 3 shows the comparisons between experimental ultimate loads (Pe) and the design analytical ultimate loads (Pa) obtained by computational analysis [22] developed in the commercial pack
-age MAPLE [23], based on 2002 release ACI 440.2R guide recom
-mendations [10].
To prevent detachment of CFRP, the implemented computational routine introduces a restriction on the strain developed through the strengthening of the coeicient km shown in Equation (1).
(1)
Table 3 – Analytical and experimental values of the ultimate loads
Group Beam As
(cm²)
Af (cm²)
Ultimate loads (kN) Percentage difference
between Pe e Pa Analytical
Pa
Experimental Pe
A
VA-R
2.45
0.00 65.0 72.6 11.8 VA-2 0.332 111.6 112.7 1.0 VA-3 0.498 127.9 121.3 -5.2 VA-4 0.664 135.3 129.9 -4.0 VA-5 0.830 146.2 135.6 -7.2
B
VB-R
1.57
0.00 41.9 49.1 17.0
VB-2 0.332 92.2 93.0 1.0
VB-3 0.498 116.8 97.4 -16.6 VB-4 0.664 124.8 103.9 -16.7 VB-5 0.830 134.8 111.1 -17.6 As – area of longitudinal bottom reinforcement
Af – area of carbon fiber
Table 4 – Vertical displacements of VA beams
Group Beam N˚ of fiber layers
Displacement for 72,6 kN
(mm)
Displacement for 110 kN
(mm)
Displacement for the ultimate load
(mm)
VA
VA-R No reinforcement 36.55 – 36.55
VA-2 2 15.90 32.30 35.15
VA-3 3 16.17 30.34 35.69
VA-4 4 14.90 23.88 35.01
VA-5 5 13.47 22.21 32.40
Where: n is the number of the CFRP layers, Efc is the elastic modu
-lus of the CFRP, tfc is the thickness of one layer of CFRP and xfc is
the strain of rupture of CFRP. The coeicient km must multiply the CFRP failure strain in order to obtain an upper limit for its strain. When analytical values are compared with experimental values of VA and VB beams, it is clear that the behavior exhibited by both groups was identical. For both VA and VB group, ultimate experimental loads were higher than the analytical ultimate loads to the beams with two layers of iber and lower to beams with 3, 4 and 5 layers. The ref
-erence beams had lower analytical loads than experimental loads. However, the percentage diferences between the analytical values and the experimental values is higher for the strengthened beams of VB group, possibly due to its lower reinforcement ratio, which allows a greater strain of the reinforcement, leading to beams with premature failure by pullout of concrete cover. Considering the experimental and analytical results of the ultimate loads of strengthened beams, it ap
-pears that the recommendations of 2002 release of ACI 440.2R guide [10] do not prevent the occurrence of such premature failure mode.
3.3 Vertical displacements
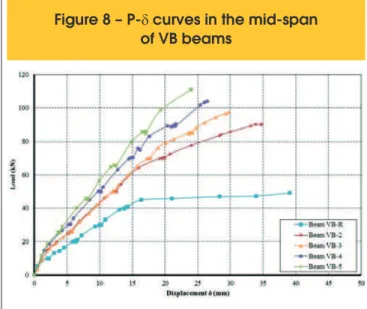
Vertical load-displacement (P-δ) curves in the middle of the span
for beams of VA and VB group are shown in Figures 7 and 8, re
-spectively, while Tables 4 and 5 shows the measured displace
-ments of VA and VB beams, respectively, for two set values of load and for the last load. The choice of the values of 72.6 kN and 49.1 kN for the VA and VA beams, respectively, was because these were the last values obtained by the data logger for reference beams of these groups, while the loads 110 kN and 85 kN for the VA and VB beams, respectively, were chosen because these values are close to the ultimate load of VA-2 and VB-2 beams, respectively. Reference beams (VA-R and VB-R) presented throughout the test, for the same load level, larger displacements than the displace
-ments of other strengthened beams of its group (Figures 7 and 8, respectively). Speciically for strengthened beams of VA group, when compared with VA-R beam in its ultimate load (72.6 kN), they showed a much more rigid behavior, with a reduction of displace
-ment ranging between 55.8 and 63.2%, for VA-3 and VA-5 beams, respectively (see Table 4). Similar behavior was observed for strengthened beams of VB group, once they showed a reduction in displacements ranging from 70.8% to 78.0% when compared with VB-R displacements in its ultimate load (49.1 kN) (see Table 5). Making an analysis in the displacement of VA group strengthened beams for 110 kN and of VB group strengthened beams for 85
Figure 7 – P-d
curves in the mid-span
of VA beams
Figure 8 – P-
of VB beams
d
curves in the mid-span
Table 5 – Vertical displacements of VB beams
Group Beam N˚ of fiber layers
Displacement for 49,1 kN
(mm)
Displacement for 85 kN
(mm)
Displacement for the ultimate load
(mm)
VB
VB-R No reinforcement 45.68 – 45.68
VB-2 2 13.22 32.64 37.62
VB-3 3 13.36 26.96 34.75
VB-4 4 10.85 21.64 30.49
VB-5 5 10.03 18.69 27.84
kN, it can be seen that the greater the number of carbon iber lay
-ers, the lower the displacements. Comparing the displacements of beams with two ibers layers of VA group (VA-2) with the values of the displacements of the strengthened beams with 3, 4 and 5 lay
-ers (VA-3, VA-4 and VA-5, respectively), it is observed that these displacements were reduced by 6.1%, 26.1% and 31.3%, respec
-tively. Making the same analysis for the beams of group B, it fol
-lows that displacements reduction were 17.4%, 33.7% and 42.7%, respectively. Thus, it is clear that increasing the number of carbon iber layers increases the stifness of the beams, reducing their displacements for the same loading level.
For the ultimate loads, strengthened beams of VA and VB groups, even increasing load capacity, had smaller displacements than the reference beams. VA-5 beam had the best performance regarding the stifness among VA group, with a displacement 11.35% less than the VA-R beam at its ultimate load. VB-5 beam had the best performance regarding the stifness among VB group, with a dis
-placement 39.05% less than VB-R.
3.4 Yielding Load and strain in the bottom
reinforcement
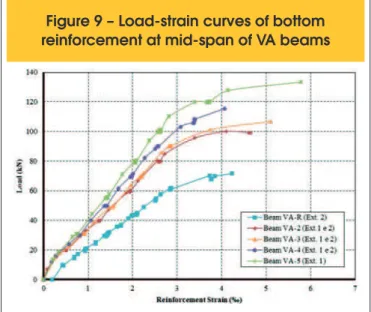
The load-speciic delection curves of bottom reinforcement of VA and VB beams are shown in Figures 9 and 10, respectively. Tables 6 and 7 present, for VA and VB groups, respectively, the values of bottom reinforcement yielding loads, the percentage diference of the values of these loads between the strengthened beam and the reference beam, the ultimate strains in the bottom reinforcement and the percentage diference between these strains.
According Figures 9 and 10, the start of the bottom reinforcement yielding of strengthened beams occurred under loads higher than the reference beam load. The increase in these loads ranged from 42.4% to 69.3% for strengthening with 2 to 5 layers, respectively, to the VA beams (Table 6), whereas for VB beams increases ranged from 71.5 % to 166.3%, also for strengthening with 2 to 5 layers,
Figure 9 – Load-strain curves of bottom
reinforcement at mid-span of VA beams
Figure 10 – Load-strain curves of bottom
reinforcement at mid-span of VB beams
Table 6 – Loads and strains in the bottom reinforcement of VA beams
Group Beam N˚ of
fiber layers
Py
(kN)
Percentage difference
(Py)
Steel’s ultimate strain (‰)
Difference between ultimate strains regarding to VA-R
VA
VA-R No
reinforcement 56.1 – 4.23* – VA-2 2 79.9 42.4 4.67* +10.4% VA-3 3 82.3 46.7 5.11* +20.8% VA-4 4 89.9 60.4 4.06* -4.0% VA-5 5 94.9 69.3 5.80* +37.1% * – record before the ultimate experimental load
Table 7 – Loads and strains in the lower reinforcement of VB beams
Group Beam N˚ of
fiber layers
Py
(kN)
Percentage difference
(Py)
Steel’s ultimate strain (‰)
Difference between ultimate strains regarding to VA-R
VB
VB-R No
reinforcement 29.9 – 5.84* – VB-2 2 51.3 71.5 6.11* +4.6% VB-3 3 63.7 113.0 6.05* +3.6% VB-4 4 67.1 124.3 5.89* +0.9% VB-5 5 79.7 166.3 3.25* -44.4% * – record before the ultimate experimental load
Bottom reinforcement area of VA beam: As = 1,57 mm² Yielding strain of steel bar of ɸ 12,5 mm is of 2,43‰ Py – Yielding load of bottom reinforcement
Table 8 – Ultimate strain of CFRP strengthening of VA beams
Group Beam N˚ of
fiber layers
Strengthening strain in reinforcement
yielding load (‰)
Pe
(kN)
Last load where reinforcement
deformation was measured
(kN)
Reinforcement ultimate strain
(‰)
Design ultimate strain according
to ACI 440.2R (2002) (‰)
VA
VA-R No
reinforcement – 72.6 – – – VA-2 2 3.04 112.7 106.4 5.90 13.13 VA-3 3 2.56 121.2 111.9 4.89 11.36 VA-4 4 2.96 129.9 126.2 6.29 9.60 VA-5 5 2.86 135.7 135.7 5.24 7.86 Bottom reinforcement area of VA beams: As = 2,45 mm²; Ultimate strengthening strain according to the manufacturer is equal to 21‰; Pe –
Ultimate experimental load
Table 9 – Ultimate strain of CFRP strengthening of VB beams
Group Beam N˚ of
fiber layers
Strengthening strain in reinforcement
yielding load (‰)
Pe
(kN)
Last load where reinforcement
deformation was measured
(kN)
Reinforcement ultimate strain
(‰)
Design ultimate strain according
to ACI 440.2R (2002) (‰)
VB
VB-R No
respectively (Table 7). Therefore, it is observed that the strength
-ening delays the beginning of the reinforcement yielding and the smaller the area of the reinforcement cross section, the lower is the reinforcement yielding load.
It is possible to see that strengthening with CFRP led, in general, to larger strains in the bottom reinforcement of VA and VB beams at the time of collapse, according to data of Tables 6 and 7, respec
-tively. For VA beams, the ultimate strains of steel was increased with the increasing of the number of strengthening layers, except for the VA-4, reaching a maximum increased value of 37.1% for the strengthened beam with 5 iber layers (VA-5). It was also ob
-served higher ultimate steel strain for VB group, compared with the strains of a reference beam (VB-R), with the exception of VB-5 beam, which has presented a substantial decrease in the ultimate steel deformation. However, it is believed that this discrepancy is a result derived from any errors occurring in results acquiring.
Comparing the recent increases in steel deformation of the beams of VA and VB groups, it appears that the increases in ultimate de
-formations obtained for VB beams were much lower than those obtained for VA beams. This can be explained because VB beams have lower reinforcement ratio than the VA beams, as well as due to the occurrence of premature failure mode.
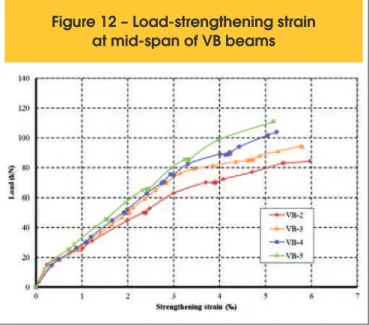
3.5 Strain in CFRP strengthening
Figures 11 and 12 show load-speciic strain curves of CFRP strengthening for VA and VB beams, respectively, whereas in Tables 8 and 9 are presented, for VA and VB beams, respectively, the values of strengthening strain in yielding load of beams bottom reinforcement, the ultimate experimental loads (Pe), the last load where strengthening strain was measured and the values of these last strain measured.
As Figures 11 and 12 shows it can be noticed that the beams strengthening of VA and VB beams deform practically equal to
Figure 11 – Load-strengthening strain
at mid-span of VA beams
Figure 12 – Load-strengthening strain
at mid-span of VB beams
Figure 13 – Load-compressed concrete strain
curves at mid-span of VA beams
Figure 14 – Load-compressed concrete
initial loads. However, for loads above 40 kN it can be realized that the strengthening with less iber layers deform more, which indicates that increasing the amount of ibers in the strengthening makes them more rigid.
According Tables 8 and 9 data, the ultimate strain measured on the VA and VB beams s
trengthening
were very close, between 4.89 ‰ and 6.29 ‰, which are below to the ultimate strengthen
-ing
strain, given by the manufacturer, which is 21 ‰. Such strains are still less to the design ultimate strain, which are obtained by multiplying the coeicient km (Equation 1) by the ultimate strain in the failure, as prescribed in 2002 release of ACI 440.2R guide (2002). This probably occurred due to the beams premature failure for pullout of concrete cover, as found in the works of Garden and Hollaway [24] Beber [6-7] and Garcez [25].According to Beber [7], there is a tendency to obtain lower ultimate strain in the strengthening when the number of iber layers is in
-creased. This behavior is well presented in the beams of VB group. To obtain higher ultimate strain on lexural strengthening of beams, one solution would be to adopt a suitable anchor system for this strengthening, thereby preventing the premature failure mode by concrete cover pull out, as cited by Beber [7].
3.6 Strain of compressed concrete
Figures 14 and 15 show load-speciic strain curves of compressed concrete for VA and VB beams, respectively. The strain values ob
-tained in the strain gages to VA-2 beam have not been consistent
and, therefore, were discarded. Table 10 shows the values of com
-pressed concrete strain of VA group for the ultimate load of refer
-ence beam (72.6 kN), as the ultimate strain of each strengthening concrete beam. Table 11 shows these same data to VB beams group, however the last load of VB-R beam is equal to 49.1 kN. A Comparison between concrete’s speciic strains is an indicator of strengthened beams performance, with respect to increased rigidity, being an indicator of the strengthening applied efectiveness. It is observed that for VA strengthened beams (Table 10), the concrete ultimate strain of reference beam had a value of 43.4%, 60.8% and 67.2% higher than in the beams with three, four and ive layers of iber, respectively. There was an error in data acquisition which pre
-vented the achievement of concrete strain of VA-2 beam.
For beams of VB group (Table 11), it is also observed a strengthen
-ing contribution for rigidity increas-ing of these beams. It is observed that concrete’s ultimate strain in the reference beam of this group showed a value of 36.1%, 88.6%, 47.5% and 80.6% higher than in the beams with two, three, four and ive layers of iber, respectively. Making a comparison between the strengthened beams of VA group in 72.6 kN (Table 10), it is observed that the beams showed similar efects up to this load regarding concrete’s strain, with an exception of the four layers of strengthening beam, which pre
-sented strains below than expected. For VB beams, in the load of 49.1 kN, they showed a signiicant reduction in concrete’s strains (between 72.5% and 77.5%), compared to reference beam strains, and a similar behavior when compared with each other.
Analyzing carefully Figures 11, 12, 15 and 16 it can be said that
Table 10 – Compressed concrete strain of VA beams
Group Beam fiber layersN˚ of Concrete strain at 72.6 kN(‰) Ultimate concrete strain(‰)
VA
VA-R No reinforcement 2.91 2.91
VA-2 2 * *
VA-3 3 0.96 2.03
VA-4 4 0.74 1.81
VA-5 5 0.90 1.74
Bottom reinforcement area of VA beams: As = 2,45 mm² * inexistent data due to error in capture
Table 11 – Compressed concrete deformations of VB beams
Group Beam N˚ of
fiber layers
Concrete strain at 49.1 kN (‰)
Ultimate concrete strain (‰)
VB
VB-R No reinforcement 2.98 2.98
VB-2 2 0.74 2.19
VB-3 3 0.74 1.58
VB-4 4 0.82 2.02
VB-5 5 0.67 1.65
VA-R and VB-R failures occurred as design predicted, with the bottom longitudinal reinforcement yielding and with no crushing of compressed concrete.
4. Conclusions
n The reinforcement with two carbon iber layers provided an in -crease in inal experimental load of 55.1% and 89.5% for the strengthened beams of VA and VB groups, respectively. n For both VA and VB group of beams, it is observed that there
is a small increase in the ultimate experimental load from the strengthening with 3 iber layers.
n The reference beams from both groups presented a failure by bending while strengthened beams showed premature failure by tearing of concrete cover. Thus, the strengthening design carried out in accordance with the requirements of ACI 440.2R guide release 2002 [10] did not prevent the occurrence of pre
-mature failure mode.
n In both groups, the beam strengthened with 2 layers of iber (VA-2 and VB-2) obtained analytical loads very close to experi
-mental loads, as well as reference beam (VA-R and VB-R) ob
-tained their ultimate experimental loads higher than the ultimate analytical loads. For beams of VA group strengthened with 3, 4 and 5 layers of iber it was observed an average decrease of 5.5% for experimental loads when compared to analytical loads. However, for VB beams group strengthened with 3, 4 and 5 layers of iber, the average decrease was of around 17%. This diference between the ultimate analytical and ultimate ex
-perimental loads for the strengthened beams of VA group and mainly of VB group can be explained due to the inability of de
-sign method proposed by 2002 release of ACI 440.2R guide [10] to prevent the occurrence of the premature failure mode by pullout of concrete cover of tested beams.
n The CFRP strengthening directly contributed to the rigidity in -crease of reinforced beams, reducing the vertical displacement of the same for a given load.
n CFRP strengthening delayed the beam’s bottom longitudinal re -inforcement yielding. It was observed a tendency that the small
-er the strengthening cross section area, the low-er the yielding reinforcement load. It was also observed that, in general, the ultimate strain of bottom reinforcement of strengthened beams of both groups were higher than the ultimate strain of bottom reinforcement of their respective reference beams.
n The ultimate strains measured in VA and VB strengthening beams were very close, between 4.89 ‰ and 6.29 ‰, that are well be
-low of the carbon iber ultimate strain given by the manufacturer and of the design ultimate strains. This probably occurred due to beams premature failure by pullout of concrete cover.
n It was observed that concrete ultimate strains in the upper lange of reference beams were well above to concrete ultimate strains of concrete in same location of strengthened beams.
5. Acknowledgments
Authors thanks to CAPES-PROPAG for the inancial support re
-garding to the scholarship, to FUNCAP for the inancial support making this research possible and to Módulo Engenharia, for its work in this research.
6. References
[1] MACHADO, A. P. Strengthening of reinforced concrete struc
-tures with carbon ibers - characteristics, design and applica
-tion, São Paulo: Ed. PINI, 2002, 282 p. (in Portuguese). [2] DESKOVIC, N; TRIANTAFILLOU, TC; MEIER, U. Innovative
design of FRP combined with concrete - short-term behavior. Journal of Structural Engineering-ASCE. v.121, n.7, 1995; p.1069-1078.
[3] DONG, J.; WANG, Q.; GUAN, Z. Structural behavior of RC beams with external lexural and lexural-shear strength
-ening by FRP sheets. Composites: Part B, n.44, 2013; p.604-612.
[4] AHMED, E.; SOBUZ, H. R.; SUTAN, N. M. Flexural perfor
-mance of CFRP strengthened RC beams with diferent de
-grees of strengthening schemes. International Journal of the Physical Sciences, v.6, n.9, 2011; p.2229-2238.
[5] OBAIDAT, Y. T.; HEYDEN, S.; DAHLBLOM, O.; ABU-FAR
-SAKH, G.; ABDEL-JAWAD, Y. Retroitting of reinforced con
-crete beams using composite laminates. Construction and Building Materials, n.25, 2011; p.591-597.
[6] BEBER, A. J. Performance evaluation of reinforced concrete beams strengthened with carbon iber blades, Porto Alegre, 1999, Thesis (Dissertation) – School of Engineering, Federal University of Rio Grande do Sul, 95 p. (in Portuguese) [7] BEBER, A. J. Structural Behavior of reinforced concrete
beams reinforced with carbon iber composites, Porto Alegre, 2003, Thesis (Doctoral) – School of Engineering, Federal University of Rio Grande do Sul, 317 p. (in Portuguese) [8] FERRARI, V. J. Flexural strengthening of reinforced con
-crete beams with carbon ibers reinforced polymers (CFRP) joined to the transition substrate consisting of a high per
-formance cementitious composite, São Carlos, 2007, Thesis (Doctoral) – School of Engineering of São Carlos, University of São Paulo, 310 p. (in Portuguese)
[9] COSTA, N. C. S. Experimental analysis of reinforced con
-crete beams strengthened in lexure with carbon iber com
-posite - anchor optimization, Belém, 2011, Thesis (Disserta
-tion) – Faculty of Civil Engineering, Technological Institute, Federal University of Pará, 109 p. (in Portuguese)
[10] AMERICAN CONCRETE INSTITUTE. Guide for the Design and Construction of Externally Bonded FRP Systems for Strengthening Concrete Structures. ACI Committee 440.2R-02, USA, 2002.
[11] SPADEA, G.; BENCARDINO, F.; SWAMY, R. N. Optimizing the performance characteristics of beams strengthened with bonded CFRP laminates. Materials and Structures, n.33, 2000; p.119-126.
[12] ESFAHANI, M. R.; KIANOUSH, M. R.; TAJARI, A. R. Flex
-ural behavior of reinforced concrete beams strengthened by CFRP sheets. Engineering Structures, n.29, 2007; p.2428-2444.
[13] AL-TAMINI, A. K.; HAWILEH, R.; ABDALLA, J.; RASHEED, H. A.; F.ASCE. Efects of ratio of CFRP plate length to shear span and end anchorage on lexural behavior of SCC RC beams. Journal of Composites for Construction, n.15, 2011; p.908- 919.
-venting premature debonding of externally bonded FRP lam
-inates from concrete. Journal of Composites for Construc
-tion, n.17, 2013; p.641-650.
[15] AMERICAN CONCRETE INSTITUTE. Guide for the Design and Construction of Externally Bonded FRP Systems for Strengthening Concrete Structures. ACI Committee 440.2R-08, USA, 2008.
[16] INTERNATIONAL FEDERATION FOR STRUCTURAL CON
-CRETE. Externally Bonded FRP Reinforcement for Concrete Structures, FIB 2001 (Bulletin 14), Lausanne, 2001.
[17] OEHLERS, D.J., VISINTIN, P. HASKETT, M., SEBASTIAN, W.M. Flexural ductility fundamental mechanisms govern
-ing all RC members in particular FRP RC. Construction and Building Materials, v.49, 2013; p.985-997.
[18] YAU. J.; TENG. J. G. Plate end debonding in FRP-plated RC beams – I: Experiments. Engineering Structures, n.29, 2007; p.2457-2471.
[19] OEHLERS, D. J. Ductility of FRP plated lexural members. Cement & Concrete Composites, v. 28, 2006; p.898–905 [20] SMITH, S. T.; TENG, J. G. FRP-strengthened RC beams.
I: review of debonding strength models. Engineering Struc
-tures, n.24, 2002; p.385-395.
[21] TRIANTAFILLOU, T. C; PLEVRIS, N. Strengthening of RC beams with epoxy-bounded ibre-composite materials. Ma
-terials and Structures, v.25, 1992; p.201-211.
[22] SANTOS, A. R. S.; VIEIRA, M. M.; MONT’ALVERNE, A. M.; CABRAL, A. E. B.; BEZERRA, L. M.; MONTENEGRO, L. C. S. Determination of carbon iber optimal area used in lexur
-al strengthening of reinforced concrete beams. In: Brazilian Concrete Congress, 55º, Gramado, 2013, Anais (CD-ROM). (in Portuguese)
[23] MAPLE – User’s Manual release 12. Waterloo Maple Inc., Waterloo, Canada, 2008.
[24] GARDEN, H. N.; HOLLAWAY, L. C. An experimental of the inluence of plate end anchorage of carbon ibre composite plates used to strengthen reinforced concrete beams. Com
-posite Structures, v.42, 1998; p.175-188.
[25] GARCEZ, M. R. Behavior of reinforced concrete beams un
-der loading with carbon iber mats, Santa Maria, 2002, The

![Table 3 shows the comparisons between experimental ultimate loads (Pe) and the design analytical ultimate loads (Pa) obtained by computational analysis [22] developed in the commercial pack-age MAPLE [23], based on 2002 release ACI 440.2R guide](https://thumb-eu.123doks.com/thumbv2/123dok_br/18861368.417985/8.892.71.827.213.514/comparisons-experimental-ultimate-analytical-ultimate-computational-developed-commercial.webp)