Use of 3D laser scanning for latness and volumetric
analysis of mortar in facades
Uso do escaneamento 3D laser para análise de
planicidade e volumetria de argamassa em fachadas
a Universidade de São Paulo, Departamento de Engenharia Civil, Escola Politécnica da Universidade de São Paulo, São Paulo, SP, Brasil; b Votorantim Cimentos SA, São Paulo, SP, Brasil.
Received: 12 Jun 2015 • Accepted: 16 Oct 2015 • Available Online: 27 Jan 2016
Abstract
Resumo
The ongoing process of industrialization of construction sites encourages the use of new building systems that conlict with traditional techniques associated with the risks of incompatibilities and continuance of control ixed ideas with a signiicant variability. A practical example is the cement mortar for plastering, commonly used as a corrective factor for facade latness failures caused by the inaccuracy of the plumb line, rudimentary method used in geometric control of concrete structures and facade of mapping during the execution of the work, favoring the accumulation of errors that relect the mortar thickness, increasing consumption, losses and defects. Alternatively for improvement, this study analyzed through a case study, the innovative application of 3D laser scanning technology consolidated on the facade of a building to map the surface latness of the façade and, in an unprecedented manner, to quantify the volume of mortar. The results showed the feasibility of the technique as a solution
to accurately identify the critical areas of the facade on the peripheral concrete structure and masonry and calculate, based on the volumes, the
inancial impact associated with mortar overthicknesses in critical areas compared with the reductions thickness after treatment of these areas.
Keywords: 3D laser scanning; facade; mortar; volumetric.
O processo contínuo de industrialização dos canteiros de obra estimula o uso de novos sistemas construtivos que conlitam com técnicas tradi
-cionais associada aos riscos de incompatibilidades e permanência de controles executivos com signiicativa variabilidade. Um exemplo prático é
a argamassa cimentícia para reboco, comumente utilizada como fator corretivo de falhas na planicidade das fachadas causadas pela imprecisão
do io de prumo, método rudimentar usado no controle geométrico das estruturas de concreto e no mapeamento da fachada durante a execução da obra, favorecendo o acúmulo de erros que reletem nas espessuras de argamassa, potencializando consumo, perdas e defeitos. Como alter
-nativa para melhoria, este trabalho analisou através de um estudo de caso, a aplicação inovadora da tecnologia consolidada de escaneamento 3D laser na fachada de um edifício para mapear a planicidade supericial da fachada e, de forma inédita, para quantiicar o volume de argamassa. Os resultados mostraram a viabilidade da técnica como solução para identiicar com precisão as áreas críticas da fachada sobre a estrutura de concreto periférica e alvenaria e, a partir da volumetria, calcular o impacto inanceiro associado às sobrespessuras de argamassa nas áreas críticas comparada com as reduções de espessura após tratamento dessas áreas.
Palavras-chave: escaneamento 3D laser; fachada; argamassa; volumetria.
1. Introduction
Currently the conception of new real estate projects has signaled a deadline versus cost balance that makes it possible to reduce
the working time and investments return. It is a relationship that
implies the need to industrialize the worksites through a gradual
change from rudimentary to modern constructive techniques aim -ing at higher productivity, but with risks of incompatibilities and
continuance of control ixed ideas with a signiicant variability. The
elimination of such risks is a critical factor to prevent failures during
the execution of the works and impacts both on the system techni
-cal performance and the quality and durability of the constructions, relecting on the actual costs and the sustainability of the projects (BARROS [5]).
A practical example is the regularization of facades with mortar for plastering, a step that, after being inluenced by previous phases,
may result in an increased consumption of materials, time and
work-manship, when compared to what is initially foreseen in the project. The inluences on the regularization of facades begin in the geo -metric control of surfaces of pillars and facades by the plumb line that is made out of wires one end of which is attached to metal or wood rods placed on the cover of the building and the other end of which is attached to weights that are usually made of concrete test
specimens or paint cans illed with concrete to tension the wire and assure the alignment as illustrated in Figure 1-a (BARROS [5]). This rudimentary technique used to check the alignment and level
-ing of concrete molds of every loor and also between the loors is
also used as a reference for mapping the mortar thicknesses on the facade after the masonry is completed, the tolerance of which
for deviations (±15 mm) as per ISO 7976-1 standard is higher in
relation to the other instruments under the same standard to check
the verticality (BARROS [5]).
Despite the fact that the use of the method of the plumb line during the process of mapping the facade makes it possible to identify some critical points of irregularity of the substratum and an es-timate of the mortar volume, it is a manual and artisan method,
wherein its little extent in relation to the mapped area - approxi
-mately 30% of the number of external walls in each loor - and its inaccuracy result in the misalignment between the loors and con
-sequently a lack of square and plummet of the concrete structure and masonry (COSTA [8]; OLIVEIRA [16]).
In this case, a few points should be emphasized, such as: the
natu-ral diiculties to attain a perfect alignment of the concrete struc -tures (beams) on the peripheries, in view of the access to support the struts; the problem of accumulating errors in function of the transfer of levels and position of structural elements that is often
accomplished loor-by-loor but not from external references.
This condition favors the accumulation of errors and brings about changes in the average thicknesses of the mortar cover of the fa-cade, from 26% to 73%, and the thicknesses below the 2 cm - 3 cm
interval, indicated by NBR13749 (ABNT [3]) standard as permis
-sible for external coverings may turn into fragile points that might
cause failures, thus compromising the protective function of the covering, while the overthicknesses, besides representing losses of material that may range from 6% to 39% and risks of failures
deriving from issures in the coverings and additional loads in the structure (COSTA [8]), are considered in many studies as one of the greatest mortar waste factors (PICCHI [18]; PALIARI [17]; AGOPYAN [1]; SOIBELMAN [21]).
In addition to the cost of wasted material, the increased cost
as-sociated to the workmanship is quite representative, since, in the
case of mortar thicknesses higher than the recommended ones, special care should be taken to assure the adherence thereof, thus
increasing the amount of H.h/m² (BAIA [4]).
Therefore, once the plumb line is established as the method for aligning the structure and the mortar thickness reference method,
the exactness in the calculation of the mortar volume is reduced and the diiculty in correcting and acting efectively in the improve
-ment of the inal thickness of the mortar covering is increased.
In this sense, the emergence of 3D laser measuring methods
for a huge number of applications in the latest years (SU [22]) stimulated by speciic needs, has contributed to the availability of diferent types of 3D scanners in the market (GRYZAGORIDIS
A
B
C
[14]). In connection with the evolvement of technology, it has be
-come possible to carry out procedures in the ield in a relatively short time and, though the equipment costs (hardware and soft
-ware) still represent a restriction (SU [22]), they are not an obstacle to its applications in the worksite.
The development of an equipment able to scan large surfaces
such as facades, the provides reliable accurate measurements,
extended the possibility of applying this technology in the work
-site, thus making the technique increasingly recognized in the civil construction ield (ZHANG; ARDITI [24]) and used more often in the whole life cycle of a building. Usually known as information
models, they are used for many purposes, including the detection of errors made during the construction and maintenance control of
the building (XIONG [23]).
The 3D laser scanning is a reliable, practical and functional
tech-nique for comparing the consumption of materials foreseen in the project with the actually consumed material in the work (ZHANG [24]). Thus, the purpose of this study is to verify - by means of
the study of a case - the viability of using the 3D laser scanning
to map the latness of the facade and quantify the mortar volume as a necessary and eicient solution aiming at reducing the mor -tar consumption, without necessarily needing to subject same to
a higher geometric control of the structure and sealings (PALIARI [17]), since despite the fact that the geometric control is present in
all the building construction phases and represents an important
tool in the constructive rationalization (COSTA [8];BARROS [5]), it still has not been executed integrally and correctly in a great num
-ber of constructions in Brazil.
Since it is a relatively new technology to be used in the worksite (ZHANG [24]) and a study on this technique applied to mortar vol -ume has not been found to date, a brief review on the functioning
of 3D laser scanners 3D will be presented hereinbelow.
1.1. Basic principles of the 3D laser scanning
technology
The 3D laser scanning is a high precision detailed remote measure-ment and digitalization in three-dimensional surveys, providing a few errors in relation to traditional methods, translated into the
accom-plishment of special complexity technique projects in diferent areas such as engineering, architecture and infrastructures [25].
Its name derives from the use of the laser in linear measurements, and the use of horizontal and vertical scanning in angular mea-surements, and also the fact that it is stored as crude data,
es-sentially X, Y, and Z coordinates (3D), calculated in real time from linear and angular measurements [11].
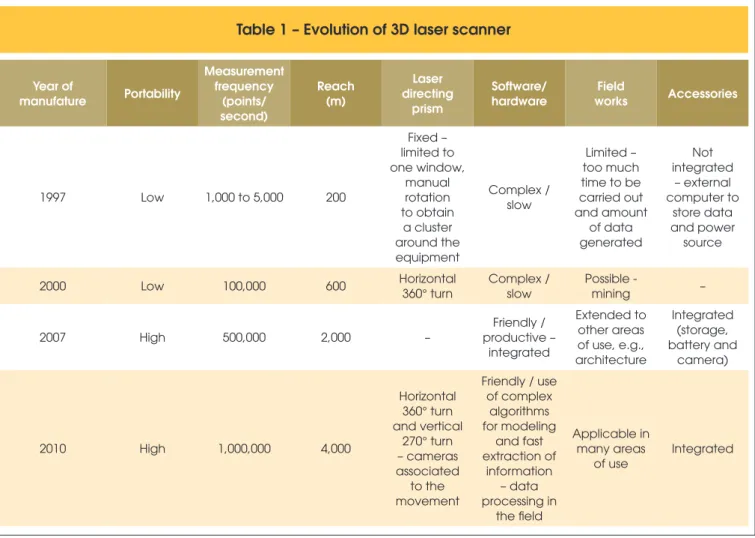
We may divide its evolution to date in four generations (table 1). There is a variety of technologies for the digital acquisition of the shape of a 3D object. The classiication is divided into two types: the ones that require a contact with the surface that is being
Table 1 – Evolution of 3D laser scanner
Year of manufature Portability Measurement frequency (points/ second) Reach (m) Laser directing prism Software/ hardware Field works Accessories
1997 Low 1,000 to 5,000 200
Fixed – limited to one window, manual rotation to obtain a cluster around the equipment Complex / slow Limited – too much time to be carried out and amount of data generated Not integrated – external computer to store data and power source
2000 Low 100,000 600 Horizontal
360° turn
Complex / slow
Possible -
mining –
2007 High 500,000 2,000 –
Friendly / productive –
integrated
Extended to other areas of use, e.g., architecture
Integrated (storage, battery and
camera)
2010 High 1,000,000 4,000
Horizontal 360° turn and vertical 270° turn – cameras associated to the movement
digitized, used for small objects, and those without any contact at all.
The solutions without any contact can be subdivided into two main
categories: active and passive. There is a variety of technologies that it into the extent of each of these categories, the active one being the category that is of interest to the study in question (CURLESS [9]).
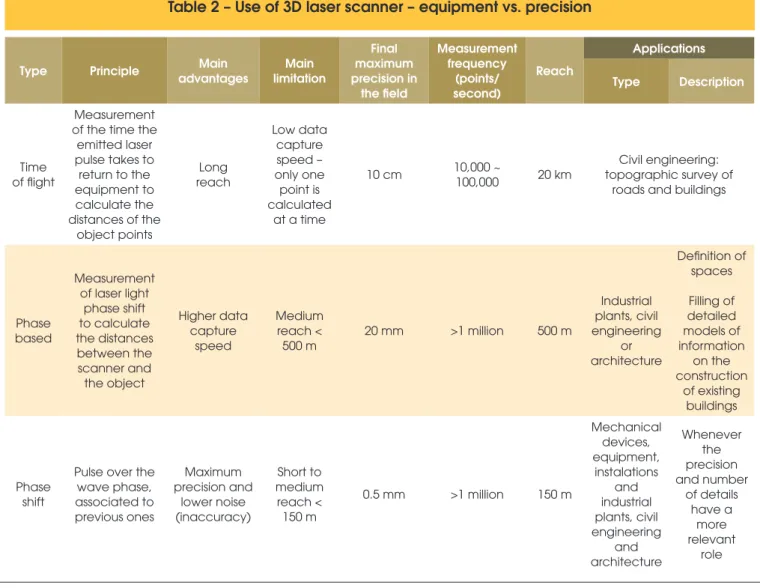
In the active technology, the physical process of the laser scanner takes place through the emission of a light source (laser) and detection of the
relection, generating precise three-dimensional representations of the surface of said object. The main scanners used in this type of technol
-ogy are of three types, as given in table 2 (ZHANG [24]).
The current scanners applied in civil engineering and architecture are those of spherical scanning comprising the vertical rotation of a mir-ror combined with the horizontal rotation of the scanner, so that the
scanner digitizes its whole ield of sight – point-to-point - moving the
direction of the telemeter, a precision device designed to measure distances in real time, however, the laser telemeter only detects the distance from a point in its direction of sight, thus reproducing the
dis-tance from the origin of the scanner to the object [25] in a reliable way.
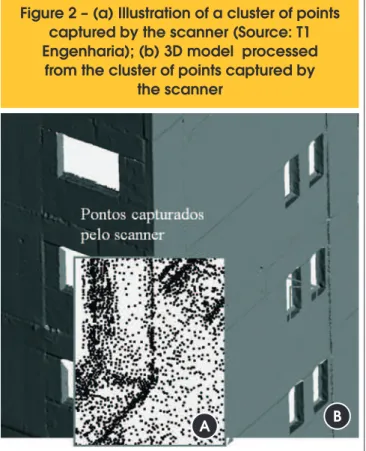
The result of a scanning is a “cloud of points”, a cluster of points (like
a data ile) in a three-dimensional system of coordinates (X, Y and Z), representing the external object surface (igure 2-a) that, after
having been captured by a 3D laser scanner, can be processed and
combined in precise 3D models (igure 2-b) composed of millions of points, usually using a suitable software (SU [22). The density of the points depends on the speed the laser sweeps the surface. A laser scanner may provide a fast good quality precise analysis, besides de
-tecting the characteristic of any object (ZHANG [24]). Measurements
of individual points may have a precision of a few centimeters or less than one millimeter depending on the detector, the interval and the
surface that is being digitized (XIONG [23]).
A unique laser scanning characteristic along the survey is the abil -ity to manipulate and visualize high resolution data, usually with-out being limited by environment restrictions during the operation
(Golparvar-fard [13]). More recently, mobile digitalization systems
have become available, reducing the work time thanks to some
precision of the registered cloud of points. When applied to the fa -cades of a building, the method begins with a cluster of clouds of points that, when moved to a common coordinates system - a process usually called alignment or registering system - from several points of the facade are merged to form a complete semantically rich 3D model containing the geometric information and the identity of the
facade (BERNARDINI [6]; XIONG [23]).
Table 2 – Use of 3D laser scanner – equipment vs. precision
Type Principle advantagesMain limitationMain
Final maximum precision in the field Measurement frequency (points/ second) Reach Applications Type Description Time of flight Measurement of the time the
emitted laser pulse takes to return to the equipment to calculate the distances of the
object points Long reach Low data capture speed – only one point is calculated
at a time
10 cm 10,000 ~
100,000 20 km
Civil engineering: topographic survey of
roads and buildings
Phase based
Measurement of laser light
phase shift to calculate the distances between the scanner and the object Higher data capture speed Medium reach < 500 m
20 mm >1 million 500 m
Industrial plants, civil engineering or architecture Definition of spaces Filling of detailed models of information on the construction of existing buildings Phase shift
Pulse over the wave phase, associated to previous ones Maximum precision and lower noise (inaccuracy) Short to medium reach < 150 m
0.5 mm >1 million 150 m
Despite the high precision of a laser scanner, a number of limitations and challenges in the implementation thereof in the worksite can
re-duce the beneits observed (Golparvar-fard [13]). Such limitations in -clude the fact that only the data on the objects that are inside the line of sight of the scanner can return, thus causing a discontinuity of the space information by obstacles/interferences that prevent the laser
from reading (JASELSKIS [15]), called a shaded zone in this work,
being able to create concealments in the target object and even
gen-erate mistaken interpretations of the model. Moreover, it is dependent on a number of factors, including the minimum and maximum dis
-tance between the object and the scanner, the relectivity of the target
surface, the measurement angle and time for a complete scanning
(AKBARZADEH [2]).
Despite the fact that most of the works assume that the concealments are minimum or that the concealed regions of a point of sight can be
observed from another point (FRUEH [12]) (PU; [19]), there are many
solutions proposed for the general problem of reconstruction of
con-cealed 3D surfaces, also known as “fulillment of holes” (DAVIS [10]; SALAMANCA [20]).
In studies directed to the problem of reconstruction of exteriors of build
-ings, using laser scanner data, for example (FRUEH [12]), in general
the emphasis has been on the creation of realistic visual models instead
of geometrically precise ones. By using algorithms, plain corrections are extracted from the data (cloud of points), but they do not explicitly recognize the identity of the concealed components (XIONG [23]).
2. Materials and experimental program
The viability of the use of the 3D laser scanning in the work
encom-passes diferent intervening factors that range from the selection of the scanner to the characteristics of the worksite and the project. In
order to reach the object of the work, the study of a case in a build-ing in construction was developed, wherein a series of analyses and interpretations have been carried out using the scanned model
of one of the facades.
2.1. Selection of the equipment
The time for a complete scanning was pointed out in some
previ-ous studies as a limitation of 3D scanning, thus the irst aspect to
make it possible to use this technology in the facade of buildings
was to identify an equipment able to quickly scan the surface in question and suiciently portable to be carried and assembled, fa
-voring its conveyance and use in the worksite.
Figure 2 – (a) Illustration of a cluster of points
captured by the scanner (Source: T1
Engenharia); (b) 3D model processed
from the cluster of points captured by
the scanner
A
B
The selected scanner was SURPHASER 25HSX (igure 3-a) that
uses the high precision phase-shift type laser hemispheric
scan-ning technology. The laser is scanned around the scene that is
being digitized in three dimensions, gathering distance
measure-ments at speciic angle intervals (igure 3-b). The equipment has a 0.1 mm to 0.2 mm precision, a maximum reading radius of 25 meters, a maximum angle of 85 degrees and a capture speed that
varies from 300,000 to 1,200,000 points per second, making it
Figure 4 – 360º scanning scheme. (Sour ce: T1 Engenharia Digital)
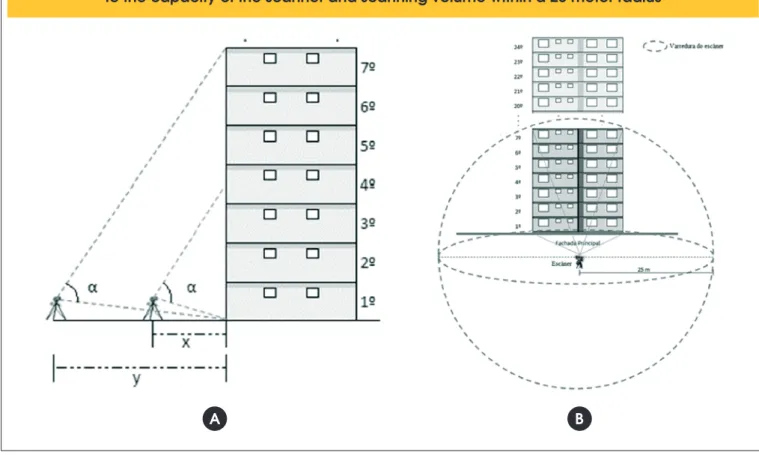
Figure 5 – (a) Schematic representation of the distance of the scanner in relation to the facade;
(b) Schematic representation of the scanning area of the facade in relation
to the capacity of the scanner and scanning volume within a 25 meter radius
possible to scan a facade in a few minutes. The noise level (inac
-curacy) below 0.2 mm associated to the density of points makes it possible to capture precise details of the scanned surface. In order to keep the stability, the equipment is connected to a tri -pod and the data collected during the scanning are stored in a
notebook connected to the equipment either by means of a USB cord or wireless.
As illustrated in igure 4, to produce a 3D model 3D, in this type of
scanner the blue head may turn 360º horizontally, while the cap-sule where the rotating mirror is located - in the central part of the head - emits the infrared laser as it turns 360º vertically to measure the distance of the object on its way, thus making it possible to
perform the hemispheric scanning and a 360º x 270º ield of sight.
2.2. Contour conditions
The viability of the use of the 3D laser scanning in the worksite also encompasses contour conditions related to the characteristics of
the worksite and the project. Thus, the second step was to identify and deal with these points.
Conditions for assembling and using the equipment in the work:
n Power outlets in the reading sites.
n A lat place of approximately 2 m² for assembling the equipment (installed on a tripod).
n A combination of distance (gap) versus reading angle between
the equipment and the facade:
n Restrictions for removing or approaching the equipment in rela
-tion to the building can generate reading angles above 85 de -grees that make it impossible to scan the whole facade with a
suicient quality of the model for analysis (Figure 5-a).
n In constructions above the threshold reading radius, the
scan-ning shall be performed by either a higher capacity equipment
or more than a shot, wherein the combined model is combined
with the aid of a software later on (Figure 5-b).
Conditions for accomplishing the reading:
n Absence of shaded areas, that is, areas/points that - after the
localization of the scanner and the reading angle are deined - generate obstacles (blind points) between the equipment and
the surface to be evaluated, thus concealing the scanner
read-ing. Shaded zones are as follows:
- Verandas and balconies outside the main plan of the facade
and decorative elements.
- Scafolds and facade screens, balance beams, walls or any
element/object located between the scanner and the reading
surface.
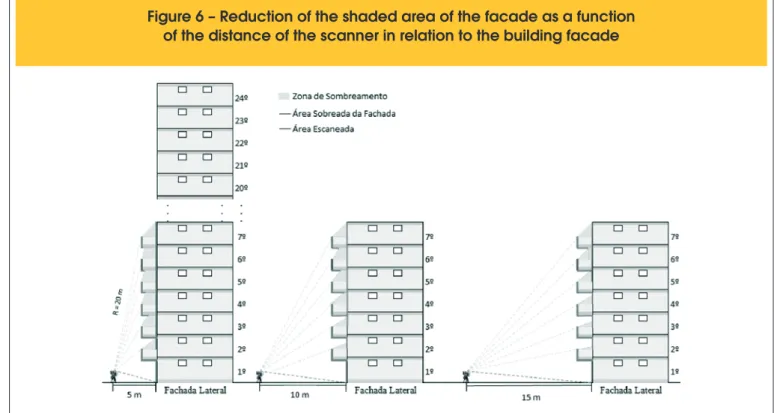
n The shaded areas can be reduced or eliminated:
n Depending on the distance and/or position of the scanner in
rela-tion to the facade (Figure 6). To make it possible to posirela-tion the scanner outside the shaded zones it is required to use devices such as, for example, lifting planks (Figure 7-a) or rods (Figure 7-b) extending from the facade. This procedure increases the complexity and the cost of the service, so it is recommended to make a viability analysis considering the new scenery.
n By reconstructing the surfaces with the use of speciic soft -ware, however, since the aim is to capture the imperfection of
the facade, the reconstruction surface techniques that use spe
-ciic software are not efective since they operate with visual models that are not geometrically precise and do not explicitly recognize the identity of the concealed components.
Compliance with the time schedule of the work:
n To assure the full scanning of the facade without causing any change in the routine of the worksite or interventions in
opera-tional stages, the required alignment shall be performed by the time the masonry step is inished, and if the scafolds/balance beams and facade screens that are required for performing the covering of the facade have not been installed yet.
2.3 Selection of the work
From the number of available works, the study was carried out on
the work that better fulilled the contour conditions and the require -ments established as necessary in the planning stage for a full
reading of the substratum surface.
Characteristics of the work:
n Work in a reinforced concrete structure whose alignments and levelings of the concreting molds were performed by the wire
technique.
n Sealed masonry in concrete blocks lined up and leveled by the same technique.
n Area of the facade without shaded zones (concealments). - Phase of the work: concrete and masonry sealed structure in
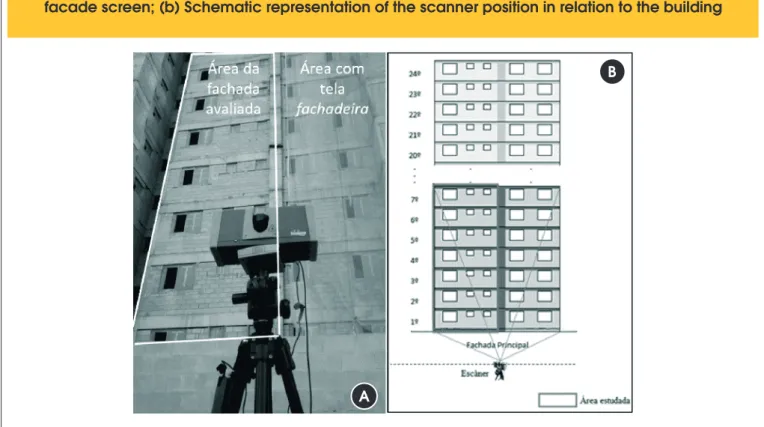
-ished, mortar blasting and regularization in mortar not initiated. The chosen work was a 24 loor building, however, the maxi -mum possible span between the scanner and the facade was
ap-proximately 10 m, and a portion of the facade was covered with a screen (Figure 8-a), only seven loors of a front facade have been scanned, that is, the analyzed area represented 14.3% of this fa
-cade as illustrated in Figure 8-b.
2.4 Use of the Geomagic software
In order to analyze the latness of the facade and quantify the mor -tar volume by using the Geomagic software after the scanning of the facade, the following steps have been carried out:
2.4.1 Flatness of the facade:
n Position the complete 3D model in relation to the original project; n Calculate the reference plane of the facade that passes through
the axis of the beams from the medium point of the surfaces
thereof;
n Generate the map of colors showing visually all the depressions and protuberances of the substratum in the software, from the medium plane;
n Visualize the areas with higher impact degrees on the latness
of the facade (structure and masonry) and identify the places
with the maximum and minimum mortar thicknesses;
n Calculate the planes by simulating diferent mortar thicknesses,
showing by means of a scale of colors the thickness changes by calculating the distance from each point of the planes to the surface of the scanned facade;
Figure 7 – (a) Use of lifting planks, and (b) rods extending to the facade
as a resource to reduce the shaded areas (Source: T1 Engenharia Digital)
A
n Compare the highest thickness and average thickness of the mortar in each plane with the 25 mm thickness (average of the thickness between the 20 mm to 30 mm interval for
mor-tar in the facade as per NBR13749 (ABNT [3]) standard;
n Identify the planes with maximum and minimum area percent
with a minimum thickness of 25 mm and spots where these
areas are concentrated.
2.4.2 Mortar volume measurement
n Position the whole 3D model in relation to the original project; n Calculate the reference plane of the facade that passes
through the outmost point of the facade, showing the distri-bution of thicknesses in the regions of the facade behind the plane by means of a scale of colors;
n Generate the map of colors showing the total area percent-age with a minimum thickness of 25 mm;
n Calculate the planes by simulating diferent mortar thick -nesses up to at most 25 mm on the outmost point of the facade (100% of the facade with a minimum thickness of 25 mm), and show the thickness changes in a scale of colors by calculating the distance from each point of the planes to the surface of the scanned facade;
n Compare the mortar consumption in each plane versus the total area percentage with a minimum thickness of 25 mm; n Identify the savings in the mortar consumption from the
vol-ume percent reduction in comparison with the plan where 100% of the facade, irrespective of the irregularities, with a
minimum thickness of 25 mm;
n Analyze the economic viability of the use of the 3D scanning
technique in this study of a case.
2.5 Experiment performed and deinition
of reference planes
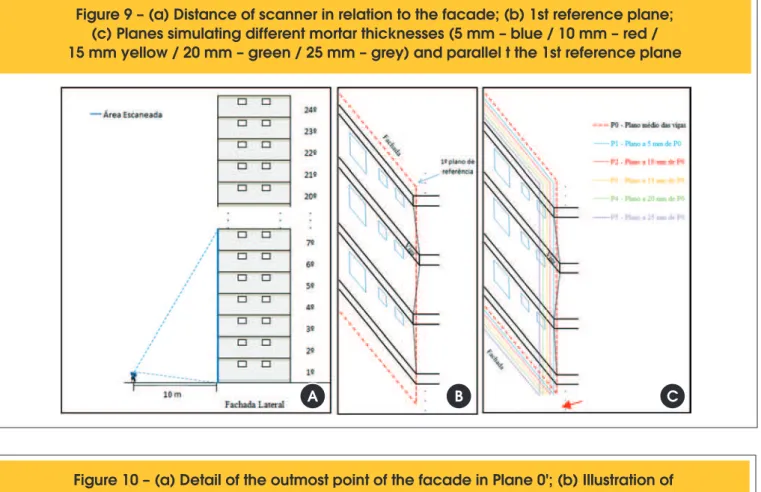
In order to accomplish the scanning, the scanner was
posi-tioned facing the facade (Figure 9a). From the scanned model
and using resources of the Geomagic software that has been
developed by the manufacturer of the equipment, two reference
planes used as the base for the studies of mortar consumption
were created.
As illustrated in Figure 9-b, the irst reference plane P0 passes through the axis of the seven beams and passes through the medium point of the surfaces thereof. Five new parallel planes
named as P1, P2, P3, P4, P5, at a distance of 5, 10, 15, 20 and 25 mm, respectively, from P0 (Figure 9-c), were traced,
simulat-ing diferent mortar thicknesses.
While the irst plane of reference was traced from the beams
of the facade, the second reference plane was traced from the
outmost point of the facade as illustrated in Figure 10-a. Three
new planes spaced apart 5, 15 and 25 mm, respectively, (Figure 10-b) were created for the purpose of simulating a mortar cov-ering to comply with a thickness of 25 mm (medium thickness
between the 2 to 3 cm interval as per NBR 13749 (ABNT [3])
standard over 100% of the area of the facade with coverings
that did not comply with this premise (5 mm and 15 mm).
Figure 8 – (a) Image of the work showing a detail of the evaluated facade and the
facade screen; (b) Schematic representation of the scanner position in relation to the building
A
Figure 9 – (a) Distance of scanner in relation to the facade; (b) 1st reference plane;
(c) Planes simulating different mortar thicknesses (5 mm – blue / 10 mm – red /
15 mm yellow / 20 mm – green / 25 mm – grey) and parallel t the 1st reference plane
A
B
C
!
3. Results and discussions
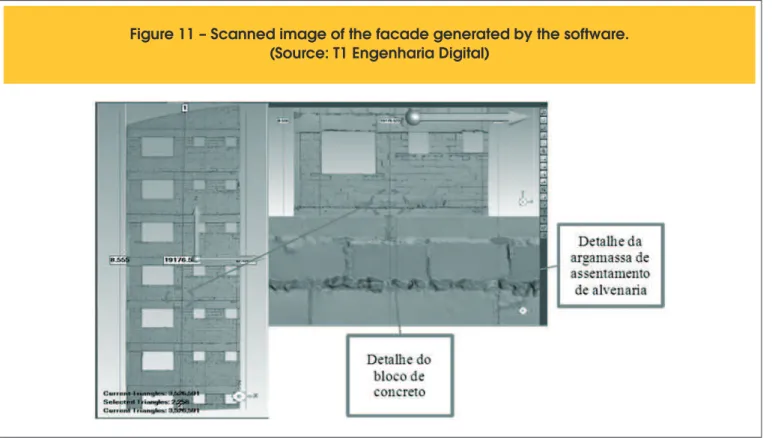
From the scanned model (Figure 11) of the facade under study, a series of analyses and interpretations have been made, by considering the following items:
n Execution quality of the substratum, measured through the
detailing of the flatness generated by the 3D image; n The influence of the structure leveling degree on the
flat-ness of the masonry and the mortar thickflat-ness;
n The impacts of the outmost critical areas of the facade (generated due to the lack of geometric control of the structures) on the mortar consumption based on the
mor-tar thickness required to regularize the substratum and as -sure the performance of the covering system;
n Financial profits versus economic viability of the technique
in view of the reduction of the mortar consumption by the volumetric analysis;
n Advantages of the technique and possibilities of the use thereof in other worksite applications.
3.1 Flatness of the facade
The 3D laser scanning provides a thorough sight of the plane and, by means of the generated model (Figure 11), it is pos-sible to observe details of the elements that constitute the
surface such as, for example, the positioning of each con -crete block in relation to others and in relation to the struc-ture (beams), besides the conditions of application of the
masonry mortar.
3.2 Facade alignment and leveling reinement
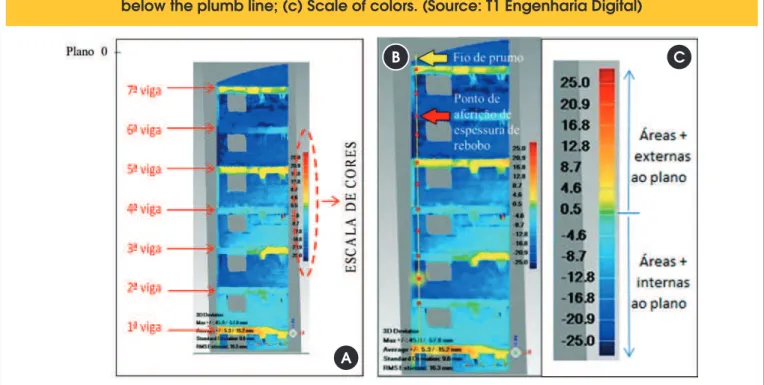
The image of the irst reference plane (igure 12-a) evidences the efect of the lack of geometric control of the structures on the fa
-cade latness, making it possible to identify the actual critical ir -regularity points over 100% of the scanned area, and not only the
points under the plumb line (igure 12-b).
By using a scale of colors (Figure 12-c), the software shows the re-gions of the facade in front of and behind the plane, represented by
hot and cold colors, respectively. The critical areas in front of the plane are usually located in the structure and its irregularities inluence the leveling and latness of the masonry, generally positioned behind the plane, and both of them determine the inal mortar thickness.
These assertions can be evidenced in Figure 12-b through the in-terpretation of the scale of colors wherein the green colored areas are the ones closest to the reference plane:
n Beams 1, 5 and 7, predominantly yellow and/or orange colored, are the most distant from the plane;
n Beam 1, dark orange colored in a large portion of its area, is located in the outmost point of the facade;
n Beams 2 and 4, light blue colored, are located closer to the plane. The slight bulge in the center (green colored area) probably was
caused by deformation of the mold during the concreting.
n Beam 3 exhibits the right side area out of the plane (yellow) and
the left side area inside the plane (blue), that is, it is located across the plane;
n In a lesser degree, beam 6 also is located across the plane, but
completely inside same with diferent shades of blue;
n The innermost regions are located on the masonry between the 5th and 7th beams, whose area is represented by a dark blue
shade.
n A scaling of beams positioned inside and outside is observed.
Outmost odd beams and innermost even beams;
n The extreme points (innermost and outmost) are located 57.8 mm behind the reference plane and 45.0 mm ahead same, that
is, a variation of 102.8 mm between the outmost point and the innermost point of the substratum.
The other plane traced that simulates diferent mortar thicknesses
(Figure 13) made it possible to measure the distance from each
Figure 12 – (a) Image of the first reference plane generated by the software and identification
of beams; (b) Critical irregularity points over 100% of the area of the scanned facade vs. points
below the plumb line; (c) Scale of colors. (Source: T1 Engenharia Digital)
A
B
C
point of the planes to the surface of the scanned facade. By using
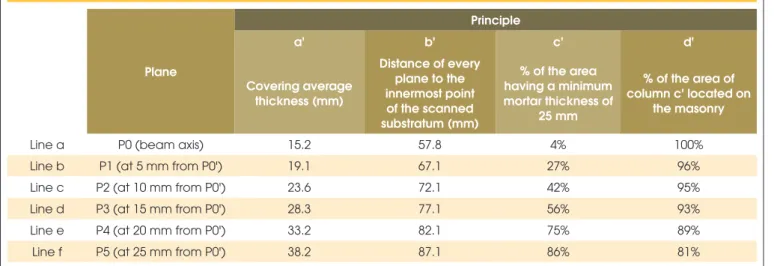
the software, the information shown in Table 3 was generated, and the analyses of such data show that:
n Assuming the volume between the scanned surface of the
facade (substratum) and the planes would be illed with regu -larization mortar, the average thicknesses calculated in P3, P4 and P5 (column a’ - Table 3) were above the 25 mm thick-ness, interspersed between the 20 mm to 30 mm interval
for the mortar in the facade as per NBR 13749 (ABNT [3]) standard.
n The distance from each plane to the innermost point of the fa-cade surface (column b’ - Table 3) shows that the thickness of mortar at P0, P1, P2, P3, P4 and P5 in those spots would be
approximately 2.3; 2.5; 2.7; 2.9; 3.1; and 3.3 times, respectively,
the average mortar thickness (25 mm) for the facade consid-ered in the study, representing a large waste of material and
workmanship, besides the risks of failures.
n In a comparison between columns c’ and d’ of Table 3, it is seen that the planes with a higher area percent having a minimum thickness of 25 mm present such areas concentrated on the
masonry. This proves that the masonry is generally displaced from the beams inwards to the plane and was directly inlu
-enced by the lack of alignment and leveling of beams.
n In the planes of Figure 13, assuming the areas dark blue col-ored represent the spots where every plane is at a distance of
25 mm from the scanned substratum, then, approximately 75% and 86%, respectively, of the areas of planes P4 and P5, are covered with at least 25 mm of mortar.
Table 3 – Brief results of planes traced from the 1
streference plane in relation to the scanned image
Plane
Principle
a' b' c' d'
Covering average thickness (mm)
Distance of every plane to the innermost point of the scanned substratum (mm)
% of the area having a minimum mortar thickness of
25 mm
% of the area of column c' located on
the masonry
Line a P0 (beam axis) 15.2 57.8 4% 100%
Line b P1 (at 5 mm from P0') 19.1 67.1 27% 96%
Line c P2 (at 10 mm from P0') 23.6 72.1 42% 95%
Line d P3 (at 15 mm from P0') 28.3 77.1 56% 93%
Line e P4 (at 20 mm from P0') 33.2 82.1 75% 89%
Line f P5 (at 25 mm from P0') 38.2 87.1 86% 81%
nd
3.3 Beneits in volume measurement
In the 3D laser scanning technology, the consumption is calculated by measuring the volume from a 100% coverage of the facade
area. The calculation of diferent volumes of mortar represents the
sum of the thicknesses between the scanned model of the facade (Figure 11), considering all the surface irregularities and each of
the diferent planes under study.
Beginning with the second reference plane (P0’) traced parallel to the facade and facing the outmost point of the scanned surface,
as illustrated in igure 14, it was observed that, in order to attain
the ideal condition wherein the whole facade has a 25 mm mortar thickness (Figure 14-e), there was an increase representative of the mortar consumption, increasing the cost, environment impact
and a future risk of imperfections and failures in the covering.
On the other hand, the images of Figure 14 show that either plane P1’, located 5 mm from P0’, or plane P2’ located 15 mm
therefrom, show a area representative of the cover exhibiting the recommended 25 mm thickness and an expressive mortar con
-sumption reduction (Table 4). Thus, by dealing with the points that do not exhibit the 25 mm thickness in order to assure its per
-formance, it is possible to attain gains representative of quality, durability and savings.
The results given in Table 4 show that:
n Reference plane P0’ consumes a mortar volume of 2.59 m³,
however, only 39% of the complete scanned area have a mini-mum thickness of 25 mm;
n Plane P3’ located 25 mm from P0’, that is, a situation wherein 100% of the facade would present a minimum mortar covering of
25 mm, increased the consumption in 87%, totalizing 4.85 m³;
n On the other hand, plane P2’ located 15 mm from the reference
showed a 53% increase in the consumption, a total of 3.95 m³ of mortar and 82% of the area having thicknesses from 25 mm on;
n In plane P1’, located 5 mm from P0’, there is an increase of only
18% in the consumption, representing a 53% covering of the
facade with a minimum thicknesses of 25 mm;
n In planes P1’ and P2’, 57% and 100% of the area with a mini-mum thickness of 25 mm, respectively, are on the concrete structure (column d’), so it is possible to think about a solution wherein this substratum may function with lower thicknesses
without compromising the performance and durability.
3.4 Economic potential of the technique
Although Boehler [7] has classiied the laser scanning as a tech
-nique of prohibitive cost at the time he studied same, the return
on the investment in comparison with the conventional methods
of survey had already been noticed. Thus, a point of paramount
importance that was brought about during the study was the
eco-nomic viability of the use of the technique in view of the actual
Table 4 – Results obtained from the 2
ndreference plane
Plane
Column
a' b' c' d'
Mortar consumption (m3)
Consumption increase percentage in
relation to P0'
% of the area having a minimum mortar thickness of
25 mm
% of the area of column c' located
on the concrete structure
Line a P0 (outmost point) 2.59 – 39% 46%
Line b P1 (at 5 mm from P0') 3.05 18% 53% 57%
Line c P2 (at 15 mm from P0') 3.95 53% 82% 100%
Line d P3 (at 25 mm from P0') 4.85 87% 100% 0%
Table 5 – Mortar volume vs. cost in different planes under study
Plane under
study Thickness (mm)
Mortar consumption (metric ton)
Cost* (R$)
Volume reduction in relation to P3’
(%)
Cost reduction in relation to P3’
(R$) In scanned area
(7 floors) In the facade
P0' 0 4.4 15.1 R$12,582.96 -47% -R$11,222.64
P1' 5 5.3 18.1 R$15,060.69 -37% -R$8,744.91
P2' 15 6.8 23.3 R$19,433.14 -18% -R$4,372.46
P3' 25 8.3 28.6 R$23,805.60 0%
inancial proits generated. For that purpose, the savings gener -ated by the reduction of mortar thickness in planes P0’, P1’ and P2’ in relation to plane P3’ were calculated and compared with the cost
for accomplishing the scanning.
The analysis took into account the mortar consumption calculated
by the software in each of the plans and the R$1,417.00/m³ cost
of the regularization mortar of the facade applied, the average
value in force in the city of São Paulo in the irst semester of 2013 (Source: Sinduscon - SP). This cost encompasses the material, workmanship and equipment, and the values found based on the area of the seven scanned loors of one of the facades were sur
-passed for the 24 loors of this same facade.
Thus, as per the results of Table 4 and Table 5, it can be noticed: n Plane P0’ - 39% of the area with a minimum thickness of 25
mm (Table 4 - column c’) and a 47% reduction in relation to P3’ in mortar consumption (Table 5), resulting in a savings of
R$11,222.64;
n Plane P1’ - 53% of the area with a minimum thickness of 25 mm (Table 4 - column c’) and a 37% reduction in relation to P3’ in mortar consumption (Table 5), resulting in a savings of
R$8,744.91;
n Plane P2’ - 82% of the area with a minimum thickness of 25 mm (Table 4 - column c’) and a 19% reduction in relation to P3’ in mortar consumption (Table 5), resulting in a savings of
R$ 4,372.46.
Taking into account an estimated value of R$5,000.00 (ive thou -sand Reais) for accomplishing the scanning in a facade plus the analysis of the data, the use of the technology paid itself and gen-erated a surplus in planes P0’ and P1’, however, only 39% and
53% of the area had a minimum thickness of 25 mm. On the other hand, plane P2’, despite the deicit of R$627.54 to cover the cost of the scanning service, an area percentage of 82% with a minimum thickness of 25 mm was attained.
3.5 Other applications
During the use of the equipment in the worksite and after the analy
-ses have been intensiied, other applications related to the facade have been identiied. They are as follows:
n Use of a high degree of detailing of the surface generated by
the scanned model, to verify the block alignment regularity, the masonry positioning in relation to beams and pillars, the mortar thickness to settle the masonry, thus making it possible to use
the technique as a method for controlling the quality of the pro -duction/operational process of the masonry stage;
n Use during the construction of the structure to survey and cor -rect the failures in the alignment and leveling of molds, making
it possible to correct the failures before the concreting.
These two cited applications are considered to be preventive
mea-sures, thus preventing failures to take place and relect on the fol
-lowing stages, contrary to the corrective use proposed in this work.
4. Conclusions
n In the work object of this study, the purpose of the work was reached as the 3D laser scanning showed to be precise and economically viable, for the volumetric survey of the mortar consumption of the facade by applying the proposed method,
signaling a reduction in the applied mortar cost that ranged from
18% to 47% by identifying the overthicknesses generated by the imperfections in the facade latness.
n Also it showed to be an eicient tool for mapping the facade, displaying the inluence of the degree of geometric control of
the structure in the surface regularity of the facade, being able to contribute to the decisions taken referring to the corrective measures of the imperfections that impact the mortar
thickness-es all over the extent of the critical areas.
n For the analysis of the data, small critical areas represented by inner points, a great part of which is located on the masonry,
and outer points mainly located on the structure, inluence the inal thickness of mortar by reaching 3.3 times the 25 mm refer -ence thickness in the work under study, representing a large waste of material and workmanship, besides increasing the
risks of failures.
n The level of detailing of the images, reach and portability of the
currently available equipment and the degree of development of the software make the 3D laser scanning technique far bet -ter than the plumb line for mapping the facade, however, its
use depends on the fulillment of contour conditions intrinsic to the worksite.
n The most critical points are the shaded areas that generate
interventions, making it diicult or impossible to capture the
facade failures in such places, for the precise calculation of the mortar volume and the need of alterations or interventions in the routine/steps of the work so that the scanning can be accomplished as well as the delay in the installation of scaf-folds and removal of facade screens that act as obstacles to
the scanner reading.
5. Acknowledgments
The author is grateful to Cimentos Votorantim for sponsoring this
research, the company T1 Engenharia Digital for the accomplish -ment of the 3D laser scanning of the building under study and availability of the data used in the analyses, and to colleagues
Vanderley Moacyr John and Robert Cesar de Oliveira Romano for the support in the revision of this work.
6. Bibliography
[1] AGOPYAN, V.et al. Alternativas para redução do desperdício em canteiros de obra. São Paulo: Universidade de São Paulo, 1998. [2] AKBARZADEH et al. Proc: Third International Symposium on 3D
Data Processing, Visualization and Transmission, 3DPVT, 2006. [3] ASSOCIAÇÃO BRASILEIRA DE NORMAS TÉCNICAS. NBR
13749: revestimentos de paredes e tetos de argamassas
in-orgânicas – especiicação. Rio de Janeiro, 1996.
[4] BAÍA, L.L.M.; SABBATINI, F.H. Projeto e execução de revesti
-mento de argamassa. CTE, São Paulo: O Nome da Rosa, 2000.P. 82.
[5] BARROS, E. O. Controle geométrico da estrutura de concreto de edifícios como ferramenta da racionalização construtiva. Tese de Doutorado. Dissertação (mestrado)-Escola Politécnica–USP. São Paulo, 136 p. 2001.
[6] BERNARDINI, F.; RUSHMEIER, H. The 3D Model Acquisition Pipeline. Computer Graphics Forum, v. 21, n. 2, p. 149-172, jun. 2002.
International Archives of Photogrammetry, Remote Sensing and Spatial Information Sciences, v. 34, n. Part 5, p. 696-701, 2003. [8] COSTA, Fernanda Nepomuceno. Processo de produção de
revestimento de fachada de argamassa: problemas e
oportuni-dades de melhoria. 2005.
[9] CURLESS, Brian. From range scans to 3D models. ACM SIG
-GRAPH Computer Graphics, v. 33, n. 4, p. 38-41, 1999. [10] DAVIS, J. et al. Filling holes in complex surfaces using volumet
-ric difusion. In: 3D Data Processing Visualization and Trans
-mission, 2002. Proceedings. First International Symposium on. IEEE. P. 428-441, 2002.
[11] Evolução histórica dos levantamentos a laser | MundoGEO. Dis
-ponível em: <http://mundogeo.com/blog/2013/06/05/evolucao-historica-dos-levantamentos-a-laser/>. Acesso em: 12 abr. 2015. [12] FRUEH C. et al. Data processing algorithms for generating tex
-tured 3D building facade meshes from laser scans and camera
images. International Journal of Computer Vision (IJCV) 61 (2). P 159-184, 2005.
[13] GOLPARVAR-FARD, M. et al Evaluation of image-based model -ing and laser scann-ing accuracy for emerg-ing automated
perfor-mance monitoring techniques. Automation in Construction, v. 20, n. 8.P 1143-1155, dez. 2011.
[14] GRYZAGORIDIS, J. Laser Based Nondestructive Inspection Techniques. Journal of Nondestructive Evaluation, v. 31, n. 4.P 295-302, dez. 2012.
[15] JASELSKIS, E. J.; GAO, Z. Pilot Study on Laser Scanning Tech
-nology for Transportation Projects. Proceedings of the 2003 Mid-Continent Transportation Research Symposium, Ames, Iowa, August 2003.
[16] OLIVEIRA, M.et al. Sistema de indicadores de qualidade e produtividade para a construção civil: manual de utilização. 2. ed. rev. Porto Alegre: Serviço de Apoio as Micro e Pequenas Em
-presas do Rio Grande do Sul - SEBRAE/RS, 1995.
[17] PALLIARI, J.C. et al. Levantamento de perdas/consumo de ar -gamassa de revestimento em obras de construção em edifícios
brasileiros. In: III Simpósio Brasileiro de Tecnologia de Argamas
-sas, Vitória, 1999. Anais, p. 715-724.
[18] PICCHI, F. A. Sistemas da Qualidade: uso em empresas de con
-strução de edifícios. Tese (Doutorado em Engenharia), Escola Politécnica da Universidade de São Paulo, Programa de Pós-Graduação em Engenharia, São Paulo.1993. 280 p.
[19] PU, S.; VOSSELMAN, G. Knowledge based reconstruction of building models from terrestrial laser scanning data. ISPRS Jour
-nal of Photogrammetry and Remote Sensing, v. 64, n. 6, p. 575-584, nov. 2009.
[20] SALAMANCA, S. et al. Filling holes in 3D meshesusing image restoration algorithms, Proceedings of the Symposium on 3D Data Processing, Visualization, and Transmission. (Atlanta, GA), 2008.
[21] SOIBELMAN, L. As perdas de materiais na construção de edii
-cações: Sua incidência e controle. Porto Alegre, 1993.
[22] SU, Y. Y.et al.. Integration of Construction As-Built Data Via La
-ser Scanning with Geotechnical Monitoring of Urban Excavation. Journal of Construction Engineering and Management, v. 132, n. 12, p. 1234-1241, dez. 2006.
[23] XIONG, X. et al. Automatic creation of semantically rich 3D build
-ing models from laser scanner data. Automation in Construction, v. 31, p. 325-337, maio 2013.
[24] ZHANG, C.; ARDITI, D. Automated progress control using laser scanning technology. Automation in Construction, v. 36, p. 108-116, dez. 2013.