Analytical model for assessing of strengthening the
lexural beams with T and rectangular section
Modelo analítico para avaliação do reforço à lexão de
vigas com seção retangular e T
a Petróleo Brasileiro S.A. - PETROBRAS, Santos,SP, Brasil; b Universidade Santa Cecília - UNISANTA, Santos, SP, Brasil.
Received: 04 Aug 2015 • Accepted: 01 Dec 2015 • Available Online: 27Jan 2016
Abstract
Resumo
This study presents an analytical model for evaluation of the reinforced beams under simple bending based on recommendations of the Brazilian
Concrete Code (NBR-6118) and a study published by the International Federation of Concrete (ib). In this paper are considered two diferent
section types, rectangular and “T” sections and the beam´s deformation are analyzed considering the moment-curvature diagram taking into
consideration the limits of deformation of materials. The results obtained by both Codes are confronted each other, showing great similarity. Ad
-ditionally, destructive tests of reinforced beams have been made in the laboratory and were compared to results obtained by the analytical model, showing excellent performance of the proposed model. The objective of this publication is to present the analytical model. Analysis comparing the ield results and the analytical model were presented in another publication mentioned in this study.
Keywords: CFRP, analytical model, reinforced beams, ib, NBR-6118.
Este estudo apresenta um modelo analítico para avaliação do reforço de vigas sobre lexão simples com base nas recomendações da Norma Brasileira de Concreto (NBR-6118) e de um estudo publicado pela Federação Internacional do Concreto (Federation International of Betton-ib). São consideradas no estudo seções do tipo retangular e T e as deformações das vigas são analisadas considerando o diagrama momento - cur
-vatura respeitando os limites de deformação dos materiais no estado limite último. Os resultados obtidos por ambas as normas são confrontados entre si, mostrando grande similaridade. Além disso, ensaios destrutivos de vigas reforçadas realizados em laboratório foram confrontados com os obtidos pelo modelo analítico, mostrando excelente desempenho do modelo proposto. O foco dessa publicação está na apresentação do modelo analítico. As análises confrontando os resultados de campo com o modelo analítico foram apresentadas em outra publicação citada nesse estudo.
Palavras-chave: PRFC, modelo analítico, vigas reforçadas, ib, NBR-6118.
1. Introduction
The evaluation of the conservation state and the reparation or the
reinforcement of the existing buildings has been recognized as important to economic grown, showing the interest on preserve and rehabilitate the built patrimony. The technological innovation and the development of new materials have dominate this area showing an innumerous challenges and possibilities. Civil struc
-tures along the time sufer damages that implies, normally, in a re -duction on it’s structural capacity and the structural reinforcement might appear as a technical and economical solution (Spagnolo,
et al. [1]). A typical example of the reduction in carry capacity of structures happen due to reinforcement oxidation. (Saadatmanesh and Ehsani, [2]; An, et al. [3]). In fact, the reinforcement might con
-tribute to the corrosion. Recently, studies on strengthening tech
-niques, such as, carbon iber addition to the concrete matrix have
shown that could increase structure porosity as well as reinforce
-ment corrosion (Garcés, et al. [4]).
In some circumstances, the structures are submitted to diferent loads on the project phase, whether by operational errors or proj
-ect mistakes, as well as by changes in the structure conception regard to the necessity of the modiication of usage. In addition a speciic project analysis may result in the necessity of reinforce
structures in order to become safer and trustable to use (Beber, et
al., [5] and Beber, [6]). Must be evaluated the tendency of failure and the limit strain to reinforce the structure. Particularly in case of beam structures, is known that many geometric and physic parameters have inluenced in its behavior, consequently, in the
strengthening performance, such as: strengthened thickness “sec-tion”, resistance, types of strengthening, application techniques
and others revealed by (An, et al. [3]; Garcez, et al. [7]; Ferrai and Hanai [8]). Innovations in this area have allowed the improvement of application techniques (Tian, et al. [9] and Santos, et al. [10]). However, combination among strengthening types and new mate
-rials have allowed new applications in reinforced concrete, such as: strengthening in punching slabs (Santos, et al. [10]), reinforce
-ment in terms of shear stress (Gamino, et al. [11]), prestressed strengthening (Garcez, et al. [12]) and the reinforcement by adding carbon ibers in concrete (Garcés, et al. [4]).
In the application of new techniques and new materials to struc -tural reinforcement is also important to consider the reinforcement structure behavior as long as increase in loads occur, in order to
evaluate structural performance. To reinforced concrete or longi -tudinal and transversal steel bars in beams, the stress-strain
dia-grams are acknowledged as well as limits deformation. For these
structure types there are standards for project implementation.
Depending on reinforcement rate, the structure might present a behavior that is not recommended in terms of economical and
safety reasons for a project (Beber and Campos, [13]). In terms of reinforcement, there are few code recommendations, mainly when considered reinforcement with technologies such as carbon iber
reinforced polymers (CFRP) and recent application techniques as
shown by (Santos, et al. [10] and Yaqub and Bailey [14]).
To project a reinforcement system implies on the adoption of suit
-able theoretical models, which allow simulating precisely the be
-havior of the reinforcement elements (Swamy, et al. [15]; Bono, et al. [16]; Gamino, et al. [17]). Experimentally, was veriied that reinforced concrete beams behavior, strengthened with compos
-ites of carbon iber, presents features whose observance has vital importance for the appropriate strengthening function (Beber [6]; Andreolli, et al. [18]; Spagnolo, et al. [1]). To simulate and compre -hend this behavior, the applied methodology consisted to build
mo-ment-curvature diagram, generated by the data that were obtained
through a numerical model, a similar methodology is observed in
(El-Refaie, et al. [19]; An, et al. [3]; Al-Saidy, et al. [20]), however the full model is not represented in these publications. The model proposed in this work takes in consideration reinforced concrete beams with rectangular and “T” cross-sections, which are submit
-ted to simple bending. The diagrams allows analyzing the beams’ behavior as a monolithic structure as new increments of loads are added and allowing evaluating the structure stifness with or with
-out strengthening. A parametric study, for example, changing the reinforcement rate might show the gain rate of stifness with a rein
-forcement increase. Thereby can be conclude which way is more eicient to reinforce and predict beams’ behavior. These diagrams
are composed in tools to assess the materials performance that composes these type of beams, predicting the possible rupture
type of these materials before the sudden rupture, (El-Refaie, et al. [19]; Hollaway and Leeming [21]; Al-Saidy, et al. [20]; Agbossou, et al. [22]).
The moment-curvature diagram analysis was also made by (An
-dreolli et al. [18]) showing great accuracy between theoretical and experimental data, where also were confronted the recommenda
-tions from (NBR-6118, [23]) and ib, [24]). The actual study shows the mathematical model proposed by Andreolli, et al. [18] and de -veloped in order to analyze the behavior of the reinforced concrete beams with carbon ibers or steel plates, through the recommen
-dations of ib [24] and NBR-6118 [23]. It is presented the group of
equations in analytical model to determine the position of the neutral
line as a function of speciic material strain that composes the sec -tion submitted to a bending moment, fundamental variable in order
to acquire the moment - curvature diagrams. Besides, are presented correlated equations that composes the numerical model.
2. Methodology
To assess the reinforcement behavior, a mathematical model
was developed taking into consideration the concrete
stress-strain diagram of concrete (sc x e(y)) from the NBR-6118 and
ib codes, which are applied to any concrete class strain do
-main until C50. The model was developed for rectangular and “T” cross section beams. The model was based on the following hypothesis: (i) until the rupture the sections remain lat (Ber
-noulli hypothesis), (ii) The speciic maximum shortening of the concrete is 0,0035, (iii) The speciic maximum stretching for ten
-sile reinforcement is 0,01, (iv) The speciic maximum stretching reinforcement is 0,0148, (v) The steel and iber stress-strain is linear until a value given by the ratio between yield stress and material linear elasticity modulus. Above that deformation, the
stress is constant, (vi) the beam to be reinforced has no
previ-ous deformation, (vii) the beam did not sufer plastic deforma
-tion, or damage before submitted to the reinforcement.
recommendations of NBR-6118 and ib and guidelines of (NBR-7480, [25]). This analysis was made by applying the reverse path in these project situations. It is considered as reverse path the external moment determination, arbitrating a speciic deformation for the longest iber of the concrete (ec). In this process, it is considered
the compatibility of deformations (linear deformations), reinforcement
deformations, steel and iber are determined as a function of neutral line (x), variable presented on igure 2 and, consequently the tensile and compression strengths by the equation of balance forces.
(1)
x
ce
j =
The model that it is presented on results and discussions and primordially consists in determination of the neutral line position
taking into consideration a speciic concrete deformation (ec). That
variable is necessary to evaluate the applied moment on the beam
to determine the deformation. To the determination of the neutral line, was utilized the equation of balance forces of tensile and
compression in the required section from the pure bending
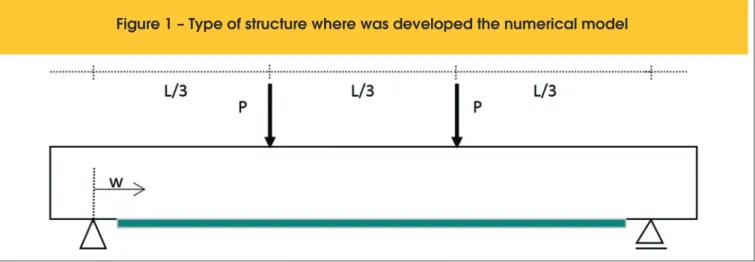
mo-ment. The igure 1 presents type of reinforced beam whose nu
-merical model was developed. The reinforcement is assessed on the section that it is more likely to bend (central section where the shear stress is null). The igure 2 presents a transversal section
that it is characteristic of the beam reinforced to tensile strength
(beam originally with lack of tensile reinforcement). C1 and C2 are
compression’s components from steel and compressed concrete,
respectively. T1 and T2 are tensile components respectively from steel and the strengthening. On the same igure is presented the
stress-strain diagram from NBR-6118 for the compressed concrete
and from ib. Item 3 shows the detailed equations for both models and present stress-strain curves for few concrete types.
Figure 1 – Type of structure where was developed the numerical model
In Figure 2, ec represents a speciic deformation from the most
compressed concrete iber, e(y) the speciic deformation in function of the distance from the neutral line and x the neutral line height.
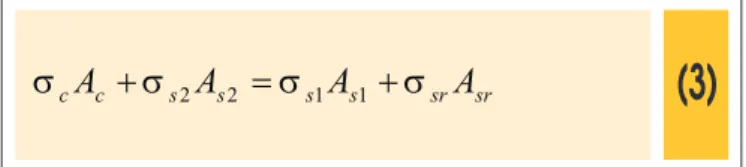
The equation of balance forces (equation 2) can be utilized to
de-termine the neutral line position. In this situation, the variable of
interest remains implicit in the equation of single variable (the
neu-tral line position). The equations solution is determined by numeri
-cal methods. To obtain other points to build the curve of moment-curvature, will be stipulated another speciic deformations for the concrete, respecting the interval of [0; 0,0035]. In this process also must be respected the speciic deformations limits for steel and structural reinforcement that was considered, respectively, 0,01 and 0,0148. Once the neutral line position is determined, it’s also
determined the stress and deformations of each material that com-poses the transversal section and it can be determined the applied
moment to the structure that resulted on the speciic deformation
of the concrete ec adopted.
The equation to determination of the neutral line is generated from
the solution of the equation 2 that it is written on general form where
C1 is the concrete’s compress force, C2 is the compress force of the compressed steel, T1 is the tensile force of the tensioned steel
and T2 is the reinforcement’s tensile force.
(2)
0
2
1
2
1
+
C
-
T
-
T
=
C
The equation 2 also can be written on stress and area forms re
-sulting on equation 3. The solution of the equation 3, according to
what was studied in the development, is an iterative form in func
-tion of speciic deforma-tion of arbitrated concrete. On equa-tion 3,
(sc and Ac), respectively, is the stress and the area of compressed
concrete; (sS2 and AS2),respectively, is the stress and the superior
reinforcement area; (sS1 and AS1),respectively, is the stress and the
area of the inferior reinforcement; (ssr and ASr), respectively, is the
stress and strengthening area.
(3)
srsr s s s s c
c
A
s
A
s
A
s
A
s
+
2 2=
1 1+
Once the neutral line position (x) is estimated, and as ec (adopted
value) is known, all the other deformations are determined and, consequently the forces C1, C2, T1 and T2. Based on this forces it can be calculated the external moment that occasioned the defor -mation ec through equation 4, where the moment is calculated
based on the section’s base. In equation 4,
X
is the centroid of theconcrete compressed area.
(4)
(
)
(
)
÷
ø
ö
ç
è
æ×
-+
-×
-+
-×
+
+
-+
×
=
2
2
)
(
1
'
2
1
X
h
x
e
C
h
d
e
T
h
d
e
T
e
C
M
eIn the “T” cross section beam scenario the process is analogue
to beams with rectangular cross section. The igure 3 that have presented a “T” cross section with a determined characteristic load and the principal variables utilized on the model. The equation for
Figure 3 – Features of transversal “T” type cross section. Representation of the acting
forces in a cross section with differential thickness dz and the stress-deformation diagrams
the determination of a neutral line and, after that an equation to
determine the applied external moment it is given by the same
equations 2 and 4 of a rectangular cross section, but here it can be
adopted the nomenclature of igure 3, in the words:
3. Results and discussions
In this section of the paper will be presented the equations that
compose models to determination of a function
moment-curva-ture considering rectangular and “T” cross section beams as well as the NBR-6118 and ib codes.
On the equation of balance forces (equation 3), it is known that
the stress on steel (compression and tensile) and the stress on strengthening are linear functions of deformation and depends
only from the speciic deformation of concrete, which is arbitrated on each step (or on each speciic deformation of the iber’s con -crete that it is most compressed, ec). It was considered that the steel and the strengthening have linear deformation behavior un-til reaches ek given by equation 5, where fk is the stress and Ek
the elasticity modulus. The variables (ek, fk, and Ek) take place,
respectively, (es1, fs1 and Es), for the tensioned steel, (es2, fs2 and Es), for the compressed steel and (ecr, fcr and Er), for the
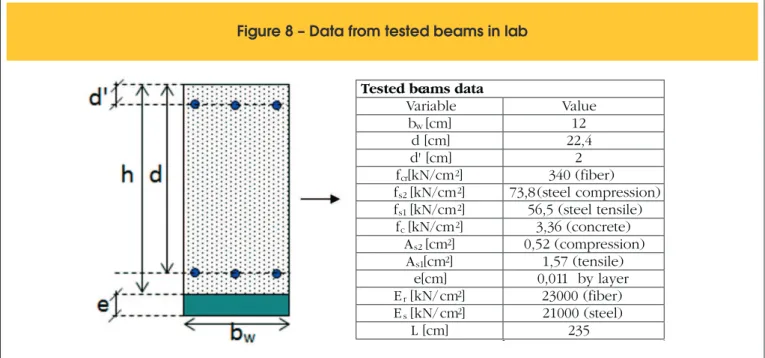
strength-ening. Figure 8 presents the stress and elasticity modulus values applied in this study. The maximum speciic deformation for these materials (steel and strengthening) were, respectively, 0,01 and 0,0148 according to technical recommendations. Moreover, for
steel (ek<e<0,01) and for strengthening (ek<e<0,0148), the stress fk was considered.
(5)
kk k
=
E
f
e
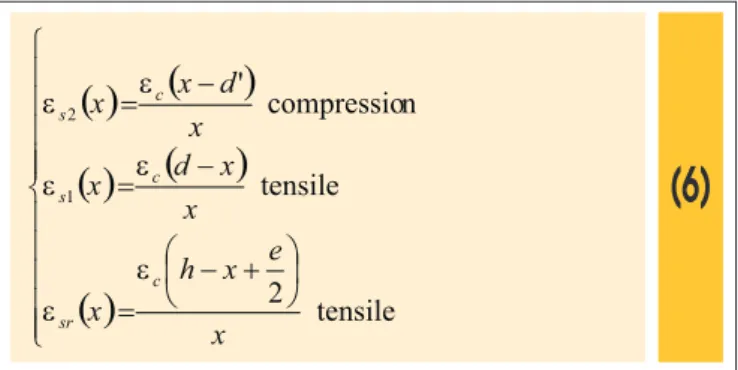
Equation 6 shows the speciic deformation of the superior rein -forcement, inferior reinforcement and strengthening, being all
function of neutral line distance, as represented in igure 2 and 3. These equations show the case of compression on the supe
-rior reinforcement and tensile stress in the infe-rior reinforcement.
There are cases (function of neutral line position) that both are reinforcement of tensile stress or reinforcement of compression
stress, the only diference is that the respective equation must me multiplied by (-1).
(6)
( )
(
)
( )
(
)
( )
ï
ï
ï
ï
ï
î
ïï
ï
ï
ï
í
ì
÷
ø
ö
ç
è
æ
-
+
=
-=
-=
tensile
2
tensile
n
compressio
'
1 2
x
e
x
h
x
x
x
d
x
x
d
x
x
c sr
c s
c s
e
e
e
e
e
e
From the speciic material deformation, stresses are obtained by
equation 7 and the components of each force are obtained
re-spectively by the multiplication of its transversal section.
(7)
( )
x
E
k k( )
x
k
e
s
=
The stress in the concrete depends of a nonlinear function of deformation as recommended by NBR-6118 and ib. The stress deformation diagram proposed by NBR-6118 is presented in
equation 8 that considers two sections according to speciic de
-formation of the concrete’s most compressed iber (ec), being one
curve section given by equation 8 and one section with constant stress for the speciic deformation interval of 0,002<ec ≤0,0035
and exactly the same as fc stress (simple concrete compression
stress). Figure 4 presents stress-strain curves obtained from equation 8 for concrete.
(8)
ú
ú
û
ù
ê
ê
ë
é
÷
ø
ö
ç
è
æ
-=
2
002
,
0
1
1
cc
c
f
e
s
Considering the modelling through ib recommendation, it gener
-ates the equations 9, 10, 11 and 12, which compounds ib recom
-mendation of the stress-strain diagram.
(9)
cm
co c ci
co c co c
c ci
c
f
Ec
E
E
E
e
e
e
e
e
e
s
÷
ø
ö
ç
è
æ
-+
÷÷
ø
ö
çç
è
æ
-=
2
sec
,
1
2
sec ,
(10)
÷÷
ø
ö
çç
è
æ
+
=
cmo cm
co
f
f
0010
,
0
0017
,
0
e
(11)
3 1
÷÷
ø
ö
çç
è
æ
=
cmo cm co E
ci
E
f
f
E
a
(12)
co cm
c
f
E
e
=
sec ,
Equations 9, 10, 11 and 12 provide: Eci,, which is the elasticity
modulus tangent when sc=0 [MPa] for concrete age of 28 days;
Eco=2,15. 104 Mpa, f
cm, which is the average compression stress;
fcmo = 10 MPa; aE is the coeicient that depends on material found in the concrete, in this case, basalt, aE=1,2.
Figure 5 presents stress-strain diagram for ib recommendation for values of concrete resistance features. It is observed that the diagram is built on a continuous curve for the concrete speciic deformation interval 0≤ec ≤0,0035.
The proposed analytical model for concrete compression determi-nation is done considering the stress-strain diagram on NBR-6118 and ib without simpliications, which implies on the necessity of us
-age of convergence numerical method of equations 2 or 3 on each
step (each ec adopted). After determined the neutral line position, it is necessary to determine the area of compressed concrete
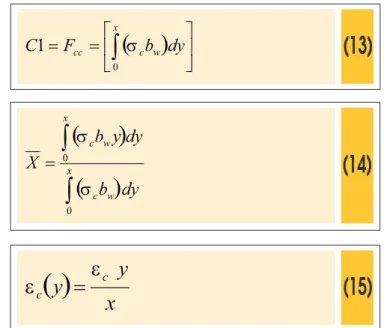
cen-troid to calculate the resistant moment, which, analytically, resulted in the deformation initially arbitrated. The diiculties to formulate the algorithm are strongly inluenced by the nonlinear concrete’s behavior. For a generic beam of a transversal section with width
bw, the equations 13 and 14 show respectively and from a gener
-alized perspective, how concrete compression component (term
from equation 2) and centroid of the compressed concrete region (equation’s 4 variable) are obtained, being Fcc the component of
concrete compression and dy the integration element. The equa
-tion 15 shows the concrete’s deforma-tion of a random iber in func
-tion of this iber posi-tioning according to the nomenclature adopted on igures 2 and 3.
(13)
(
)
ú
û
ù
ê
ë
é
=
=
F
ccò
x cb
wdy
C
0
1
s
(14)
(
)
(
)
ò
ò
=
xw c x
w c
dy
b
dy
y
b
X
0 0
s
s
(15)
( )
x
y
y
cc
e
e
=
The considered model to predict limit stress in terms of concrete
strengthening adherence was based on model proposed by (Chen and Teng [26]) and modiied by (Beber [6]). Equation 16 presents the model applied, where “e” is the strengthening thickness and
max ,
r
s
the stress limit to adherence of concrete reinforcement.(16)
e
f
E
r cr,max
=
0
,
1956
s
[kN/cm²]
3.1 Model for rectangular cross section
beams - NBR- 6118
For the generation of the resultant equation of compression force
and centroid of the compressed region, was utilized equation 17, which is originated from equation 8 but modiied to consider the integration variable y, as shown in equation 15.
(17)
ú
ú
û
ù
ê
ê
ë
é
÷
ø
ö
ç
è
æ
-
×
-=
2
002
,
0
1
1
x
y
f
cc c
e
s
Due to these the two diagram sections, 2 diferent cases are possible:
Case 1: for ec ≤ 0,002
In this case the maximum speciic deformation of the most com
-pressed concrete iber is limited in 0,002, in other words, the concrete
deformation in the entire compressed area is placed at the curve
sec-tion. Equations 18 and 19 show, respectively, compression resultant force and concrete centroid obtained from equations 13 and 14.
(18)
úû
ù
êë
é
-=
23
250000
500
c cc w cc
b
f
x
F
e
e
(19)
c c
x
X
e
e
2500
15
)
1875
10
(
-=
Case 2: for ec > 0,002
In this case the maximum speciic deformation of the most com
-pressed concrete iber has a superior value of 0,002, in other words, concrete deformation might be placed at the curve section as wells as the constant section. Equation 20 and 21 show, respec
-tively, compression resultant force and concrete centroid.
(20)
( )
ú
û
ù
ê
ë
é
-=
÷÷
ø
ö
çç
è
æ
-+
ú
ú
ú
û
ù
ê
ê
ê
ë
é
=
ò
c c
w c c w x
w c
cc
b
dy
xb
f
b
f
x
F
ce
e
s
e
1500
1
1
002
,0
1
002,0
0
(21)
ú
û
ù
ê
ë
é
-ú
û
ù
ê
ë
é
-=
c c
x
X
e
e
3000
2
1
3000000
1
2
1
2
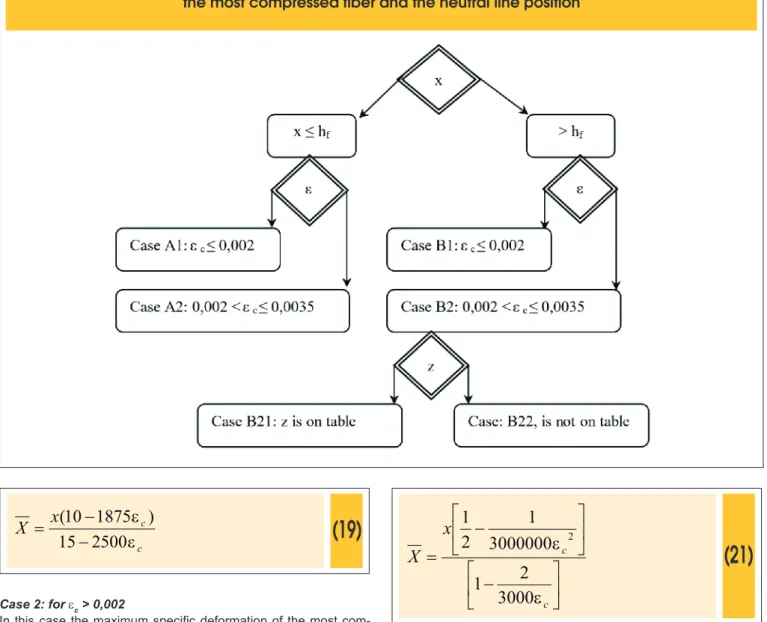
3.2 Model for “T” cross section beams - NBR-6118
In the “T” cross section scenario, as a composed section, several
cases are possible by matching with deformations ec greater and
lower than 0,002. Many possible cases are presented in the low
-chart of igure 6. Next, will be described equations for the com -pressive area of the concrete and for the matching centroid on
each case. The distance from neutral line to the concrete speciic deformation is designated as z, whose value is 0,002.
Case A1: for x ≤ hf and ec ≤ 0,002
This scenario is where the neutral line position is on table and the deformation of the concrete in the most compressed iber is lower than 0,002. The equations that have compression components
for concrete and centroid either, are represented in equations
Figure 6 – Flowchart of the possible group of equations to determine the pair
moment - curvature, according to the specific deformation of the concrete in
22 and 23, respectively, and were obtained by equations 13 and 14.
(22)
úû
ù
êë
é
-=
23
250000
500
c cc f
cc
b
f
x
F
e
e
(23)
(
)
c cx
X
e
e
2500
15
1875
10
-=
Case A2: for x ≤ hf and 0,002 < ec ≤ 0,0035
This scenario is where the neutral line position is on table and
the concrete specific deformation in the most compressed
fiber is in the range of 0,002 to 0,0035. The equations that
have components of compression for concrete and centroid ei-ther, in this scenario, are represented in equations 24 and 25,
respectively.
(24)
( )
ú
û
ù
ê
ë
é
-=
®
÷÷
ø
ö
çç
è
æ
+
ú
ú
ú
û
ù
ê
ê
ê
ë
é
=
ò
c c f cc c c f x f ccc
b
dy
b
f
x
F
b
f
x
F
ce
e
s
e1500
1
1
002
,0
002 ,0 0(25)
ú
û
ù
ê
ë
é
-ú
û
ù
ê
ë
é
-=
c cx
X
e
e
3000
2
1
3000000
1
2
1
2Case B1: for x > hf and ec ≤ 0,002
This scenario is where the neutral line position is under table and the concrete speciic deformation in the most compressed iber is lower or equal to 0,002. The equations that have components of
compression for concrete and centroid either, for this scenario, are
represented in equations 26 and 27, respectively.
(26)
( )
ò
ò
-+
=
x h x c w f x c w cc fdy
b
b
dy
b
F
s
s
0
( )
a
e
e
.
3
250000
500
c c f w c cw
cc
b
f
x
b
b
f
F
+
-úû
ù
êë
é
-=
ú
ú
û
ù
ê
ê
ë
é
-+
-=
2 32 2
2
(
)
3
250000
)
(
500
3
250000
500
c c cx
fx
cx
h
fh
x
x
x
e
e
e
e
a
(27)
c cx
X
e
e
2500
15
)
1875
10
(
-=
Case B21: for x > hf and 0,002 < ec < 0,0035 and z is on table There are 3 (three) required conditions for this scenario, the neutral line position under table, the speciic deformation of the concrete on the most compressed iber that will be in the range of 0,002 to 0,0035. Fur -thermore, the distance from the neutral line position to the deformation
has to be 0,002, designated as z and situated on table. The equations
that have compression components for concrete and centroid either,
for this scenario, are represented in equations 28 and 29, respectively.
(28)
( )
( ) ( )
( )
ò
+
-
+
-
ò
+
-
-=
-z c w f z h x c w f c w y c wcc
b
d
b
f
x
z
b
b
dy
b
b
f
x
z
F
f 0
s
s
( )
d
b
.
.
f w c cw
cc
b
f
b
b
f
F
=
+
-
ú
ú
û
ù
ê
ê
ë
é
-+
-=
x
z
x
z
x
z
c c 2 3 2 23
250000
500
e
e
b
ú
ú
û
ù
ê
ê
ë
é
-+
-+
-=
x
z
x
h
x
x
h
x
x
z
x
z
c c f c fc 2 3 2 2 2 3 2 2
3
)
(
250000
)
(
500
3
250000
500
e
e
e
e
d
(29)
ú
û
ù
ê
ë
é
-ú
û
ù
ê
ë
é
-=
c cx
X
e
e
3000
2
1
3000000
1
2
1
2Case B22: for x > hf and 0,002 < ec ≤ 0,0035 and z is not on table
There are 3 (three) required conditions for this scenario, the neutral line position under table, the speciic deformation of the concrete in the most compressed iber that will be in the range of 0,002 to 0,0035. Further -more, the distance from the neutral line position to the deformation has
to be 0,002, designated as z and situated under table. The equations
that have compression components for concrete and centroid either,
for this scenario, are represented in equations 30 and 31, respectively.
(30)
( )
( )
f w c fc w z
c w
cc
b
dy
b
f
x
z
b
b
f
h
F
=
ò
+
-
+
-0
s
f c w f c c c wcc
b
f
z
x
x
z
x
z
b
b
f
h
F
(
)
3
250000
500
2 2 2 3+
-ú
ú
û
ù
ê
ê
ë
é
-+
×
(31)
ú
û
ù
ê
ë
é
-ú
û
ù
ê
ë
é
-=
c cx
X
e
e
3000
2
1
3000000
1
2
1
23.3 Model for rectangular cross section beams - ib
The equations 32 and 33 were obtained through the generic equa
-tions 13 and 14, and the model proposed by ib (equations 9, 10,
11 and 12), in which equation 32 is for compressive strength and equation 33 is for the centroid of the concrete compressed area.
(32)
( ) ( ) ( ) ( )
ú
ú
û
ù
ê
ê
ë
é
÷÷
ø
ö
çç
è
æ
+
+
+
+
-+
-÷
ø
ö
ç
è
æ
-
+
=
2 3 2 3 3 32
3
1
.
ln
1
.
2
2
1
.
1
.
ln
d
d
dx
d
dx
d
dx
e
d
dx
d
x
c
f
b
F
cc w cm(33)
[ ] [ ]
(
)
(
) (
) (
)
÷÷
ø
ö
çç
è
æ
+
+
+
+
-+
-÷
ø
ö
ç
è
æ
+
-=
3 3 3 3 2 2 4 32
3
1
.
ln
1
.
2
2
1
.
1
.
ln
d
d
d
x
d
d
x
d
d
x
e
d
d
x
d
x
c
d
e
d
c
X
g
j
(
) ( ) ( )
ú
û
ù
ê
ë
é
+
+
+
+
-+
=
2
3
1
.
ln
1
.
2
2
1
.
2d
x
d
x
d
x
j
(
) (
) ( ) ( )
ú
û
ù
ê
ë
é
-+
-+
+
+
-+
=
6
11
1
.
ln
1
.
3
2
1
.
3
3
1
.
3 2d
x
d
x
d
x
d
x
g
The parameters a, c, d, e are described below, in equations 32 and 33. cm ci
f
E
a
=
x
a
c
=
e
c÷÷
ø
ö
çç
è
æ
-=
co c ca
x
d
e
e
e
2
1
2 0 2 2 c c
x
e
e
e
=
3.4 Model for “T” cross section beams - ib
For this “T” cross section and considering ib guidelines there are
2 (two) cases which depend on the neutral line position (below or above the table).
Case 1: for x ≤ hf, in other words, neutral line on table
In this case, the neutral line position (x) is considered as placed on
table (hf). The components for compressive strength of the concrete
and compressive centroid area are represented in equations 34 and 35, respectively. The coeicients (a, c, d, e) are the same in case 3.3.
(34)
( ) ( ) ( ) ( )
ú
ú
û
ù
ê
ê
ë
é
÷÷
ø
ö
çç
è
æ
+
+
+
+
-+
-÷
ø
ö
ç
è
æ
-
+
=
2 3 2 3 3 32
3
1
.
ln
1
.
2
2
1
.
1
.
ln
d
d
dx
d
dx
d
dx
e
d
dx
d
x
c
f
b
F
cc f cm(35)
[ ] [ ]
(
)
(
)
(
) (
)
÷
÷
ø
ö
ç
ç
è
æ
+
+
+
+
-÷÷
ø
ö
çç
è
æ
+
-÷
ø
ö
ç
è
æ
-
+
-=
3 3 3 3 2 2 4 32
3
1
.
ln
1
.
2
2
1
.
1
.
ln
d
d
d
x
d
d
x
d
d
x
e
d
d
x
d
x
c
d
e
d
c
X
h
l
(
) ( ) ( )
ú
û
ù
ê
ë
é
+
+
+
+
-+
=
2
3
1
.
ln
1
.
2
2
1
.
2d
x
d
x
d
x
h
(
) (
) ( ) ( )
ú
û
ù
ê
ë
é
-+
-+
+
+
-+
=
6
11
1
.
ln
1
.
3
2
1
.
3
3
1
.
3 2d
x
d
x
d
x
d
x
l
Case 2: for x > hf, in other words, neutral line under table
In this case, the neutral line position (x) is considered as placed below the table (hf). The components for compressive strength of
the concrete are represented in equation 36, and the parameters a, c, d, e are the same coeicients presented in case 3.3.
(36)
(
)
w cm(
f w)
cm(
f w)
cmcc
A
B
b
f
P
b
b
f
Q
b
b
f
F
=
-
+
-
-
-Where:
÷
ø
ö
ç
è
æ
+
-=
ln
.
21
d
d
x
d
x
c
A
(
)
(
) (
)
÷
÷
ø
ö
ç
ç
è
æ
+
+
+
+
-÷÷
ø
ö
çç
è
æ
+
=
3 2 3 3 32
3
1
.
ln
1
.
2
2
1
.
d
d
d
x
d
d
x
d
d
x
e
B
( ) ( )
(
)
A
c
d
d
h
x
d
h
x
P
f f+
ú
û
ù
ê
ë
é
-
+
+
-=
ln
21
( )
(
) ( )
(
) ( )
(
)
B
e
d
d
h
x
d
d
h
x
d
h
x
d
Q
f f f+
ú
ú
û
ù
ê
ê
ë
é
-
+
-+
-+
+
-=
3 3 32 3
1
ln
1
2
2
1
2
3
The equation for centroid in the concrete compressed area is given
by equation 37, and parameters (a, c, d, e) are the same presented on item 3.3.
(37)
[ ] [ ]
(
)
(
)
(
) (
)
÷
÷
ø
ö
ç
ç
è
æ
+
+
+
+
-÷÷
ø
ö
çç
è
æ
+
-÷
ø
ö
ç
è
æ
-
+
-=
3 3 3 3 2 2 4 32
3
1
.
ln
1
.
2
2
1
.
1
.
ln
d
d
d
x
d
d
x
d
d
x
e
d
d
x
d
x
c
d
e
d
c
X
z
y
3.5 Model consistence
In order to evaluate the model consistency, some experimental results were compared to others obtained through the model. These results were published in (Beber et al., [5]) and in (An
-dreolli, et al., [18]). Is not part of this work to perform these tests, as it were obtained through these publications. The ex
-perimental program that acquired these ex-perimental data was performed by Tests and Structural Models Laboratory (
Labo-ratório de Ensaios e Modelos Estruturais-LEME) from the
Graduate Program in Civil Engineering at Federal University of Rio Grande do Sul, and consisted in performing ten proto-types of reinforced concrete beams according to figure 7 and
8 (Beber et al. [5]).
The concrete specific deformation, reinforcement and strength-ening strips, in the central cross section of each prototype
were measured through strain gages. The applied load deter
-mination was performed through a load cell with a capacity of 200kN. The vertical displacements were determined through vertical registers, with a precision of 0,01 mm, in the load ap
-plication point and the central section. The horizontal displace
-ments were measured in the roller support. The flowchart, pre -sented on figure 8, has an input data in the numerical model
according to the nomenclature used in the present study.
The results acquired in rupture tests and theoretical data obtained
through the proposed model are presented in table 1, showing great similarity.
To obtain the theoretical rupture load in table 1 was used equation 38 that is originated from diagram of bending moment between the 2 (two) sections of load application, as Me the resulting external
moment in the cross section, according to equation 4. The types of rupture are classiied as type 1, 2 and 3. Type 1, rupture through excessive tensile strength on steel; Type 2, rupture through ex
-cessive tensile strength on the strengthening; and type 3, rupture through adherence failure between concrete and strengthening.
(38)
L
M
e6
carga
=
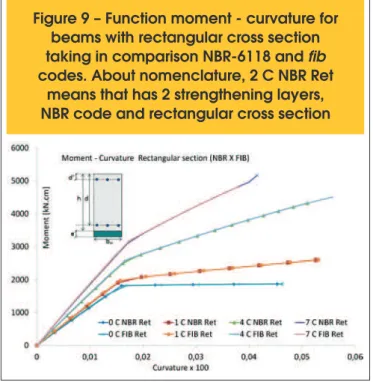
A parametric study was performed to evaluate the behavior on the function moment - curvature changing the amount of strengthen-ing, codes, types of section and the material features that
com-poses the beams (concrete and steel). An embracing parametric study was based on (Andreolli et al., [18]). The results for a rect
-angular cross section are presented on igure 9, while igure 10 present the results for a “T” cross section. Both codes considered have shown great match between them and the curves are practi
Figure 8 – Data from tested beams in lab
Tested beams data
Variable
Value
b
w[cm]
12
d [cm]
22,4
d' [cm]
2
f
cr[kN/cm
2]
340 (fiber)
f
s2[kN/cm
2]
73,8 (steel compression)
f
s1[kN/cm
2]
56,5 (steel tensile)
f
c[kN/cm
2]
3,36 (concrete)
A
s2[cm
2]
0,52 (compression)
A
s1[cm
2]
1,57 (tensile)
e[cm]
0,011 by layer
E
r[kN/cm
2]
23000 (fiber)
E
s[kN/cm
2]
21000 (steel)
L [cm]
235
cally overlapped. For the case of beams with T cross section was considered the parameters on igure 8 including a table with height
hf=5cm and width bf=20cm.
4. Conclusion
The strengthening of reinforced concrete beams with carbon iber
composites is an interesting alternative in several situations, due to,
mainly, its practicality to perform and quickness. However, to achieve strengthening eiciency, it is necessary to exist suicient adherence area, and does not occur rupture on the compressed concrete. If
compared to the experimental results, the theoretical model have presented very efective results, which corroborate to evaluate the reinforced concrete beams strengthened with carbon iber com
-posites or steel plates. The curvature in the structural beam can be
evaluated through the proposed model in function of the acting
mo-ment and may evaluate the eiciency to add more strengthening layers. The numerical model proposed shown that NBR-6118 and ib
guidelines presented accurate results to the moment - curvature and
to the load rupture. The proposed methodology appears to be an
interesting tool in order to evaluate the strengthening performance,
as well as to evaluate the structure load capacity. It is recommended
Table 1 – Theoretical and experimental results in comparison.
(Adapted from Beber, et al. [5] and Andreolli, et al. [18])
Beam Strengthening
Experimental results Theoretical results
Failure mode
Load of rupture
[kN]
Load of rupture NBR
[kN]
Difference [%]
Load of rupture fib
[kN]
Difference [%]
1 – type 1 47,0 49.18
(type 1) 4,19
49,03
(tipo 1) 3,88
2 – type 1 47,4
3 1 layer type 1 65,2 67,31
(type 1) 5,83
67,47
(type 1) 6,08
4 1 layer type 2 62,0
5 4 layers type 3 102,2 116,18
(type 3) 14,58
116,67
(type 3) 15,06
6 4 layers type 3 100,6
7 7 layers type 3 124,2 130,76
(type 3) 5,37
123.65
(type 3) 0,36
8 7 layers type 3 124,0
9 10 layers type 3 129,6 128,94
(type 3) 3,38
124,72
(type 3) 6,88
Figure 9 – Function moment - curvature for
beams with rectangular cross section
taking in comparison NBR-6118 and
fib
codes. About nomenclature, 2 C NBR Ret
means that has 2 strengthening layers,
NBR code and rectangular cross section
Figure 10 – Function moment - curvature for
beams with “T” cross section taking in comparison
NBR-6118 and
fib
codes. About nomenclature,
7 C FIB T means that has 7 strengthening layers,
fib
code and “T” cross section
to develop models and experiments that incorporate data from the
loading start until the beam breaks, in order to evaluate the model
performance at any deformation domain.
5. Bibliographic references
[1] SPAGNOLO JR, L. A., SÁNCHEZ FILHO, E. S., VELASCO, M. S. L. RC T beams strengthened to shear with carbon iber composites, 2013. IBRACON Structural Journal, SP, v. 6, n. 1, p. 1-12, 2013.
[2] SAADATMANESH, H., EHSANI, M. R. RC beams strength
-ened with GRFP plates. I: experimental study. Journal of Structural Engineering, New York, ASCE, v.117, n.11, p.3417-3433, 1991.
[3] AN, W., SAADATMANESH, H., EHSANI, M. R. RC beams strengthened with GRFP plates. II: analysis and parametric study. Journal of Structural Engineering, New York, ASCE, v.117, n.11, p.3435-3455, 1991.
[4] GARCÉS, P., ZORNOZA, E., E. ALCOCEL, G., GALAO, Ó. ANDIÓN, L.G. Mechanical properties and corrosion of CAC mortars with carbon ibers. Construction and Building Materi
-als v. 34, p. 91–96, 2012.
[5] BEBER, A. J., CAMPOS F. A., CAMPAGNOLO, J. L. Re
-inforced concrete beam structures with carbon iber post-impregnated material . Téchne. Revista de Tecnologia da Construção, SP, n. 45, p. 52-55, 2000.
[6] BEBER, A. J. Structural behavior of reinforced concrete beams with carbon iber composites. 2003. 317 p. Thesis (Doctorate in Civil Engineering) - UFRGS.
[7] GARCEZ, M. R., QUININO, U. C. M.., SILVA FILHO, L. C. P., MEIER, U. Application of Heat-Activated Films as a new
generation of adhesives used for bonding Fiber Reinforced
Polymers to concrete., IBRACON Structural Journal, SP, v. 1, n. 4, p. 393-420, 2008.
[8] FERRARI, V. J., HANAI, J. B. Flexural strengthening of reinforced concrete beams with carbon ibers reinforced
polymer (CFRP) sheet bonded to a transition layer of high
performance cement-based composite, 2012. IBRACON Structural Journal, SP, v. 5, n. 5, p. 596-626, 2012.
[9] TIAN, H., ZHANG, Y.X., YE, L., YANG, C. Mechanical behav
-iours of green hybrid ibre-reinforced cementitious compos
-ites. Construction and Building Materials, v. 95 p. 152–163, 2015.
[10] SANTOS, G. S., NICÁCIO, W. G., LIMA, A. W., MELO, G. S. S. A. Punching strengthening in lat plates of reinforced con
-crete with carbon iber reinforced polymer (CFRP). IBRAC
-ON Structural Journal, SP, v. 7, n. 4, p.592-695, 2014. [11] GAMINO, A. L., SOUSA, J. L. A. O., MANZOLI O. L., BIT
-TENCOURT, T. N. R/C structures strengthened with CFRP part II: analysis of shear models. IBRACON Structural Jour
-nal, SP, v. 3, n. 1, p. 24-49, 2010.
[12] GARCEZ, M. R., SILVA FILHO, L. C. P., MEIER, U.R.S. Post-strengthening of reinforced concrete beams with prestressed CFRP strips. Part 1: Analysis under static loading. IBRACON Structural Journal, SP, v. 5, n. 3, p. 343-361, 2012.
[13] BEBER, A. J., CAMPOS F. A. CFRP Composites on the shear strengthening of reinforced concrete beams. IBRAC
-ON Structural Journal, SP, v. 1, n. 2, p. 127-143, 2005. [14] YAQUB, M., BAILEY, C.G. Repair of ire damaged circular
reinforced concrete columns with FRP composites, Con
-struction and Building Materials v. 25, p. 359–370, 2011. [15] SWAMY, R. M., JONES, R., BLOXHAM, J.W. Structural be
-havior of reinforced concrete beams strengthened by epoxy-bonded steel plates. Journal of Structural Engineering. v. 2, n. 65A , p.59-68, 1987.
R/C structures strengthened with CFRP Part I: analysis of lexural models. IBRACON Structural Journal, SP, v. 2, n. 4, p. 326-355, 2009.
[18] ANDREOLLI, I., BEBER, A. J., CAMPAGNOLO, J. L. Para -metric study of structural strengthening of reinforced
con-crete beam with carbon iber composites. DAMSTRUCT, 2000. Third international conference on the behavior of dam
-aged structures. UFF-RJ, 2000.
[19] EL-REFAIE, S. A., ASHOUR, A. F., GARRITY, S. W. Flexur
-al capacity of reinforced concrete beams strengthened with external plates. In: INTERNATIONAL CONFERENCE ON STRUCTURAL FAULTS AND REPAIR, 8. London. Proceed
-ings. Edinburgh: Engineering Technics Press, CD-ROM, 1999.
[20] AL-SAIDY, A.H., KLAIBER, F.W., WIPF, T.J., AL-JABRI, K.S. AL-NUAIMI, A.S. Parametric study on the behavior of short span composite bridge girders strengthened with carbon iber reinforced polymer plates, Construction and Building Materials v. 22 p. 729–737, 2008.
[21] HOLLAWAY, L.C., LEEMING, M.B. Strengthening of rein
-forced concrete structures using externally bonded FRP composites in structural and civil engineering. 1ed. Cam
-brifge: Woodhead Publishing Limited, 327p, 1999.
[22] AGBOSSOU, A., LAURENT M., LAGACHE, M., HAMELIN, P. Strengthening slabs using externally-bonded strip com -posites: Analysis of concrete covers on the strengthening,
Composites: Part B 39, p. 1125–1135, 2008.
[23] NBR-6118. Design of concrete structures – procedure. ABNT-Code, Rio de Janeiro, 231 p, 2007.
[24] FÉDÉRATION INTERNATIONALE DU BÉTON. Structural concrete: textbook on behaviour, design, and perfomance. Lausanne, 1999, v.1 (Model Code 1990).
[25] NBR-7480. Bar and steel wires for reinforced concrete. ABNT-Code, Rio de Janeiro, 1996.
[26] CHEN, J. F., TENG, J. G. Anchorage strength models for FRP and steel plates bonded to concrete. Journal of Struc
![Figure 7 – Test scheme and prototype detailing (Beber, et al. [5])](https://thumb-eu.123doks.com/thumbv2/123dok_br/18861363.417980/10.892.457.825.355.437/figure-test-scheme-prototype-detailing-beber-et-al.webp)