ISSN 0104-6632 Printed in Brazil
www.abeq.org.br/bjche
Vol. 33, No. 04, pp. 933 - 943, October - December, 2016 dx.doi.org/10.1590/0104-6632.20160334s20150440
*To whom correspondence should be addressed
Brazilian Journal
of Chemical
Engineering
THE EFFECT OF SURFACTANT AND HIGH
MOLECULAR WEIGHT POLYMER ADDITION ON
PRESSURE DROP REDUCTION IN PIPE FLOW
Z. Matras and B. Kopiczak
*1
Department of Fluid Mechanics, Institute of Thermal and Process Engineering Cracow University of Technology, Al. Jana Pawla II 37, 31-864 Cracow, Poland.
Phone: + 48 12 628 3221, Fax. + 48 12 628 3500 E-mail: [email protected] Phone: + 48 12 628 3244, Fax: + 48 12 628 3500
*
E-mail: [email protected]
(Submitted: July 10, 2015 ; Revised: August 23, 2015 ; Accepted: August 26, 2015)
Abstract - The main aim of this paper is to present a possibility to enhance the drag reduction effect in straight pipe flow by the simultaneous addition to the transported liquid of a small amount of high molecular weight polymers and surfactants. Qualitative analysis of the polymer-micellar additive influence on the shape and character of flow resistance curves has been performed. Also multicomponent polymer-micellar solution flow resistance curves were compared with appropriate single additive polymer or surfactant solution flow resistance curves. The experimental data shows that, for polymer-micellar solutions, the stable transitional zone between the laminar and the turbulent flow regions is extended toward higher values of the critical Reynolds numbers. Occurrence of the phenomenon can be explained by the flow laminarization caused by polymer-micellar aggregates. Existence of the third extended drag reduction zone in the turbulent range of flow has also been observed for the first time.
Keywords: Non-Newtonian flow; Pressure drops reduction; Polymer-surfactant additive; Polymer-micellar aggregate.
INTRODUCTION
Abnormal flow drag reduction by surfactant or polymer additives is intensively examined and de-scribed in the subject literature (Matras, 1984; Boro-stow, 2008; White and Mungal, 2008; Wang et al., 2011; Shu-Peng, 2012; Tamano et al., 2010;). This phenomenon allows a significant increase of flow rate without increasing power demand, or vice versa – to reduce power demand while maintaining a con-stant flow rate. It provides large potential possibili-ties for the application of this effect in different in-dustry branches, particularly in the oil inin-dustry or in heating, firefighting, transport of slurries, sludge and brines (Motier et al., 1996; Figueredo and Sabadini,
efficient drag reduction effect in the turbulent range of flow (White and Mungal, 2008; Wang et al., 2011; Zadrazil et al., 2012).
In case of application of surfactants as drag re-ducing additives, formation of micelle structures is observed (Tamano et al., 2010; Wang et al., 2011). In order to improve the micellarization process effec-tiveness in surfactant solutions, small amounts of electrolytes are applied (e.g. sodium salicylate or sodium bromide). At the no motion condition, the mentioned structures are chaotic. Only during fluid flow shearing do both macromolecules and micelles start to arrange in characteristic orientations, in ac-cordance with the principle of the minimum re-sistance. In both surfactant and polymer induced experiments on the drag reduction effect, a hypothet-ical mechanism of the phenomenon that is widely accepted is the interaction between polymer or sur-factant molecules and the flow turbulence structure. On the basis of advanced measurement techniques, such as Particle Image Velocimetry (PIV), it is ob-served that polymer additives can lead to reduction or elimination of the ejections of low-momentum fluid from the wall region to the outer velocity re-gion (Warholic et al., 2001). It is also observed that the presence of polymers leads to a decrease in the frequency and the intensity of large-scale ejections when compared to a Newtonian solvent (Liberatore
et al., 2004) and to the reduction of the magnitude and frequency of the small-scale eddies (Liberatore
et al., 2004). Usually, elongational viscosity or elas-ticity of the polymer chain (White and Mungal, 2008) are proposed to explain the hypothetical poly-mer drag reduction mechanics. On the other hand, for a surfactant aqueous solution, which exhibit nei-ther viscoelastic properties nor the presence of elon-gational viscosity (Wang et al., 2008), a local shear-thickening hypothesis is proposed (Wang et al., 2008; Hadri et al., 2010).
A novel and poorly recognized effect is a phe-nomenon of fluid flow drag reduction by the simulta-neous addition into the solvent of both high molecu-lar weight polymer and surfactant with salt. In the few published works related to this subject (Minatti
et al., 1996; Hou et al., 1999; Suksamranchit et al., 2006; Jung et al., 2011) the internal structure for-mation and chemical reaction process in polymer-micellar solutions are mainly highlighted. Initial attempts at experimental examination of the drag reduction effect have been performed (Matras et al., 2008; Mohsenipour et al., 2013). The results con-firmed that simultaneous addition into the solvent of these additives combines and intensifies the posi-tive features of their purely polymer and micellar
analogues, providing additional extension of the drag reduction zones. Moreover, the researchers indicate that this new effect requires a comprehensive experi-mental study to gain a deeper knowledge of this phe-nomenon.
The presence of polymer macromolecules in the surfactant solution enhance the micelle structure formation ability. It leads to the formation of micel-lar structure at a lower concentration. The newly formed macromolecule is called an aggregate (Mat-ras et al., 2008; Mohsenipour et al., 2013). Adding a slight amount of salt (e.g. NaCl or NaSal) to the high molecular weight polymer and surfactant solution causes micelle size growth. The number of micelles linked with the polymer chains also increases. Fur-thermore, the addition of the salt can increase the solution viscosity.
The aim of this paper is to perform an analysis of the drag reduction efficiency induced by simultane-ous addition to the solvent of both surfactants and high molecular weight polymer, comparing to the drag reduction effect obtained by addition of pure polymer or pure surfactant agents.
CHARACTERISTIC OF POLYMER-MICELLAR SOLUTION INTERNAL STRUCTURE
Simultaneous addition to the solvent of small amounts of polymer and surfactant additives triggers initiation of the micellarization process at much lower concentration, compared to the critical micelle concentration (CMC) (Deo et al., 2007; Jönsson et al., 1998). This concentration at which micelle for-mation occurs in the presence of polymer macro-molecules is called the critical aggregation concen-tration (CAC). The newly formed polymer-micelle macromolecules are called aggregates (Diamand and Andelman, 1999; Matras et al., 2008). From the ex-perimental study of polymer-micellar aqueous solu-tions (Jönsson et al. 1998; Mohsenipour et al., 2013), the mechanism of aggregates formation pro-cess can be described. Initially polymer and surfac-tants molecules occur in the solution independently. The situation significantly changes when a small amount of salt is introduced into the solution. Ac-cording to Minatti et al. (1996) and Matras et al.
le m p th ex p th C W co lo la rh cl ra p b co re p re ca p rh 1 3 el 0
eads to a pol mum viscosity
MA
Having an lanned expe he type of p xperiment w illarypipe rh he Division Cracow Uni Walczak, 200
onduct a c ogical chara aboratory con
The versa heometer all lassical exp ange of flow
roperly the ehave differ ous non-Ne egion. This
olymers and esearch in th an be consid hysical cont heostable (p
– straight ca – electroma lectrical eng 1A; 9 – tank
The Effect of Su
Brazilian
ymer saturat y value of th
ATERIALS A nalysed the erimental tes physical quan was perform heometer, de
of Fluid M versity of 03). The dev comprehensiv acteristics o
nditions. atility of th
lows the op erimental fl w, but also
flow chara rently when ewtonian flu applies prim d surfactants his work, as dered to be tinuum and purely viscou
Fi apillaries and agnetic flowm
ine; 6 – data ks; 10 – temp
urfactant and Hig
Journal of Chem
tion point (P he mixture is
AND METH
level of di sts and takin ntities to be med using esigned and Mechanics lab Technology vice allows ve identifica
f the exam
he described perator to a low curves to examine acteristics of compared w uids in the marily to th s, which are
well as to th on the bord
multi-phase us) or visco
igure 1: Diag d pipes with meters; 4 – f a acquisition perature sens
gh Molecular Wei
mical Engineering
SP) - the ma reached.
HODS
ifficulty of ng into acco e measured, a modern constructed boratory at y (Matras a
the operator ation of rh mined liquid
d capillary-p ssign not o in the lami e and interp
f fluids wh with purely v
turbulent fl he solutions
the subject he fluids wh der between e systems, e oelastic susp
gram of the m circular cros flowmeter co system; 7 – ors PT 100.
ight Polymer Add
g Vol. 33, No. 04,
axi-the ount the ca-d in the and r to heo-in pipe only inar pret hich vis-low of t of hich the e.g., pen-sio rhe per cu ure L. Lin en inf for (5) an pip thr ret pre dif tai tem (10 ran pre tai va val (no multifunctio ss-section; 2 ontrollers; 5 –
microproces
dition on Pressure
, pp. 933 - 943,
ons. A sche eometer is ill
The basic e r and stainle lar cross-sec ement of flu Static pres
nl= Lout≈150
sures stable fluence of th The fluid fl rced by herm ), which suck d pump it t pes of diff rough the ele turns to the s essure losses fferential pre
For the tem ining a const m was prov 0) was place
Pumps can ngements, de essure loss v in a wide ran lue of 3×10 lue up to 10 o foaming of
n capillary-p – differentia – Multistage ssor frequenc
e Drop Reduction
October - Decem
matic diagr lustrated in F
lements of th ess steel capi ctions (1). Th uid flow pres sure holes w 0 d from the
flow condi e so-called " flow in the c metic multis k in the fluid then into on ferent diame
ectromagneti storage tank. s were perfo essure drop se mperature con tant temperat vided) a res
d in the fluid work in ei epending on value. This a nge of Reyno
5 for a mea
bar, without f the solution
pipe rheomet al pressure d e rotodynami cy converter
n in Pipeflow
mber, 2016
ram of the Figure 1.
he device ar illaries and p hey are used ssure loss at were spotted
pipe inlet an ditions and e "entrance effe capillary-pipe stage rotody d from one o ne of the ei eters (1). A ic flowmeter . The measur ormed using
ensors (2). ntrol (possib ature in the m
sistive tempe d supply pipe ither series o n the require
allows the o olds numbers asurement sy
the loss of f or air bubble
ter:
drop sensors ic pumps wit r L100; 8 – a
9
capillary-pip
e straight co pipes with ci d for the mea t pipe distan d at distanc nd outlet. Th eliminates th ect."
e rheometer ynamic pump of the tanks (
ght horizont After passin rs (3) the flu
rements of th g PD1 or PD
bility of mai measuring sy erature sens e.
or parallel a d flow rate operator to o s, reaching th ystem pressu fluid continui
es).
P-A microprocessor frequency converter (7) was used to control the pump frequency and consequently volumetric flow rate. The main element supporting the action of the capillary-pipe rheometer is a multi-channel data acquisition system SPIDER 8 (Hot-tinger Baldwin Messtechnik), arranged to measure the electrical signals from the different sensors (ten-sion, force, pressure, displacement, acceleration and temperature sensors).
Additionally, large volume tanks (1 m3) were used to eliminate the effect of foaming of micellar and polymer-micellar solutions and to minimize the in-fluence of the unavoidable degradation of the poly-mer-micellar aggregates or macromolecular struc-tures on the measurement results.
During the preparation of the polymer-surfactant solutions, the pH of the chosen drag reducing addi-tives should be particularly considered. Incorrect selection of pH may result in an undesired chemical reaction.
Anionic surfactants cannot be used when aqueous solutions of certain polymers can have an acidic reaction. Cationic and anionic surfactants can be combined with non-ionic polymer solutions.
After preliminary study, the following drag reduc-ers were used for experimental analysis:
Poly(ethylene oxide) [CH2 CH2 O]n (PEO) –
non-ionic polymer with viscosity-based high mo-lecular weight given by the manufacturer equal to 8·106 g/mol-1, purchased from Sigma-Aldrich, Inc.
Cetyltrimetyl ammonium bromide
[CH3(CH2)i5N(CH3)3]+Br~ (CTAB) – cationic
sur-factant purchased from Sigma-Aldrich, Inc.
In order to lower the CAC value, the salt C7H5NaO3 (NaSal) sodium salicylate has been used.
Different compositions of polymer, surfactant and salt mass fraction in solvent were used in order to analyse the chemical additive concentration effect. Distilled water was used as solvent. A Polna, Inc. Electrical Distillatory Type DE20 was used to purify tap water. The conductivity of the solvent was of the order of 1 µS/cm.
After addition to the solvent of the appropriate drag reducers, solutions were mixed gently so as not to cause mechanical degradation of polymer chains. The first mixing was performed in cylindrical ves-sels, by the use of a roller mixer of our own design with very a low rotational speed equal to 1-5 rpm. Then the solution was diluted in the main tanks. Be-fore measurements, mixtures were left to rest for 24 hours.
In order to conduct an analysis of drag reduction efficiency by simultaneous addition to the solvent of both surfactants and high molecular polymer,
compared to the drag reduction effect obtained by the addition of pure polymer or pure surfactant agents, 15 solutions with different additive composi-tions and concentracomposi-tions were investigated. Designa-tion and the composiDesigna-tion of the analysed mixtures are presented in Table 1.
Adiabatic steady flow of homogenous solutions was examined in 8 different straight pipes with diam-eters between 1.8 mm and 21 mm, all with a tem-perature of 27 °C.
RHEOLOGICAL CHARACTERISTICS AND FLOW RESISTANCE MEASUREMENT
RESULTS
In order to identify the rheological characteristics of the analysed solutions, each of the experimental/ pipe flow curves was represented in the form of the functional relationship described by the Equation (1):
w
f (
Γ
)
τ =
(1)where:
w
D P 4L
Δ
τ = is the shear stress on the pipe wall,
m
8v D
Γ
= is the pipe shear rate (value of the shear rate on pipe wall).Interpretation of the experimental results pre-sented in the form of function (1) indicates that the solutions can be successfully approximated with the Ostwald de Waele power-law fluid model. Rheologi-cal parameters K (fluid consistency constant) and n (flow behavior index) for each of the analysed solu-tions are summarized in Table 1. Representative rheological characteristics in the form of experi-mental/pipe flow curves are illustrated in Figure 2.
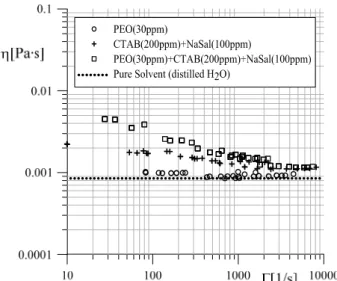
Additionally, representative shear viscosity curves vs. shear rate for the analysed solutions of Figure 2 are presented in Figure 3.
The Effect of Surfactant and High Molecular Weight Polymer Addition on Pressure Drop Reduction in Pipeflow 937
Brazilian Journal of Chemical Engineering Vol. 33, No. 04, pp. 933 - 943, October - December, 2016
constant polymer concentration, leads to the intensi-fication of non-Newtonian properties of the fluid, i.e., to the increase of the value of the fluid con-sistency constant K and the decrease of the n flow index.
Table 1: Summary of the analysed solution and their designated rheological constants.
Solution designation
Solutions composition
K [Pa.sn]
n [-]
Sol.1 10 ppm PEO 0.00111 0.974 Sol.2 30 ppm PEO 0.00113 0.970 Sol.3 60 ppm PEO 0.00115 0.973 Sol.4 200 ppm CTAB 0.00097 0.991 Sol.5 100 ppm NaSal; 200
ppm CTAB
0.00313 0.869
Sol.6 200 ppm NaSal; 400 ppm CTAB
0.00886 0.748
Sol.7 400 ppm NaSal; 400 ppm CTAB
0.01164 0.722
Sol.8 10 ppm PEO; 100 ppm NaSal; 200 ppm CTAB
0.00299 0.860
Sol.9 10 ppm PEO; 200 ppm NaSal; 400 ppm CTAB
0.00754 0.754
Sol.10 30 ppm PEO; 200 ppm CTAB
0.00120 0.969
Sol.11 30 ppm PEO; 100 ppm NaSal; 200 ppm CTAB
0.00510 0.772
Sol.12 30 ppm PEO; 200 ppm NaSal; 400 ppm CTAB
0.01430 0.631
Sol.13 60 ppm PEO; 100 ppm NaSal; 200 ppm CTAB
0.00307 0.868
Sol.14 60 ppm PEO; 200 ppm NaSal; 400 ppm CTAB
0.00612 0.800
Sol.15 60 ppm PEO; 400 ppm NaSal; 400 ppm CTAB
0.00979 0.733
Figure 2: Representative experimental flow curves for polymer, surfactant and polymer-surfactant solutions.
Figure 3: Representative shear viscosity curves as a function of shear rate for polymer, surfactant and polymer-surfactant solutions.
The interpretation of experimental data and the assessment of the respective solution additives’ influ-ence on the increase or reduction of the flow re-sistance and the shape and location of rere-sistance curves depend significantly on the coordinate system adopted for data presentation. Firstly, experimental results of flow resistance are presented in the classi-cal system of dimensionless numbers [Res, cf]
de-scribed by formulas (2) and (3):
m S S
S
v d
Re = ρ
η (2)
f 2
m
d P c
2 v L Δ =
ρ (3)
and additionally in the form of drag reduction coeffi-cient DR defined as a function of the Reynolds num-ber (2), and described in percentage terms:
f fS
c
DR 1 100%
c
⎛ ⎞
= −⎜ ⎟×
⎝ ⎠ (4)
surfactants causes an increase of flow resistance in the laminar range of flow.
Figure 4: The flow resistance curves of polymer, surfactant and polymer-micellar water solutions, defined in the system of cardinal numbers (2) and (3).
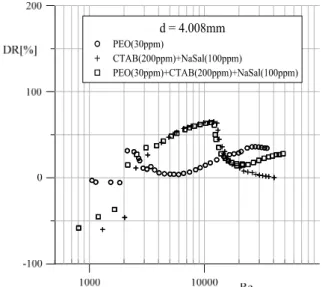
The drag reduction coefficient curves (4) are il-lustrated in Figure 5. It is observed that, in the case of the turbulent flow, simultaneous application of the chemical additives produces the drag reduction effect.
Figure 5: The drag reduction coefficient curves DR = f(Re).
Due to the difficulty in unambiguous determina-tion of the critical value of the Reynolds number Res,
the DR values presented in Figure 5 are calculated in such a way that it was assumed that cfs=16/Res in the
range of the Reynolds number Res<2100, whereas
the formula cfs=0.079/ Res-0.25 was used in the range
of Reynolds number Res≥2100. Therefore, a sharp
increase of the DR value observed in the transition zone, particularly in the polymer solution (see in Figure 5), does not reflect the actual degree of drag reduction in this range of flow. In the case of the polymer solution flow, in the initial stage of the tur-bulent flow, no noticeable reduction of flow re-sistance is observed. Only after exceeding a certain characteristic Reynolds number Res ≈ 1.5×10⁴, the
onset of the drag reduction effect occurs and the phenomenon increases with the increase in the value of the Reynolds number. A similar increase in the reduction of the shear resistance for the turbulent flow range, induced with PEO additive, was ob-served in the drag reduction effect obtained by the use of a rotating-disk apparatus (Kim et al., 2001).
Furthermore, the value of the critical Reynolds number for which the transition from the laminar flow to the turbulent flow is observed takes various values that depend on pipes diameter, type and con-centration of chemical additives introduced into the solvent.
A better interpretation of the simultaneous addi-tion of the polymer and surfactant with salt effect on drag reduction, in comparison with adequate addition of pure polymer or pure surfactant with salt, can be achieved by presentation of the same measurement date in a modified system of “pseudorheostable” numbers [ReM, cfM]. The modified system of
dimen-sionless numbers used in the analysis is described by formulas (5) and (6):
(
)
2,5 n 2 nm S
M
n 1
2 n 1 d v
Re
3n 1 3n 1
K 8
4n
− −
−
+
⎡ ⎤
ρ
= + ⎢ ⎥
+
⎛ ⎞ ⎣ ⎦
⎜ ⎟
⎝ ⎠
(5)
(
)
2,5fM 2
S m
2 n 1 d P
c
3n 1
2 v L
+
⎡ ⎤
Δ
= ⎢ ⎥
+
ρ ⎣ ⎦ (6)
The Effect of Surfactant and High Molecular Weight Polymer Addition on Pressure Drop Reduction in Pipeflow 939
Brazilian Journal of Chemical Engineering Vol. 33, No. 04, pp. 933 - 943, October - December, 2016
modified system of pseudorheostable dimensionless numbers [ReM, cfM] each deviation of the
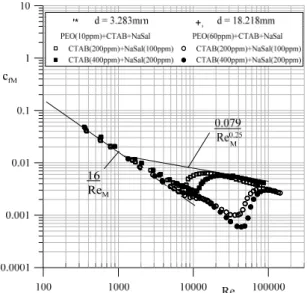
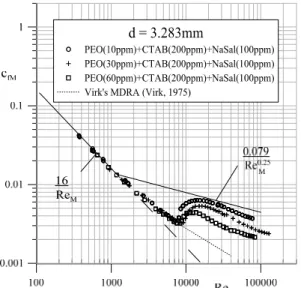
experi-mental flow resistance curve, which indicates abnor-mal drag reduction from the pseudorheostable Blasius curve, allows for the identification of the influence of specific additives (polymers or/and sur-factants with salt) on the range of the drag reduction effect. Figure 6 presents a comparison of flow re-sistance curves in the modified number system (5) and (6) for 3 types of solutions with different internal structures.
Figure 6: The flow resistance curves of polymer, surfactant and polymer-surfactant water solutions, defined in the system of cardinal numbers (5) and (6).
The results of experimental data analysis indicate that polymer-surfactant additives cause significant drag reduction in a wider range of flow in compari-son with pure polymer and pure surfactant solutions. Surfactant and salt additives (micellar solution) in-duce the appearance of the stable transitional zone, in which a spectacular reduction of flow resistance is observed – usually greater when compared to the same effect achieved with polymer additives. This zone was not observed for the polymer-surfactant solution without the salt additives. Figure 7 demon-strates the influence of NaSal additive on the drag reduction effect. It is clearly evidenced by the flow resistance curves that, with the addition of a small amount of electrolyte (e.g., salts or alcohols), a refor-mation of spherical micelles into threadlike micelles must proceed. It leads to significant extension of the transitional zone. An efficient drag reduction effect is observed within this zone of flow.
In the stable transitional zone, loss of stability of the laminar flow increases gradually when the
Reynolds number values grow. In this range the rela-tive drag reduction is the greatest. Beyond a certain second critical value of the Reynolds number the occurrence of an unstable transitional zone is ob-served. In this range of flow a rapid loss of the drag reduction effect occurs.
Surfactant and salt concentration effects were observed within this zone as illustrated in Figure 8.
Figure 7: The effect of NaSal additive on the poly-mer-surfactant flow resistance curve.
Figure 8: Surfactant and salt concentration effects on the flow resistance curves of polymer-micellar aqueous solutions.
An increase of surfactant and salt concentration leads to a further extension of the transitional zone towards greater values of the Reynolds number.
rheostable non-Newtonian fluid. An additional ab-normal drag reduction zone in the turbulent range is observed. The viscoelastic properties of the solution
are a dominant factor. This effect is well illustrated in Figure 9.
Figure 9: Polymer concentration effect on the flow resistance curves of polymer-surfactant aqueous solutions.
In comparison with a purely micellar solution, the collapse of drag reduction is normally observed in this region. It should also be noted that addition to the micellar solution of even small amounts of high molecular weight polymer (about 10ppm) causes a reduction of the non-Newtonian properties of the solution.
The results of drag reduction measurements indi-cate the effect of pipe diameter on drag reduction efficiency. Figure 10 illustrates the pipe diameter effect on the flow resistance curves of polymer-surfactant water solutions. Increasing the pipe diame-ter d results in a clear extension of the stable transitional zone towards higher values of the Reynolds number. Moreover, decreasing the pipe diameter value d results in an increase of the drag reduction effect in the third additional turbulent range of flow.
The experimental results reveal that polymer-micellar solutions can be characterized by a lower susceptibility to mechanical degradation during flow or that the degradation can be almost invisible in the analysed range of flow. Figure 11 illustrates a shift of the collapse of the drag reduction effect toward greater values of Reynolds number caused by polymer-surfactant additives.
Pure PEO solution degrades very fast under high shearing conditions. Collapse of drag reduction is
gradually observed in such a case. Experimental results show a considerable increase of the Reynolds number value at which the mechanical degradation of polymer and the collapse of the DR effect are observed in polymer-micellar solution.
Figure 10: Pipe diameter effect on the flow resistance curves of polymer-surfactant water solutions.
Figure 11: Shift of the collapse of drag reduction effect toward greater values of Reynolds number caused by polymer-surfactant additives.
HYPOTHETICAL MECHANISM OF DRAG REDUCTION CAUSED BY POLYMER-MICELLAR SURFACTANT ADDITIVES
The Effect of Surfactant and High Molecular Weight Polymer Addition on Pressure Drop Reduction in Pipeflow 941
Brazilian Journal of Chemical Engineering Vol. 33, No. 04, pp. 933 - 943, October - December, 2016
compared to the CMC (Hou et al., 1999; Matras et al., 2008). This concentration is called the critical aggregation concentration (CAC).
In the case of an ionic surfactant mixed with a non-ionic or oppositely-charged polyelectrolyte, only a small part of the polyelectrolyte is absorbed by the surfaces of the micelles. Furthermore, the CAC has a lower magnitude than the original CMC due to the following facts:
electrostatic interaction occurs between the polyelectrolyte and the surface of the micelles,
hydrophobic interaction occurs between the non-ionic polymer and non-ionic micelles,
surfactant counter-ions on the micelles surface are replaced by the electrolyte or polyelectrolyte,
highly charged electrolytes can provide a certain amount of concentrated counter-ions that combine with the micelles.
As a result of electrostatic or hydrophobic in-teraction, the micelles combine with the polymer chains by coiling around them. The final state of the mixture has single threadlike micelles with a part of the polymer macromolecule chain coiled around rigid micelles. According to Hou et al. (1999), Matras et al. (2008) and Jung et al. (2011), these form the so-called aggregates.
Such newly created polymer-micellar solutions can be characterized by a lower susceptibility to me-chanical degradation during flow or the degradation can be almost invisible in the analysed range of flow.
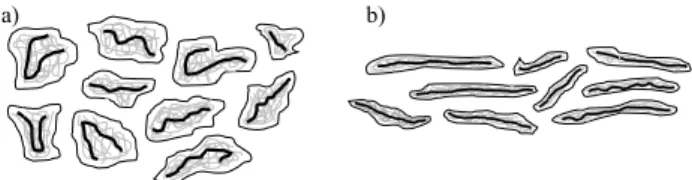
Aggregates, schematically illustrated in Figure 12(a), subjected to the shear stress, take an orienta-tion consistent with the aforemenorienta-tioned principle of minimum resistance – Figure 12(b). With the in-creasing value of the Reynolds number, internal friction forces stretch and extend the aggregates, leading to the laminarization of the initial phase of the turbulent flow.
Therefore, it can be hypothesized that the rigid rodlike micelles, which create the core of the agggates, are responsible for reducing the flow re-sistance in the extended transitional zone between the laminar and the turbulent flow.
Figure 12: Polymer-micellar aggregate: a) in the shape of spherical structures, b) elongated during shear stress action.
The aggregates and micelles are responsible for transmission of internal friction within the liquid. The value of the critical Reynolds number for which the transition to the turbulent zone is observed is greater for polymer-micellar solutions. This means that the stable transition zone is extended. The rea-son for such behaviour can be the partial disintegra-tion of aggregates to their original forms, i.e., mi-celles (formed from the surfactant) and macromole-cules (formed from the polymer) due to a significant increase of the shear rate. From this moment, both micelles and macromolecules interact separately in the transported solution, causing a further drag reduction effect. Passing further into the turbulent range of flow, micelles lose their orientation and no longer have a major impact on the drag reduction. A key role is played in this zone by the polymer. Not having undergone an earlier degradation, the poly-mer macromolecules still cause the flow reduction.
In drag reduction caused by the use of polymer-surfactant solution, one cannot talk about the so-called collapse of the drag reduction. It occurs over a wide range of Reynolds numbers. In the turbulent zone, polymer macromolecules undergo a certain mechanical degradation. Decreasing the shear rate leads to the reconstruction of the internal structure of the solution. As a result of electrostatic or hydropho-bic interaction, the recreated micelles are combined with the polymer chains by coiling around them. These chains are much shorter and such newly created aggregates do not have the same rheological properties as the original ones. This results in a slight increase of the flow resistance in comparison with a freshly prepared solution.
CONCLUSIONS
A comparative analysis of the drag reduction effi-ciency produced by pure high molecular polymers, pure surfactants and surfactants with high molecular weight polymer additives indicates that the simul-taneous addition of surfactants together with high molecular polymers causes an increase of flow re-sistance in the laminar range of flow compared to the analogous flow of pure solvent. In the case of the turbulent flow, simultaneous application of the ex-amined chemical additives produces a drag reduction effect. It produces, however, a significant extension of the stable transitional zone between the laminar flow and the turbulent flow. The surfactant with salt additives has the major influence on efficiency of drag reduction in this zone.
Experimental results prove that the simultaneous addition of surfactants and high molecular weight polymers leads to the occurrence of a third signifi-cantly extended drag reduction zone in the turbulent range of flow. The dominant factors in that zone are the viscoelastic characteristics of the solution caused by the presence of polymer macromolecules, wherein an increase of the mass fraction of polymer additive increases the efficiency of the drag reduction effect only in the turbulent range of flow.
Comparative studies demonstrated that the ana-lysed polymer-micellar solutions combine and intensify positive features of their purely polymer or purely micellar analogues providing a more efficient drag reduction effect over a wider range of flow.
A hypothetic mechanism for the drag reduction effect caused by polymer-micellar solutions is pro-posed. Experimental results for the drag reduction effect are consistent in qualitative terms with the pro-posed hypothesis and confirm the described mecha-nism of the phenomenon in an indirect way.
REFERENCES
Borostow, W., Drag reduction in flow: Review of applications, mechanism and prediction. Journal of Industrial and Engineiring Chemistry, 14, 409-416, (2008).
Cai, S.-P., Drag reduction of a cationic surfactant solution and its shear stress relaxation. Journal of Hydrodynamics, 24(2), 202-206 (2012).
Diamant, H. and Andelman, D., Onset of self-assembly in polymer-surfactant systems. Euro-physics Letters, 48(2), 170-176 (1999).
Dujmovich, T. and Gallegos, A., Drag reducers improve throughput, cut costs. Offshore, 65(12), pp. 55-58 (2005).
Figueredo, C. R. and Sabadini, E., Firefighting foam stability: The effect of the drag reducer poly(ethylene) oxide. Colloids and Surfaces, A: Physicochemical and Engineering Aspects, 215(1-3), 77-86 (2003).
Goddard, E. D. and Ananthapadmanabhan, K. P., Interactions of Surfactants with Polymers and Proteins. CRC Press, Boca Raton, FL (1993). Hou, Z., Li, Z. and Wang, H., Interaction between
poly(ethylene oxide) and sodium dodecyl sul-fonate as studied by surface tension, conductivity, viscosity, electron spin resonance and nuclear magnetic resonance. Colloid Polym. Sci., 277, 1011-1018 (1999).
Hadri, F., Besq, A., Guillou, S. and Makhloufi, R., Drag reduction with an aqueous solution of
CTAC-NaSal: Study of the wall slip with a Couette geometry. Comptes Rendus Mécanique, 338(3), 152-157 (2010).
Kim, C. A., Jo, D. S., Choi, H. J., Kim, C. B., Jhon, M. S., A high-precision rotating disk apparatus for drag reduction characterization. Polymer Testing, 20, 43-48 (2001).
Kim, J. T., Kim, C. A., Zhang, K., Jang, C. H. and Choi, H. J., Effect of polymer–surfactant interac-tion on its turbulent drag reducinterac-tion. Colloids and Surfaces A: Physicochemical and Engineering Aspects, 391(1-3), 125-129 (2011).
Jönsson, B., Lindman, B., Holmberg, K. and Kronberg, B., Surfactants and Polymers in Aque-ous Solution. John Wiley & Sons Chichester, UK (1998).
Liberatore, M. W., Baik, S., Mchugh, A. J. and Hanratty, T. J., Turbulent drag reduction of poly-acrylamide solutions: Effect of degradation on molecular weight distribution. J. Non-Newtonian Fluid Mech., 123, 175-183 (2004).
Matras, Z., Przepływ cieczu Tomsa w przewodach kołowych. Politechnika Krakowska, Monografia 29 (1984). (In Polish).
Matras, Z. and Walczak, S., The capillary-pipe rhe-ometer for the identification of complex properties of multiphase non-Newtonian fluids. Inżynieria i Aparatura Chemiczna, 6, 150-151 (2006).
Matras, Z., Malcher, T. and Gzyl-Malcher, B., The influence of polymer-surfactant aggregates on drag reduction. Thin Solids Films, 516, 8848-8851 (2008).
Minatti, E., Zanette, D., Salt effects on the interac-tion of poly(ethylene oxide) and sodium dodecyl sulfate measured by conductivity. Colloids Sur-faces, A: Phisicochem. Eng. Aspects, 113, 237 (1996).
Mohsenipour, A. A., Pal, R. and Prajapati, K., Effect of cationic surfactant addition on the drag reduction behaviour of anionic polymer solutions. The Canadian Journal of Chemical Engineering, 91(1), 181-189 (2013).
Motier, J. F., Chou, L. C. and Kommareddi, N. S., Commercial drag reduction: Past, present, and fu-ture. Proceedings of the ASME Fluids Engineer-ing Division Summer MeetEngineer-ing, San Diego, Calif., USA (1996).
Suksamranchit, S., Sirivat, A. and Jamieson, A. M., Polymer–surfactant complex formation and its effect on turbulent wall shear stress. Journal of Colloid and Interface Science, 294(1), 212-221 (2006).
The Effect of Surfactant and High Molecular Weight Polymer Addition on Pressure Drop Reduction in Pipeflow 943
Brazilian Journal of Chemical Engineering Vol. 33, No. 04, pp. 933 - 943, October - December, 2016
solutions. Physics of Fluids, 22(5), 055102 (2010). Virk, P. S., Drag reduction fundamentals. AIChE
Journal, 21(4), 625-656 (1975).
Wang, Y., Yu, B., Zakin, J. L. and Shi, H., Review on drag reduction and its heat transfer by additives. Advances in Mechanical Engineering, 10, 17 pages (2011).
Warholic, M. D., Heist, D. K., Katcher, M. and Hanratty, T. J., A study with particle- image ve-locimetry of the influence of drag-reducing
polymers on the structure of turbulence. Exp. Fluids, 31, 474-483 (2001).
White, C. M. and Mungal, M. G., Mechanics and predictions of turbulent drag reduction with poly-mer additives. Annular Review of Fluid Mechan-ics, 40, 235-256 (2008).