ISSN 0104-6632 Printed in Brazil
www.abeq.org.br/bjche
Vol. 26, No. 03, pp. 555 - 561, July - September, 2009
Brazilian Journal
of Chemical
Engineering
SYNTHESIS OF MESOPOROUS TITANIA IN
RUTILE PHASE WITH PORE-STABLE
STRUCTURE
J. G. dos Santos
1, T. Ogasawara
2and R. A. Corrêa
1*1Instituto de Engenharia Nuclear, DIQN/SETEQ, Comissão Nacional de Energia Nuclear, Phone: + (55) (21) 2173-3700, Fax: + (55) (21) 2590-2692, Cx P 68550, CEP: 21941-972,
Cidade Universitária, Ilha do Fundão, Rio de Janeiro - RJ, Brasil. E-mail: [email protected]
2Universidade Federal do Rio de Janeiro, Centro de Tecnologia, COPPE/PEMM, Rio de Janeiro - RJ, Brasil.
(Submitted: August 19, 2008 ; Revised: December 5, 2008 ; Accepted: January 22, 2009)
Abstract - Metastable-to-stable transformation in oxides is always associated with drastic reduction in surface
area and/or porosity. Therefore, all earlier efforts to stabilize the pore structure of oxides undergoing a metastable-to-stable phase transformation are interesting for both scientific and technological concerns. This work presents a new experimental technique for catalytic oxide production through sonication in acid solution for attainment of the anatase-rutile transformation. Mesoporous structure of titania and surface area were stabilized in the rutile phase after calcinations at 430 and 730oC. Analysis by scanning electron microscopy
(SEM) and nitrogen isotherms showed that the mesoporous structure was preserved after calcinations. After the sonication of titania for 32 hours, rutile phase was obtained at 730oC and still kept a surface area of
28m2/g. When sonicated for 64 h, rutile was obtained at 430oC, still preserving an area of 52m2/g.
Keywords: Titania; Rutile; Mesoporous; Sonication
INTRODUCTION
Synthetic titanium dioxide can be used in a diversity of applications, as pigment or support for catalysts. Filters, ceramics, paper industry, feeding, cosmetics and staple fibers are some of the wide variety of commercial applications for TiO2. Titania
exists in three basic crystalline phases: rutile, anatase (which are commercially produced) and brookite. Each structure shows different physical properties, such as refractive index and chemical and photochemical reactivity. Each application usually requires specific crystalline structure and size of the primary particle.
New processes for synthesis of titania have been investigated to obtain nanoparticles of TiO2 with
properties specific to these different applications. Ultrasound has become an important tool in nanocrystalline synthesis. It has shown very rapid growth in its application to materials science due to its unique reaction effects (Yang et al., 2003). Recently, use of cavitation in the synthesis process has yielded smaller particle size for a variety of oxides.
strongly influence catalytic activity. For example, the rutile phase is very efficient for the catalysis of decomposition of H2S; however, the anatase phase is
more effective in many other catalytic processes (Zhang, and Reller, 2003).
Thermal stability of mesoporous structures is a critical parameter for application of catalysts. The mesoporous TiO2, presents better performance as
catalyst, due to easier accessibility of bigger molecules to the internal canals.
EXPERIMENTAL
The hydrated titanium dioxide used in this work was obtained by the hydrometallurgical route after leaching of ilmenite and the resulting solution purified by solvent extraction (Cunha and Silva, 2007).
Three TiO2 powders of hydrated titanium dioxide
were used in these studies: i) sample A – hydrated titanium dioxide obtained by slow addition of the precipitation agent (Ammonium hydroxide); ii) sample B – hydrated titanium dioxide obtained by the fast addition of the precipitation agent (Ammonium hydroxide); iii) sample C – hydrated titanium dioxide obtained from titanium sulfate solution by fast addition of the precipitation agent (Ammonium hydroxide).
Sample A was calcined at 600, 700, 800, 940, 970, and 980oC with different process times in order
to study the temperature of anatase-rutile transformation. X-ray diffraction (XRD) and surface area analysis were performed before and after calcinations at different temperatures. XRD patterns were obtained in a Rigaku Miniflex Model device.
Measurements of surface area were done using the BET method in a Micrometirics GEMINI 2375 equipment. SEM for morphologic analysis was performed with a ZEISS MODEL DMS 950. Before the calcinations, amorphous titanium hydroxide was also submitted to a previous sonication with a high intensity ultrasonic field in acid solution with different periods and concentrations. The equipment used for sonication was an ultrasonic bath (THORNTON - INPEC ELETRÔNICA S.A. Model 12D, 8 L, 900W and frequency of 25kHz).
RESULTS AND DISCUSSION
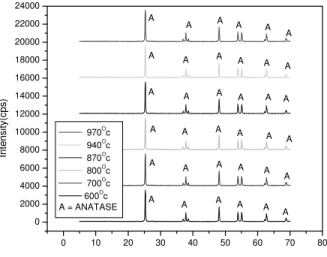
To elucidate the accurate temperature of anatase-rutile transformation, tests of calcinations were carried out at 600, 700, 800, 870, 940 and 970oC for
3 hours and at 980oC for 4 hours. The results show
that no anatase-rutile transformation was detected for 3 h of calcinations at 970oC (Figure 1). The Figure 2
shows the XRD patterns obtained for calcinations at 980oC, considering different periods.
The XRD patterns show that the rutile phase starts to form only at 980oC. After 4 hours, rutile is
the unique phase present.
Figure 3 shows the variation of surface area with the temperature of calcinations for the two powders (sample A and B). Sample B shows a larger value of surface area due to faster precipitation. The results of Figure 3 show that surface area decreases inversely with the temperature of calcinations. For rutile conversion, surface area falls drastically to values lower than unity despite the initial value of surface area.
0 10 20 30 40 50 60 70 80 0
2000 4000 6000 8000 10000 12000 14000 16000 18000 20000 22000 24000
A A
A A
A A
A A
A A A A A A A
A A A A A
A A A A A
A A A A A
970O
c 940Oc 870O
c 800O
c 700Oc 600O
c A = ANATASE
A A A A A A
In
te
n
s
it
y
(c
p
s
)
2 θo
0 10 20 30 40 50 60 70 80 0
2000 4000 6000 8000 10000 12000 14000 16000 18000 20000 22000
F E D C B
R A
R
R A
A R A
R R
R A A A A A
A A
R R
R R R R R
R R
R R
R
R
A A A A A A
R
R = RUTILE A = ANATASE
In
tens
it
y
(cps)
2 θo
Figure 2: XRD patterns of TiO2. Calcinations at 980oC. 4h (B), 3h(C), 2h (D), 1h (E) and 0.5 hours (F)
0 200 400 600 800 1000 0
10 20 30 40 50 60 70 80 90 100 110
Calcination Temperature (0C)
s
pec
if
ic
ar
ea (m
2 /g
)
sample A sample B
Figure 3: BET surface area vs. calcination temperature of hydrated TiO2 without sonication.
Figures 4 and 5 illustrate clearly the influence of sonication treatment on the anatase-rutile kinetic transformation and surface area, respectively. The amount of each crystalline phase in any titania sample can be quantified from diffraction experiments. The phase content of rutile and anatase in the sample were calculated by choosing the most intense anatase and rutile peaks and observing the ratio between them as in the method used by Spurr and Mayers (1957).
While material that had not been treated was completely converted to rutile only near 1000oC,
materials submitted to sonication treatment had their texture, porosity, reactivity and surface morphology changed, and the transformation temperature
occurred at lower values.
Figure 6 shows adsorption isotherms of nitrogen for TiO2 powders that were submitted to sonication
treatment for 64 h or 32h and one with no treatment. Hysteresis loop was observed for all samples sonicated, suggesting that the structure of mesopores remained preserved.
Nitrogen adsorption isotherms of TiO2, sonicated
for 64 h and calcined at 670, 640 and 430oC and
0 100 200 300 400 500 600 700 800 900 1000 0
10 20 30 40 50 60 70 80 90 100 110
Ru
ti
le
con
ten
t (%
)
Calcination temperature (0C)
US HCl 64h US HCl 32h US HNO3 32h US HCl 25h * US HCl 14h US HNO314h US H2O 32h No treatment
Figure 4: Rutile content vs. calcination temperature. 0, 14, 32 and 64 hours of sonication (US). Solvents: HNO3 , HCl and water. Sulphate process (*).
0 200 400 600 800 1000 0
10 20 30 40 50 60 70 80 90 100
100% Rutile
Calcination temperature (0C)
Speci
fic area
(m
2 /g
)
US 64h HCl 0,5M US 32h HCl 1M
US 32h HNO3 1M
US 32h H
2O
no sonication
Figure 5: Variation of surface area with calcination temperature for hydrated TiO2 (sample A)
with and without sonication treatment (US).
0,0 0,2 0,4 0,6 0,8 1,0 0
20 40 60 80 100 120 140
A
d
so
rbe
d
v
o
lu
me
(cm
³/g STP)
Relative Pressure (P/P0) US treatment (h)
adsorption 0 desorption
adsorption 32 desorption
adsorption 64 desorption
0.0 0.2 0.4 0.6 0.8 1.0
0,0 0,2 0,4 0,6 0,8 1,0 0
20 40 60 80 100 120 140
A
d
so
rbe
d
v
o
lu
me
(cm
³/g STP)
Relative Pressure (P/P0) US treatment (h)
adsorption 0 desorption
adsorption 32 desorption
adsorption 64 desorption
0.0 0.2 0.4 0.6 0.8 1.0
0.0 0.2 0.4 0.6 0.8 1.0
0,0 0,2 0,4 0,6 0,8 1,0 0
20 40 60 80 100 120 140 160
Adsor
bed Volum
e
(cm³/g S
T
P)
Relative Pressure (P/P0)
Calcination Temperature (o
C)
adsorption 670 desorption
adsorption 640 desorption
adsorption 430 desorption
0.0 0.2 0.4 0.6 0.8 1.0
0,0 0,2 0,4 0,6 0,8 1,0 0
20 40 60 80 100 120 140 160
Adsor
bed Volum
e
(cm³/g S
T
P)
Relative Pressure (P/P0)
Calcination Temperature (o
C)
adsorption 670 desorption
adsorption 640 desorption
adsorption 430 desorption
0.0 0.2 0.4 0.6 0.8 1.0
0.0 0.2 0.4 0.6 0.8 1.0
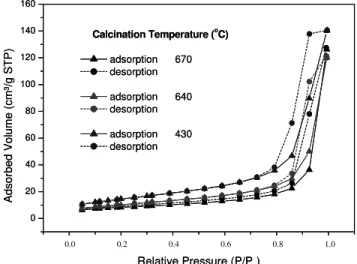
Figure 7: Adsorptions isotherms of titania (sample A) with US treatment.64 hours. Influence of calcination temperature. All the powders were in rutile phase.
Figure 8: Powder micrograph. Calcination at
980oC. Rutile crystalline structure (x 3000). Figure 9:HCl 0.5M, calcination at 730 SEM. Sonicated powder (rutile) for 32 h, oC. (x 3000).
A micrograph of TiO2 powder calcined at 980oC
for 3 hours is shown on Figure 8. Some prismatic crystals, grown simultaneously to the phase transition, are observed. The micrograph of Figure 9 shows the hydrated TiO2 sonicated for 32 hours in 1M HCl and calcined at 730oC. The images of
Figures 8 and 9 must be compared. Both of them were converted to rutile phase. However, Figure 9 shows a sample that was treated with ultrasound in acid medium. In this case, the rutile phase was obtained at 730oC while the sample of Figure 8 was
obtained at 980oC. Rutile phase is in fact present in
both samples. In spite of this, morphologic aspects, surface area and porosity are completely different, suggesting that this treatment is responsible for its transformation, as confirmed by BET surface area (28 m²/g).
Highly porous structures, with high concentration of defects, favor diffusion in the solid state, the most important mode by which transformation occurs during calcinations. Primary particle size derived from the sonication technique ranged between 13 – 18 nm, thus greater than those obtained by the sol-gel route, which yields particles suitable for fast transformations at 600oC
(Yanagisawa and Ovenstone, 1999). Nevertheless, the high density of surface defects generated by sonication, in turn, plays a key role in increasing the kinetics and decreasing the transition temperature, in agreement with the work of Gribb and Banfield (1997).
transformation. The material with no treatment reached complete conversion to rutile around 1000oC
(Figure 2), while materials submitted to sonication treatment for 14 h exhibited complete conversion to rutile around 900oC. Materials submitted to
treatment for 32 h and calcined at 730oC were
converted 100% to the rutile phase (Figure 4). Materials sonicated for 64 h, in turn, were partially converted to rutile phase at ambient temperature and reached complete conversion after calcination at 430oC and still kept surface area as high as 52m2/g
(Figure 4 and 5).
Treatment with a sonorous field of high energy modified the texture of particles, surface morphology, and porosity, besides creating a high concentration of defects on the surface of particles. These effects favor the process of diffusion in the solid, which is the main mechanism involved in phase transformations in the solid state. The main goal when preparing catalytic oxides is obtaining a metastable material with as many defects as possible on its surface. The technique of sonication offers an alternative route to the production of crystals at low temperatures (without calcinations) and with high catalytic activity, as the formation of defects and preferential small sites is favored.
It was observed that titanium dioxide had its transition phase kinetics increased. Important practical consequence then result, as it allows transformation from anatase into rutile to be controlled, by varying the intensity of the treatment applied. This also enables preparation of TiO2 for a
number of other applications: membranes for processes of liquid separation and photocatalysts for organics degradation.
Adsorption isotherms type IV with hysteresis loop type H3, frequently found in processes involving pure solids with mesoporous structure such as inorganic and xerogel oxides, are similar to those shown in Figure 6-7, which represent the processes for TiO2 sonicated for 64 h and converted to rutile at
low temperatures. The volume of pores of the sonicated TiO2 and rutile obtained at low
temperatures was always larger than the original ones (amorphous or anatase). This favors the feasibility of a transition from metastable phase to steady state with no collapse of pore structure. On the other hand, TiO2 in the rutile phase, obtained
from calcinations at higher temperatures (without treatment with ultrasound), did not present isotherms with a clearly developed hysteresis loop, suggesting that a macroporous system may be predominant and no mesopore volume can be calculated (Greg and Sing, 1982 ; Sing, 1985).
Kumar et al. (1998) tried to stabilize the porous structure of titania by adding tin oxide particles to a pure titania matrix. Actually, tin oxide speeds up the anatase-rutile transformation by offering a similar crystallographic surface (crystalline structure of the SnO2 is tetragonal as is rutile). This reduces the
required surface energy for transformation; however, the best result obtained was to stabilize a porous structure with a specific surface of 16m2/g, for a
conversion of 70% to rutile at 750oC. Conversion to
100% rutile was only reached at 800 oC and the
specific surface in this condition was 8m2/g,
representing almost total collapse of the porous structure. Kumar et al. referred to these results as a great success in stabilization of the structure of the pores of the titania. In this work, the biggest value of stabilization of the porous structure of titania 100% rutile phase was reached after sonication treatment for 64h in solution of 0.5M HCl and calcination at 430oC. In this situation rutile kept a high surface area
of 52m2/g, indicating the importance of this result as
a great scientific and technological contribution. Thus, ceramic membranes in the rutile phase could be used without collapse of the pore structure, while membranes of anatase used at high temperatures near that of the anatase-rutile transition.
Complete transformation into rutile, fast growth of grains and elimination of the porosity occur almost simultaneously. Near the transition, for materials whose transformations occur at high temperatures, particles reach remarkable growth and reduction of surface area is also considerable. The main reason for this drastic reduction of porosity and surface area is that primary particles inside a porous metastable system may grow or have density increased, or undergo both phenomena to reduce the demands of surface energy for formation of a new phase. During transformation of phase, atoms are very mobile because of rupture of links and an increase in sintering is expected near this temperature.
CONCLUSION
surface area, suggesting thermal stability of the porous structure. The method offers an alternative route to reduce the phase transition temperature of metastable system by increasing the diffusion rate, probably due to creation of defects and increase of the density of active sites.
ACKNOWLEDGEMENTS
This work was supported by the Instituto de Engenharia Nuclear (IEN/CNEN) and the Universidade Federal do Rio de Janeiro PEQ/COPPE/UFRJ, Brazilian Federal Government Institutions.
REFERENCES
Braun J. H., Titanium Dioxide – A Review, J. Coating Technology, Vol. 69 n. 868, May (1997). Cunha, J. W. S. D. and Silva, G. R. W., Processo
para obtenção de óxido de titânio de alta pureza por extração líquido-líquido a partir do minério de anatásio,. PI 0705592-7 (2007).
Greg, S. J. and Sing, K. S. W., Adsorption, Surface and Porosity, Second Edition, Academic Press, (1982).
Gribb, A. A. and Banfield, J. F., Particle size effects on transformation kinetics and phase stability in nanocrystalline TiO2, American Mineralogist, 82, pp. 717-728 (1997).
Kumar, K. N. P., Keizer, K. and Burggraaff, A. J., Pore-Structure Stability of Nanostructured Rutile Titania Containing a Structure Directing Second Phase Stabilizer, Materials Research Bulletin, Vol. 33 N/10, pp. 1495-1502 (1998).
Sing, K. S. W., Everett, D. H., Haul, R. A. W., Pierotti, R. A., Rouquérol, J. and Siemieniewska, T. Reporting Physisorption Data for Gas/Solid Systems with Special Reference to Determination of Surface Area and Porosity, Pure Applied Chemistry, 57, pp. 603-619 (1985).
Spurr, R. A. and Myers, H., Quantitative Analysis of Anatase-Rutile mixtures with an X-ray Diffractometer, Anal. Chem., Vol. 29, N 5, pp. 760-762 (1957).
Yanagisawa, K. and Ovenstone, J., Crystallization of Anatase from Amorphous Titania Using the Hydrothermal Technique: Effects of Starting Material and Temperature, J. Phys. B (103), pp. 7781-7787 (1999).
Yang, K., Zhu, J., Zhu, J., Huang, S., Zhu, X. and Ma, G., Sonochemical synthesis and microstructure investigation of rod-like nanocrystalline rutile titania, Materials Letters, 57, 30, December, pp. 4639-4642 (2003).
Zhang, Y. H. and Reller, A., Investigation of mesoporous and microporous nanocrystalline silicon doped titania, Materials Letters, 57, pp.4108-4113 (2003).