ISSN 0104-6632 Printed in Brazil
www.abeq.org.br/bjche
Vol. 26, No. 03, pp. 469 - 480, July - September, 2009
Brazilian Journal
of Chemical
Engineering
EFFECT OF THERMAL TREATMENT OF
ANAEROBIC SLUDGE ON THE BIOAVAILABILITY
AND BIODEGRADABILITY CHARACTERISTICS
OF THE ORGANIC FRACTION
E. S. M. Borges
1and C. A. L. Chernicharo
2*1Escola Agrotécnica Federal de Barbacena, Phone: + (55) (32) 3331-9131, + (55) (32) 9946-9131,
Fax: + (55) (32) 3693-8639, Rua Monsenhor José Augusto 204, CEP: 36205-018, Barbacena - MG, Brasil. E-mail: [email protected]
2
Universidade Federal de Minas Gerais, Departamento de Engenharia Sanitária e Ambiental, Programa de Pós-graduação em Saneamento, Meio Ambiente e Recursos Hídricos,
Av. do Contorno 842/701, CEP: 30110-060, - Belo Horizonte - MG, Brasil. E-mail: [email protected]
(Submitted: July 30, 2008 ; Revised: November 18, 2008 ; Accepted: November 24, 2008)
Abstract - Most works reported in the literature focus on thermal treatment of waste activated sludge at
temperatures in the range of 160 to 180oC. This research aimed at evaluating the thermal treatment of excess
anaerobic sludge at much lower temperatures, using biogas generated in the wastewater treatment process as the energy source for heating a simplified thermal reactor. Direct burning of the biogas allowed an increase in the sludge temperature up to values close to 75oC, for a 7-hour heating period. Sludge samples taken at different heating times showed that the thermal disintegration of the organic fraction allowed increases in the concentration of protein, carbohydrate, lipid and COD parameters by 30 to 35 times, as well as a 50% increase in the biogas production. Moreover, the simplified thermal treatment system proved to be an effective alternative for recovering energy from biogas and for controlling methane emissions to the atmosphere.
Keywords: Anaerobic sludge; Bioavailability; Biodegradability; Biogas; Thermal treatment; UASB reactor.
INTRODUCTION
Although UASB reactors are considered to be a mature technology for the treatment of domestic wastewater in warm climate regions, some design and operational limitations are still present and should be addressed in order to enhance reactor performance. One limitation is related to the presence of poorly biodegradable suspended solids in the influent and, therefore, mechanisms for improving its digestion should be considered. Suspended solids correspond to around 50% of the total chemical oxygen demand (COD) of the
wastewater, making hydrolysis the limiting step of the anaerobic digestion process (Foresti et al., 2006). According to Metcalf & Eddy (1991), an average of 70% of the solids present in typical domestic wastewaters are of organic origin, out of which approximately 40 to 60% are protein compounds, 25 to 50% are carbohydrates and approximately 10% are fats and oils. Lower amounts of urea, surfactants, phenols, pesticides and others can also be found.
microorganisms cooperate sequentially in order to achieve degradation of a variety of polymeric and monomeric substrates. Digestion is initiated by the secretion of enzymes by facultative and obligate fermentative bacteria, facilitating the hydrolysis of the initial proteins and polysaccharides, including suspended organics present in domestic sewage, to monomeric sugars, amino acids, long chain fatty acids and alcohols (O’Flaherty et al., 2006). According to Batstone et al. (2002), hydrolysis can be represented by two conceptual models: i) the organisms secrete enzymes to the bulk liquid where they are adsorbed onto a particle or react with a soluble substrate (Jain et al., 1992); and ii) the organisms attach to a particle, produce enzymes in its vicinity and benefit from soluble products released by the enzymatic reaction (Vavilin et al., 1996).
In order to accelerate the solubilization of the particulate organic matter, biological, chemical, physical and mechanical methods can be used, such as anaerobic digestion, aerobic digestion, thermal-chemical treatment (in either basic or acid medium), thermal treatment, ozonization (Rocher et al., 1999), ultrasound, high pressure homogenizers, ball mills (Muller, 2001), humid oxidation, centrifugation (Kepp & Solheim, 2001) and chemical treatment
(Deleris et al., 2001), among others.
Thermal treatments were first applied to sludge to improve its dewaterability (Neyens & Baeyens, 2003), but most works deal with the effect of sludge thermal treatments on biogas production enhancement during anaerobic digestion, as summarized in Table 1. Most of the studies reported an optimal temperature in the range from 160 to 180oC and treatment times from 30 to 60 min, while thermal treatment at moderate temperature (70oC) lasted from hours to several days (Gavala et al., 2003; Ferrer et al., 2008; Lu et al., 2008). Treatments at temperatures of 70oC or 121oC led to a 20 to 48% biogas production increase and treatments at 160–180oC led to a 40 to 100% biogas production increase. The 160–180oC pre-treatments are thus most efficient to enhance sludge anaerobic digestion, but they also lead to more dispersed results in terms of biogas production (Bougrier et al., 2008). Moreover, sludge treatments at higher temperatures lead to higher investments and are largely mechanized. Thus, in order to employ these treatment principles, it is necessary to search for technologies that are suitable for the reality of developing countries, so that the sludge issue can be dealt with appropriately in these locations.
Table 1: Impact of thermal pre-treatments on primary sludge and waste activated sludge mesophilic anaerobic digestion
Reference Thermal
treatment Anaerobic digestion Results
Haug et al. (1978) 175°C, 30 min CSTR, HRT = 15 d Increase of CH4 production from 115 to 186
ml/g CODin (+62%)
Stuckley and McCarty (1978) 175°C, 60 min Batch, 25 d Increase of convertibility of COD to CH4 from
48 to 68% (+42%)
Li and Noike (1992) 175°C, 60 min CSTR HRT = 5 d Increase of gas production from 108 to 216
ml/g CODin (+100%)
Tanaka et al. (1997) 180°C, 60 min Batch, 8 d Increase of methane production (+90%)
Fjordside (2001) 160°C CSTR, 15 d Increase of biogas production (+60%)
Gavala et al. (2003) 70°C, 7 d Batch Increase of CH4 production from 8.30 to10.45
mmol/g VSin (+26%)
Barjenbruch & Kopplow
(2003) 121°C, 60 min CSTR, 20 d
Increase of biogas production from 350 to 420 ml/g VSSin (+20%)
Kim et al. (2003) 121°C, 30 min Batch, 7 d Increase of biogas production from 3657 to 4843 l/m3 WASin (+32%)
Dohanyos et al. (2004) 170°C, 60 s Batch, 20 d Thermophilic Increase of biogas production (+49%)
Valo et al. (2004) 170°C, 60 min Batch, 24 d Increase of biogas production (+45%)
Valo et al. (2004) 170°C, 60 min CSTR, 20 d Increase of CH4 production from 88 to 142
ml/g CODin (+61%)
Graja et al. (2005) 175°C, 40 min Fixed film reactor,
HRT = 2.9 d 65% reduction of TSS
Bougrier et al. (2006a) 170°C, 30 min Batch, 24 d Increase of CH4 production from 221 to 333
ml/g CODin (+76%)
Bougrier et al. (2006b) 170°C, 30 min CSTR, 20 d Increase of CH4 production from 145 to 256
ml/g VSin (+51%)
Ferrer et al. (2008) 70°C, 9 h Batch, 10 d Increase of biogas production (+30%)
Within this context, according to Mulder (2001), the global methane emission is estimated at 500 million tons a year and anaerobic wastewater treatment systems contribute to approximately 5% of this total, that is, about 25 million tons. Therefore, besides being strictly necessary to reduce the environmental impacts resulting from methane, whose impact is approximately twenty times higher than that of the carbon dioxide regarding the contribution to the increased greenhouse effect (Evans, 2001; IPCC, 2001), the burning of biogas can quickly reintegrate carbon into its natural cycle, thus allowing it to be used as a source of heat energy, little exploited so far.
This way, this paper seeks to evaluate the effect of the thermal treatment of anaerobic sludge on the disintegration of the remaining organic fraction. For that purpose, the increase in the bioavailability and biodegradability characteristics of organic compounds present in the anaerobic sludge was evaluated, employing the biogas generated in UASB reactors as the source of energy for heating of the sludge.
This research differs from the previous ones in various aspects: i) it deals with anaerobic sludge produced in UASB reactors; ii) it investigates the thermal treatment of sludge at much lower temperatures (below 80oC); iii) it uses biogas produced in the wastewater treatment system as the energy source for heating the sludge; iv) it seeks the
development a thermal treatment device that complies with the requirements of developing countries in terms of costs and operational simplicity.
MATERIAL AND METHODS
Experimental Apparatus
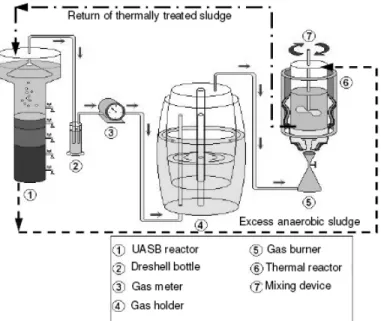
The pilot-scale apparatus consisted of a UASB reactor for domestic sewage treatment (main operational characteristics presented in Table 2), two biogas holders (with total storage capacity of 220 L), and a 5-liter thermal reactor. Table 3 shows the main characteristics of the experimental units, while Figure 1 shows the setup of the experimental apparatus, highlighting the biogas collecting, storage and burning systems, as well as the reactor where sludge was thermally treated.
The UASB reactor was fed with a parcel of the wastewater taken from the main sewer of Belo Horizonte – Brazil, after being submitted to preliminary treatment for sand and coarse solids removal. Each biogas holder unit was constituted of two plastic containers, one partially filled with water in order to work as hydric seal, avoiding gas leakage, and the other as a floating cover to accumulate the biogas. The thermal reactor was placed inside an insulation sleeve in order to reduce heat losses.
Table 2: Main characteristics and operational data of the UASB reactor (average values)
Flow rate (L.h-1)
Operating temperature
(°C)
HDT (h)
Average influent COD
(mg.L-1)
Sludge concentration
(%)
Biogas production
(L.d-1)
Sludge production yield (gTS.gCODapplied
-1
)
74 25 5.6 540 4 200 0.15
Table 3: Main characteristics of the experimental apparatus
UASB reactor
Characteristic Digestion
compartment
Settler
compartment Total
Biogas holder Thermal reactor
Material Polypropylene Fibreglass - Polyethylene Steel
Diameter (m) 0.30 0.30 to 0.50 - 0.50 0.15
Height (m) 3.00 1.00 4.00 0.70 0.30
Useful volume (L) 212 204 416 110 5.0
Operation of the Experimental Units
As biogas is continuously produced but excess sludge is wasted in batches, the produced biogas was stored for further burning at the time of the thermal treatment, at a final pressure between 5.5 and 6.5 cm.w.c, employing the reservatory pressure during the burning process.
The biogas volume stored and used in each test always corresponded to the 24-hour production (on average, approximately 200 L.d-1). The volume of sludge used in each treatment experiment was determined according to the daily solids production in the UASB reactor (approximately 4.0 L.d-1), which was estimated from the sludge yield coefficient (0.15 gTS.gCODapplied-1) and total solids concentration (average of 4.0%). The sludge was removed from the bottom of the UASB reactor and directly fed into the thermal reactor.
During the tests, the sludge was kept under constant mixing, aiming at minimizing the sedimentation of solids and the formation of a temperature gradient along the height of the thermal reactor, once the gas burner was installed under the vessel. In order to avoid mechanical rupture of the sludge particles, mixing intensity was kept at minimum level. Thermal treatment of the sludge was only initiated after homogenization and collection of a first sample. Additional samples were then collected after 1.5, 3.0, 5.0 and 7.0 hours. Only biogas was used as a source of energy and time and temperature were monitored throughout the thermal treatment process. Losses of water during the 7-hour heating period were estimated to be less than 1% of the initial sludge volume treated, because the thermal reactor was kept closed during the whole heating period.
A comparison between "samples collected at
room temperature" and kept under the same stirring conditions and "samples collected after X-hours of thermal treatment" was not carried out, because samples collected at room temperature did not remain under mixing. As pointed out before, the stirring was kept at minimum level (only to avoid particle settling) and, therefore, mechanical rupture or solubilization of particulate material may not have occurred to a considerable degree. Therefore, the effect of agitation during the test period on the solubilization of the particulate matter, regardless of heat treatment, was assumed to be insignificant.
Monitoring Analyses
was also carried out. All tests were performed in duplicate, at the temperature of 30oC, and lasted for 5 days.
Statistical Tests
Statistical tests were applied for the analysis of significance between averages and variances, in order to evaluate the relationship between the changes in the concentrations of the chemical parameters and heating time and temperature variables. The tests applied were the χ2 Test, Student’s t Test, F Test, and Mann-Whitney Test. Analysis of Variance was also performed, which allows one to verify whether a given factor causes changes to a variable of interest.
Mathematical Modeling of the Results
It was noticed from plotted dispersion diagrams that each parameter/heating-time pair adjusted to a first-order reaction, specifically to an equation 1 type curve.
(
)
k xmax max 0
y=y −⎡⎣ y −y ⋅e− ⋅ ⎤⎦ (1)
Because the concentration of the evaluated parameters depended on only two variables, test temperature and time, the results were mathematically modeled by taking into consideration the influence of both these variables, thus resulting in equation 2, presented as follows.
(
)
(T 20)20
k x
max max 0
y=y −⎡⎢ y −y ⋅e− ⋅θ − ⋅ ⎤⎥
⎣ ⎦ (2)
where:
y = concentration of the evaluated parameter (mg.L-1);
ymax= maximum concentration of the evaluated parameter (mg.L-1);
y0 = initial concentration of the evaluated parameter (mg.L-1);
x = heating time (h); T = temperature (oC); k20 = reaction coefficient (h-1);
θ = temperature coefficient.
The non-linear regression was performed employing the Statistica/w 5.1 program for each group of results related to each parameter, with simultaneous determination of the k20 and θ coefficients within a 95% significance level.
RESULTS AND DISCUSSION
Effect of thermal treatment on the bioavailability characteristics
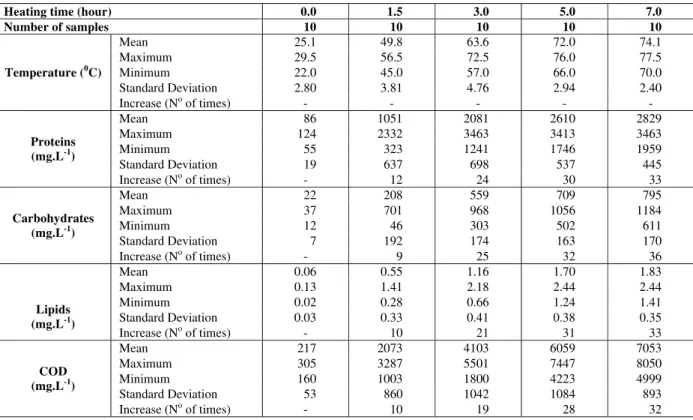
The concentrations achieved for the several parameters evaluated, followed by the heating time and temperature, at the moment at which the sample was collected, are presented in Table 4.
The results show that the concentrations of all parameters considered in the study had a positive variation from the increased heating temperature and time. For all parameters, the average variation was from 32 to 36 times between the sample collected at room temperature and the sample collected after a 7-hour thermal treatment. It is noticed that a higher efficiency was possible in the solubilization of the organic matter present in the thermally-treated sludge as the heating time and temperature were increased, suggesting that such factors have contributed for this material to become more accessible and, therefore, more available to a possible further biological degradation phase.
The differences in concentrations between samples collected at room temperature and samples submitted to thermal treatment were also confirmed by the statistical tests performed, as shown by the results of significance tests carried out for averages and variances presented in Tables 5 and 6.
In addition, the Analysis of Variance confirmed that the heating time variable had an influence on the variation of protein, carbohydrate, lipid and COD concentrations, as shown in Table 7.
An increase in dissolved COD concentration, from approximately 3,000 mg.L-1, at the temperature of 55oC, to approximately 4,000 mg.L-1, at the temperature of 67oC, was also achieved in the thermal treatment experiments conducted by Sorensen et al. (1999). Besides, França (2002) carried out thermal experiments with anaerobic sludge at similar temperatures (lower than 80oC) and observed from optical microscopic analyses (increased 100 times) the rupture of the solid fraction after the thermal treatment, which was also confirmed by the measurement of the average particle size.
Table 4: Descriptive statistics of the protein, carbohydrate, lipid and COD parameters
Heating time (hour) 0.0 1.5 3.0 5.0 7.0
Number of samples 10 10 10 10 10
Mean 25.1 49.8 63.6 72.0 74.1
Maximum 29.5 56.5 72.5 76.0 77.5
Minimum 22.0 45.0 57.0 66.0 70.0
Standard Deviation 2.80 3.81 4.76 2.94 2.40
Temperature (0C)
Increase (No of times) - - - - -
Mean 86 1051 2081 2610 2829
Maximum 124 2332 3463 3413 3463
Minimum 55 323 1241 1746 1959
Standard Deviation 19 637 698 537 445
Proteins (mg.L-1)
Increase (No of times) - 12 24 30 33
Mean 22 208 559 709 795
Maximum 37 701 968 1056 1184
Minimum 12 46 303 502 611
Standard Deviation 7 192 174 163 170
Carbohydrates (mg.L-1)
Increase (No of times) - 9 25 32 36
Mean 0.06 0.55 1.16 1.70 1.83
Maximum 0.13 1.41 2.18 2.44 2.44
Minimum 0.02 0.28 0.66 1.24 1.41
Standard Deviation 0.03 0.33 0.41 0.38 0.35
Lipids (mg.L-1)
Increase (No of times) - 10 21 31 33
Mean 217 2073 4103 6059 7053
Maximum 305 3287 5501 7447 8050
Minimum 160 1003 1800 4223 4999
Standard Deviation 53 860 1042 1084 893
COD (mg.L-1)
Increase (No of times) - 10 19 28 32
Table 5: Summary of significance tests between averages of samples collected at time 0 (T0.0h) and after 7.0 hours of thermal treatment (T7.0h) - (Test t Student)
Parameters Significance level t (calculated) t (table) H0 Conclusion
Proteins (T0.0h – T7.0h) α = 0.05 -18.48 2.1 Reject μ1≠μ2
Carbohydrates (T0.0h - T7.0h) α = 0.05 -13.64 2.1 Reject μ1≠μ2
Lipids (T0.0h – T7.0h) α = 0.05 -15.29 2.1 Reject μ1≠μ2
COD - T0.0h - T7.0h α = 0.05 -22.92 2.1 Reject μ1≠μ2
Table 6: Summary of significance tests between variances of samples collected at time 0 (T0.0h) and after 7.0 hours of thermal treatment (T7.0h) - (Test F)
F (table)
Parameters Significance level F (calculated)
Lower Higher H0 Conclusion
Proteins (T0.0h - T7.0h) α = 0.05 0.0017 0.25 4.03 Reject S12≠ S22
Carbohydrates (T0.0h - T7.0h) α = 0.05 0.0016 0.25 4.03 Reject S12≠ S22
Lipids (T0.0h - T7.0h) α = 0.05 0.0098 0.25 4.03 Reject S12≠ S22
COD (T0.0h – T7.0h) α = 0.05 0.004 0.25 4.03 Reject S12≠ S22
Table 7: Summary of Analysis of Variance (ANOVA)
Dependent variable Indenpendent
variable F (calculated) F (table) H0 Conclusion
Protein concentration Heating time 47.74 2.59 Reject
Carbohydrate concentration Heating time 44.93 2.59 Reject
Lipid concentration Heating time 27.61 2.88 Reject
COD concentration Heating time 103.74 2.59 Reject
Effect of Thermal Treatment on Sludge Biodegradability
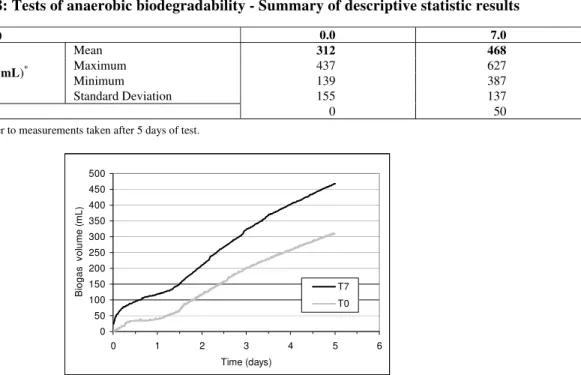
Thermal treatment had a very positive effect on sludge anaerobic biodegradability, as confirmed by the increment in biogas production, which was 50% higher for the sludge samples collected after 7.0 hours of thermal treatment, as compared to samples taken at time zero and therefore not submitted to thermal treatment (Table 8 and Figure 2).
These results are in agreement with those presented in Table 1, where it can be noticed that sludge treatments at temperatures of 70oC or 121oC led to a 20 to 48% increase in biogas production. However, most of the results presented in Table 1 are related to thermal treatment of sludges originated from activated sludge treatment plants (primary, secondary or mixture of primary and secondary sludges), while sludge originated from an UASB reactor treating domestic wastewater was used in the present work.
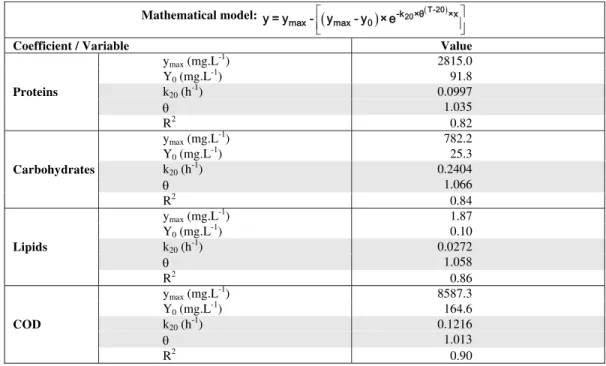
Mathematical Modeling of the Results
The influence of temperature and heating time on the characteristics of the anaerobic sludge submitted to thermal treatment was modeled according to Equation 2. The coefficients and variables obtained from this model are presented in Table 9.
In equations that seek to model first-order reactions, the k coefficient is associated with the organic matter degradation rate. The higher its value,
the higher is the organic matter oxidation rate. In the results analyzed herein, specifically for the protein, carbohydrate, lipid and COD parameters, it is understood that the organic matter bioavailability rate can be analyzed from the k coefficient, present in mathematical equation 2. As can be seem from the k20 coefficient values presented in Table 9, a higher organic matter bioavailability rate is noticed for the carbohydrate parameter. Regarding the determination coefficients (R2) for the referred to parameters, good correlations (varying from 0.82 to 0.90) can be noticed between the variation in their concentration and the heating time and temperature variables.
The temperature coefficient θ, based on the Van’t Hoff-Arrhenius theory, seeks to characterize the influence of temperature on the reaction rate at issue. The higher the θ value, the higher is the influence of temperature on the reaction and, consequently, the higher is the influence of temperature on the bioavailability rates of the organic matter present in the sludge submitted to thermal treatment. As can be noticed from the θ coefficient values presented in Table 9, a higher influence of the temperature variation was also observed for the carbohydrate parameter (θ = 1.066). For the other parameters, the temperature coefficient varied from 1.013 to 1.058, also confirming that the thermal treatment contributed positively to the increased bioavailability of the organic matter present in the sludge being treated.
Table 8: Tests of anaerobic biodegradability - Summary of descriptive statistic results
Heating time (hour) 0.0 7.0
Mean 312 468
Maximum 437 627
Minimum 139 387
Biogas production (mL)*
Standard Deviation 155 137
Variation (%) 0 50
*
Biogas volumes refer to measurements taken after 5 days of test.
0 50 100 150 200 250 300 350 400 450 500
0 1 2 3 4 5 6
Time (days)
B
ioga
s
v
o
lu
m
e
(
m
L)
T7
T0
Table 9: Coefficients and variables obtained for the protein, carbohydrate, lipid and COD parameters, from the mathematical model applied
Mathematical model: ⎡( ) ( ) ⎤
⎢ ⎥
⎣ ⎦
T - 2 0 2 0
- k × θ × x
m a x m a x 0
y = y - y - y × e
Coefficient / Variable Value
ymax (mg.L-1) 2815.0
Y0 (mg.L-1) 91.8
k20 (h-1) 0.0997
θ 1.035
Proteins
R2 0.82
ymax (mg.L-1) 782.2
Y0 (mg.L-1) 25.3
k20 (h-1) 0.2404
θ 1.066
Carbohydrates
R2 0.84
ymax (mg.L-1) 1.87
Y0 (mg.L-1) 0.10
k20 (h-1) 0.0272
θ 1.058
Lipids
R2 0.86
ymax (mg.L-1) 8587.3
Y0 (mg.L-1) 164.6
k20 (h-1) 0.1216
θ 1.013
COD
R2 0.90
k20 and θ coefficients were determined within a 95% significance level
Figures 3 to 10 present adjustment curves for the parameters evaluated, related separately to the heating time and temperature variables. For the evaluated parameter/heating-time pair, the position of the dots was similar to the equation 1 type curve, as previously presented, and the adjustment was then made to this equation model. The position of the dots for the evaluated parameter/heating-temperature pair suggested an exponential curve (y = a.bx; Spiegel, 1993), which shows the model of a curve with a first-order reaction rate, according to equation 3.
( )k x 0
y=y ⋅e ⋅ (3)
The results seem to indicate that the variations in the concentrations are more sensitive to increases in temperature rather than to increases in heating time. A smaller influence of the heating time variable in relation to temperature during the thermal treatment process was also reported by Muller (2001). Bougrier et al. (2008) found a major effect on the solubilization of COD, protein, carbohydrate, protein and of the solid fraction as the temperature was varied from 20oC to 210oC, however for sludge thermal pre-treatment carried out at similar heating time intervals. The use of high temperatures and short heating periods during the thermal hydrolysis
of organic compounds has also been reported by various authors (Haxaire et al., 2000; Schieder et al.,
2000; Weiz et al., 2000; Dohanyos et al., 2004; Graja et al, 2005; Bougrier et al., 2008). On the other hand, works carried out at lower temperatures and extended time periods can be characterized as either mesophilic (30 to 38oC, period of days) or thermophilic (49 to 57oC, period of days) sludge anaerobic digestion, rather than to processes of thermal disintegration of the organic fraction (Metcalf & Eddy, 1991).
These results also allow consideration of the hypothesis that, by continuing to increase the temperature, the higher will be the degree of thermal disintegration of the organic fraction and, consequently, the higher will be the increments in the bioavailability and biodegradability characteristics of the thermally-treated sludge. This is in agreement with works that report the optimal treatment temperature to reach thermal disintegration of organic compounds ranging from 160 to 180oC (Haug et al., 1978; Stuckley and McCarty, 1978; Li and Noike, 1992; Tanaka et al., 1997; Fjordside, 2001; Dohanyos et al., 2004; Valo et al., 2004; Valo et al., 2004; Graja et al., 2005; Bougrier et al., 2006a; Bougrier et al., 2006b; Bougrier et al.,
( ) 0.2972X
Y=3297.26−⎡⎣3297.26 37.54− ×2.718− ⎤⎦ (0.0398X)
Y=147.959 2.718×
time (hours) pr ot ei ns conc. ( m g/ L) 0 500 1000 1500 2000 2500 3000 3500 4000 4500 5000
0 1 2 3 4 5 6 7 8
temperature (oC) pr ot ei ns conc. ( m g/ L) 0 500 1000 1500 2000 2500 3000 3500 4000 4500 5000
0 20 40 60 80 100
Figure 3: Adjustment curve – protein concentration and heating time.
Figure 4: Adjustment curve – protein concentration and heating temperature.
( ) 0.2191X
Y=1042.86−⎣⎡1042.86 4.58− ×2.718− ⎤⎦ Y=17.788 2.718× (0.0515X)
time (hours) car bohydr at es conc. ( m g/ L) 0 150 300 450 600 750 900 1050 1200 1350 1500
0 1 2 3 4 5 6 7 8
temperature (oC) car bohydr at es conc. ( m g/ L) 0 150 300 450 600 750 900 1050 1200 1350 1500
0 20 40 60 80 100
Figure 5: Adjustment curve – carbohydrate concentration and heating time.
Figure 6: Adjustment curve – carbohydrate concentration and heating temperature.
( ) 0.1977X
Y=2.532−⎣⎡2.532 0.011− ×2.718− ⎤⎦ Y=0.043 2.718× (0.0508X)
time (hours) lip id s conc. ( m g/ L) 0,0 0,5 1,0 1,5 2,0 2,5 3,0 3,5 4,0 4,5 5,0 5,5
0 1 2 3 4 5 6 7 8
temperature (oC) lipids conc. (mg/ L) 0,0 0,5 1,0 1,5 2,0 2,5 3,0 3,5 4,0 4,5 5,0 5,5
0 20 40 60 80 100
Figure 7: Adjustment curve – lipid concentration and heating time.
Figure 8: Adjustment curve – lipid concentration and heating temperature.
( ) 0.1511X
Y=10932.6−⎡⎣10932.6 114.8− ×2.718− ⎤⎦ (0.0438X)
Y=256.238 2.718×
time (hours) C O D c onc . ( m g/L) 0 1500 3000 4500 6000 7500 9000 10500 12000 13500 15000
0 1 2 3 4 5 6 7 8
temperature (oC) C O D c onc . ( m g/L) 0 1500 3000 4500 6000 7500 9000 10500 12000 13500 15000
0 20 40 60 80 100
Figure 9: Adjustment curve – COD concentration and heating time.
CONCLUSIONS
The use of the biogas generated in UASB reactors was shown to be a self-sustainable source of energy for the thermal treatment of excess sludge, allowing an increase in the sludge temperature up to values close to 75oC, for 7-hour heating times. These ranges of temperature and heating times were sufficient to promote:
The thermal disintegration of the organic fraction present in the anaerobic sludge submitted to the treatment;
Statistically significant improvements in the bioavailability characteristics of the organic fraction present in the sludge, with the increased bioavailability following a first-order reaction rate; An increase of 30 to 35 times in the concentrations of protein, carbohydrate, lipid and COD, thus characterizing a higher bioavailability of the remaining organic fraction.
An increase of 50 % in the biogas production, thus characterizing a higher biodegradability of the remaining organic fraction.
Overall, the simplified system was very effective for the thermal treatment of the anaerobic sludge produced in the UASB reactor, although it has been achieved at low temperatures and at atmospheric pressure. Furthermore, the system allowed the use of the biogas produced within the treatment plant, being therefore an effective alternative for recovering energy from biogas and for controlling methane emissions to the atmosphere.
ACKNOWLEDGMENTS
The authors wish to acknowledge the support obtained from the following institutions: Conselho Nacional de Desenvolvimento Científico e Tecnológico, CNPq, Coordenação de Aperfeiçoamento de Pessoal de Nível Superior, CAPES, Financiadora de Estudos e Projetos, FINEP, Fundação de Amparo à Pesquisa de Minas Gerais, FAPEMIG.
REFERENCES
Barjenbruch, M., Kopplow, O., Enzymatic, mechanical and thermal pre-treatment of surplus sludge, Adv. Environ. Res., 7 (3), 715-720 (2003).
Batstone, D. J., Keller, J., Angelidaki, I., Kalyuzhnyi, S. V., Pavlostathis, S. G., Rossi, A., Sanders, W. T. M., Sigrist, H., Vavilin, V. A., Anaerobic Digestion Moldel No. 1. Scientific and Technical
Report No. 13. IWA Publishing, Cornwall, UK. (2002).
Borges, E. S. M., Thermal treatment of anaerobic sludge using biogas produced in UASB reactors aiming at hygienization and improvement of the bioavailability and biodegradability characteristics of the organic fraction. Ph.D. Thesis. Escola de Engenharia, Universidade Federal de Minas Gerais, Belo Horizonte, Brazil (2004). (in Portuguese)
Bougrier, C., Albasi, C., Delgenès, J. P., Carrère, H., Effect of ultrasonic, thermal and ozone pre-treatment on waste active sludge solubilisation and anaerobic biodegradability, Chem. Eng. Proc., 45 (8), 711-718 (2006a).
Bougrier, C., Delgenès, J. P., Carrère, H., Combination of thermal treatments and anaerobic digestion to reduce sewage sludge quantity and improve biogas yield, Process Saf. Environ. Protect., 84 (B4), 280-284 (2006b).
Bougrier, C., Delgenès, J. P., Carrère, H., Effects of thermal treatments on five different waste activates sludge samples solubilisatios, physical properties and anaerobic digestion, Chemical Engineering Journal, 139, 236-244 (2008).
Deleris, S., Geaugey, V., Camacho, P., Debellefontaine, H., Paul E., Minimization of sludge production in biological processes: An alternative solution for the problem of sludge disposal, In: Specialised Conference on Sludge Management: regulation, treatment, utilization and disposal, Acapulco: IWA, 486-493 (2001).
Dohanyos, M., Zabranska, J., Kutil, J., Jenicek, P., Improvement of anaerobic digestion of sludge, Water Sci. Technol., 49 (10), 89-96 (2004). Dubois, M., Gilles, K. A., Hamilton, J. K., Rebers, P.
A., Smith, F., Colorimetric Method for determination of sugars and related substances, Analytical Chemistry, 28 (3), 350-356 (1956). Evans, G., Biowaste and biological waste treatment,
James & James Scienc Publishers Ltd. (ed.), London, p. 194 (2001).
Ferrer, I., Ponsáb, S., Vázquezc, F., Font, X. Increasing biogas production by thermal (70oC) sludge pre-treatment prior to thermophilic anaerobic digestion, Biochemical Engineering Journal, 42, 186–192 (2008).
Fjordside, C., An operating tale from Naeested Sewage Treatment plant, Municipal Wastewater Treatment Nordic Conference, Copenhagen, 17-19 January (2001).
applications, new trends, perspectives, and challenges, Reviews in Environmental Science and Bio/Technology, 5, 3-19 (2006).
França, M., Evaluation of the biodegradability and bioavailability characteristics of anaerobic sludge thermo-hydrolyzed by using biogas, M.Sc. Dissertation, Departamento de Engenharia Sanitária e Ambiental, Universidade Federal de Santa Catarina, Florianópolis, Brazil (2002). (In Portuguese)
Gavala, H. N., Yenal, U., Skiadas, I. V., Westermann, P., Ahring, B. K., Mesophilic and thermophilic anaerobic digestion of primary and secondary sludge, Effect of pre-treatment at elevated temperature, Water Res., 37, 4561-4572 (2003).
Graja, S., Chauzy, J., Fernandes, P., Patria, L., Cretenot, D. Reduction of sludge production from WWTP using thermal pretreatment and enhanced anaerobic methanisation, Water Sci. Technol., 52 (1-2), 267-273 (2005).
Haug, R. T., Stuckey, J. M., Gossett, P. L., Mac Carty, Effect of thermal pretreatment on digestibility and dewaterability of organic sludges, J. Water Pollut. Control Fed., 73 – 85 (1978).
Haxaire, P., Grouset, D., Ladet, B., Sage, S., Thermal treatment of sludge by thermolysis, In: World Water Congress of the International Water Association, Paris: Conference Preprint. Book 4, IWA, 396-403 (2000).
IPCC, Climate Change 2001: The Scientific Basis. Contribution of Working Group I to the Third Assessment Report of the Intergovernmental Panel on Climate Change, J. T., Houghton, J. T., Y. Ding, D. J., Griggs, M., Noguer, P. J., van der Linden, X. Dai, K. Maskell, and C. A. Johnson, eds. Cambridge University Press, Cambridge, UK and New York, NY USA (2001).
Jain, S., Lala, A. K., Bhatia, S. K., Kudchadker, A. P. Modelling of hydrolysis controlled anerobic digestion, J. Chem. Technol. Biotechnol., 53, 337-344 (1992).
Kepp, U., Solheim, O. E., Meeting increased demands on sludge quality – Experience with full scale plant for thermal disintegration, In: World Congress of Anaerobic Digestion, Antwerpen: Anaerobic Conversion for Sustainability, Proceedings - Part 2, 523-525 (2001).
Kim, J., Park, C., Kim T. H., Lee, M., Kim, S., Kim, S. W., Lee, J., Effects of various pretreatments for enhanced anaerobic digestion with waste activated sludge, J. Biosci. Bioeng., 95 (3), 271-275 (2003).
Li, Y. Y., Noike, T., Upgrading of anaerobic digestion of waste actived sludge by thermal pretreatment, Water Sci. Technol., 26, 857-866 (1992).
Lu, J., Gavala, H. N., Skiadas, I. V., Mladenovska, Z., Ahring, B. K., Improving anaerobic sewage sludge digestion by implementation of a hyper-thermophilic prehydrolysis step, Journal of Environmental Management, 88, (4), 881-889 (2008).
Metcalf & Eddy, Wastewater engineering: treatment, disposal and reuse, Mc Graw Hill (ed.), 3nd edn, 1334p. (1991).
Mulder, A., Optmisation of the methane recovery from anaerobic sewage treatment. In: World Congress of Anaerobic Digestion, Antwerpen: Anaerobic Conversion for Sustainability, Proceedings - Part 2, 617-619 (2001).
Muller, J. A., Prospects and problems of sludge pre-treatment processes, Water Science and Technology, 44 (10), 121-128 (2001).
Neyens, E., Baeyens, J., A review of thermal sludge pre-treatment processes to improve dewaterability, J. Hazard. Mater., 98 (1-3), 51-67 (2003).
O’Flaherty, V., Collins, G., Mahony, T., The microbiology and biochemistry of anaerobic bioreactors with relevance to domestic sewage treatment, Reviews in Environmental Science and Bio/Technology, 5, 39-55 (2006).
Pavlostathis, S. G., Giraldo-Gomez, E., Kinetics of anaerobic treatment, CRC Crit. Rev. Environm. Contr., 21, 411-490 (1991).
Peterson, G. L., A simplification of the protein assay method of Lowry et al., Which is more generally applicable, Analytical Biochemistry, 83, 346-356 (1977).
Postma, T., Stroes, J. A. P., Lipid screening in clinical chemistry, Clinica chimica Acta, 22, 569-578 (1968).
Rocher, M., Goma, G., Begue, A. P., Louvel, L., Rols, J. L., Towards a reduction in excess sludge production in activated sludge processes: biomass physicochemical treatment and biodegradation, Appl. Microbiol. Biotechnol., 51, 883-890 (1999).
Schieder, D., Schneider, R., Bischof, F., Thermal hydrolysis (TDH) as a pretreatment method for the digestion of organic waste, Water Science and Technology, 41 (3), 181-187 (2000).
Spiegel, M. R., Estatística. Makron Books (ed.), 3rd edition, São Paulo, 643p. (1993). (In Portuguese) Standard Methods for the Examination of Water and
Wastewater 20th edition, American Public Health Association/American Water Works Association/ Water Environment Federation, Washington DC, USA (1998).
Stuckley D. C., Mac Carty, P. L. Thermochemical pretreatment of nitrogenous materials to increase methane yield, Biotechnol. Bioeng. Symp., 8, 219-233 (1978).
Tanaka, S., Kobayashi, T., Kamiyama, K. I., Bildan, L. N., Effects of termo-chemical pretreatment on the anaerobic digestión of waste actives sludge, Water Sci. Technol., 35, 209-215 (1997).
Valo, A., Carrère, H., Delgenès, J. P., Thermal, Chemical and Thermo-chemical pre-treatment of
waste active sludge for anaerobic digestion, J. Chem. Technol. Biotechnol., 79, 1197-1203 (2004). Vavilin, V. A., Rytov, S. V., Lokshina, L. Ya., A
description of hydrolysis kinetics in anaerobic degradation of particulate organic matter, BioresourceTechnology, 56, 229-237 (1996). Weisz, N., Kepp, U., Norli, M., Panter, K., Solheim,
O. E., Sludge disintegration with thermal hydrolysis – Cases from Norway, Denmark, and United Kingdom, In: World Water Congress of the International Water Association, Paris: Conference Preprint. Book 4, IWA, 288-295 (2000).