Using the forced oscillation technique to evaluate
respiratory resistance in individuals with silicosis*
JAYME ALVES DE MESQUITA JÚNIOR1, AGNALDO JOSÉ LOPES2, JOSÉ MANOEL JANSEN3, PEDRO LOPES DE MELO4
*Study carried out at the Universidade do Estado do Rio de Janeiro (UERJ, University of the State of Rio de Janeiro), Rio de Janeiro, Rio de Janeiro, Brazil
1. Engineer. Researcher at the Laboratory of Biomedical Instrumentation and the Laboratory of Microcirculation Research of the Universidade do Estado do Rio de Janeiro (UERJ, University of the State of Rio de Janeiro), Rio de Janeiro, Rio de Janeiro, Brazil
2. Head of the Pulmonary Function Testing Laboratory of the Hospital Universitário Pedro Ernesto (HUPE, Pedro Ernesto University Hospital), Universidade do Estado do Rio de Janeiro (UERJ, University of the State of Rio de Janeiro), Rio de Janeiro, Rio de Janeiro, Brazil
3. Full Professor at the Universidade do Estado do Rio de Janeiro (UERJ, University of the State of Rio de Janeiro), Rio de Janeiro, Rio de Janeiro, Brazil
4. Engineer. Adjunct Professor at the Universidade do Estado do Rio de Janeiro (UERJ, University of the State of Rio de Janeiro), Rio de Janeiro, Rio de Janeiro, Brazil
Correspondence to: Pedro Lopes de Melo. Rua São Francisco Xavier, 524, térreo, salas 104 e 105 - CEP 20550-013, Rio de Janeiro, RJ, Brazil. Phone: 55 21 2587-7773. E-mail: [email protected]
Submitted: 18 July 2005. Accepted, after review: 7 October 2005.
ABSTRACT
Objective: To evaluate the resistance values obtained through the use of the forced oscillation technique in patients with varying degrees of airway obstruction resulting from silicosis. Methods: A total of 40 never-smoking volunteers were analyzed: 10 were healthy subjects with no history of pulmonary disease or silica exposure, and 30 had silicosis. The forced oscillation technique was used to examine the subjects, and spirometry was used as a reference in order to classify the obstruction by degree. This classification resulted in five groups: control (n = 10); normal exam, composed of individuals diagnosed clinically and radiologically with silicosis but presenting normal spirometry results (n = 7); mild obstruction (n = 10); moderate obstruction (n = 8); and severe obstruction (n = 5). Results: The reduction observed in the spirometric values corresponded to a significant increase in the total respiratory resistance (p < 0.001), as well as in airway resistance (p < 0.003). A significant reduction in ventilation homogeneity was also observed (p < 0.004). Conclusion: In individuals with silicosis, the additional respiratory resistance-related data obtained through the use of the forced oscillation technique can complement spirometric data. Therefore, the forced oscillation technique presents great potential for the analysis of such patients.
INTRODUCTION
Silicosis is a typical occupational respiratory disease characterized by provoking irreversible alterations throughout the alveolar and interstitial structure.(1) In Brazil, the estimated number of workers engaged in activities that put them at risk for silica exposure is greater than 6 million.(2) Silicosis predisposes the organism to a series of pulmonary and extrapulmonary comorbidities, such as tuberculosis, emphysema, chronic airflow limitation, autoimmune diseases, and lung cancer.(3) Spirometry is the exam of choice for evaluating pulmonary function in individuals with silicosis.(4) In silicosis, there are no typical dysfunction patterns, and the detection of early functional alterations is technically very difficult since the disease begins in the distal airways. In simple silicosis, with no other accompanying diseases, spirometry results are generally normal. In the more severe form of the disease, there are two effects on pulmonary function: fibrosis causing restriction and development of secondary emphysema causing hyperinflation and reduced airflow.(5)
Some authors(6) observed that the alterations in airway resistance, which is measured through plethysmography, significantly influence the prognosis of the health status of individuals exposed to dust. Others(7) observed that airway resistance was largely dependent on the status of the disease, and that there was an increase in airway resistance due to a reduction in vital capacity and forced expiratory volume in one second (FEV1), as well as to an increase in residual volume. Silicosis does not present its own symptomatology and, as previously emphasized, normal spirometry results are common in the initial phases,(8) which suggests the need for exams that are more sensitive to the alterations induced by the physiopathological process.
Originally described in 1956,(9) the forced oscillation technique (FOT) is based on the application of low-pressure and low-amplitude oscillations to the respiratory system of an individual using an external device.(10-11) The pressure oscillations applied allow the respiratory system impedance to be estimated and the properties related to heat dissipation in the respiratory system (resistance), as well as those associated with energy storage (complacency and inertance), to be described. Since this technique
requires only passive cooperation, is applied during spontaneous respiration, and provides new parameters for analysis, it presents characteristics that are complementary to those of the classic techniques and contributes to a more detailed exam. In addition, it facilitates the performance of pulmonary function tests under conditions for which the traditional techniques are not appropriate.(10-11) Important examples include the analysis of respiratory disorders in children,(11) sleep apnea,(11-12) and assessment of nasal obstruction.(11,13) However, the FOT is still an experimental technique whose clinical application still depends on several factors, such as the exact identification of the more appropriate parameters for the diagnosis and monitoring of each specific respiratory disease. Therefore, our group has put much effort into researching the FOT contribution to the analysis of the abnormalities in respiratory mechanics associated with diseases such as asthma,(14) chronic obstructive pulmonary disease,(15) sarcoidosis,(16) and interstitial diseases,(17) as well as to investigate the effects of the use of bronchodilators in asthma,(18) chronic obstructive pulmonary disease,(19) and sarcoidosis.(20) These studies will make it possible to optimize the methodology and the measurement system according to the specific characteristics of each one of the several respiratory diseases.
The high sensitivity in detecting the onset of airway obstruction, theoretically presented by the FOT, makes this technique interesting for the evaluation of individuals exposed to occupational risks.(21) Earlier studies in this area indicate that the alterations in the indices estimated through the FOT assays reflected the modifications present in the results obtained using traditional techniques.(22) During the investigation of individuals exposed to irritating respiratory agents, the FOT provided data complementary to those obtained through the use of spirometry.(23) The promising results obtained in previous studies of the above-mentioned respiratory diseases, as well as preliminary results obtained in the investigation of silicosis itself,(24) provide additional support for the hypothesis that the FOT may be useful in the evaluation of individuals with this disease.
been no comparative studies of FOT results in individuals presenting varying levels of silicosis-related reduction in respiratory volume and respiratory flow.
In this context, the present study aimed to investigate the potential of the respiratory impedance evaluations carried out through the use of FOT in the examination of individuals with silicosis. To that end, the FOT was used in the analysis of the alterations in the resistance values of the respiratory system in individuals with silicosis presenting varying degrees of reduction in respiratory flow and respiratory volume, these varying degrees being determined through the use of spirometry.
METHODS
We analyzed the resistance values obtained through the use of the FOT in five groups of individuals: individuals with no history of respiratory disease (control group, n= 10); individuals diagnosed with silicosis but presenting normal spirometry results (n = 7); individuals diagnosed with silicosis and presenting mild respiratory obstruction (n = 10); individuals presenting moderate obstruction (n = 8); and individuals presenting severe obstruction (n = 5). None of the individuals presented any history of smoking or asthma.
The tests were carried out in the Pulmonary Function Testing Laboratory of the Pulmonology Department of the University of the State of Rio de Janeiro School of Medical Sciences. Data processing and statistical analysis were carried out in the Laboratory of Biomedical Instrumentation, which is an interdisciplinary laboratory affiliated with the Institute of Biology and the University of the State of Rio de Janeiro School of Engineering. The study was approved by the Ethics in Research Committee of the Pedro Ernesto University Hospital). The participants were not imposed upon in any way, and the results always remained confidential. Prior to the test, the patients were oriented regarding the technique and the study procedure. Accepting to participate, those patients gave written informed consent. The experiments meet the criteria established by the Declaration of Helsinki.
Spirometric tests were carried out using Vitatrace (model 130 SL) and Collins/SG spirometers. All assays followed the procedures recommended by the First Brazilian Consensus on Spirometry.(27) All reports
on the severity of the respiratory obstruction were based on the spirometric parameters, and the percentage data on the ratio between forced expiratory volume in one second (VEF1) and forced vital capacity (FVC), as well as the ratio between forced expiratory flow (FEF) and FVC, were used according to the classification proposed by Jansen.(28) The normality values were obtained from the studies carried out by Knudson et al.(29) and Pereira et al.(30)
The instrument used to carry out the tests involving the FOT was developed by the authors and has been previously described.(31-32) Basically, the system applies a pseudorandom pressure signal of low amplitude (1 cmH2O), containing all of the 2-Hz harmonics between 4 Hz and 32 Hz, to the respiratory system of the individual. The initial pressure is measured using a Honeywell transducer (model 176), and the airflow is measured using a pneumotacograph attached to a similar transducer. The pressure and flow signals are measured in 16-second periods, and impedance is estimated by calculating the ratio between the Fourier transform of the applied pressures and the Fourier transform of the resulting flow, this ratio being obtained for each of the frequencies applied. This procedure allows the evaluation of the resistance-related mechanical attributes, as well as of the mechanical attributes of energy storage, along with the elastic and inertial properties of the system.(10) The present study focuses on the analysis of the respiratory resistance attributes calculated in the 4-16 Hz range, since this range proved to be more discriminating in previous studies.(15-17,19-20,24)
During the FOT tests, the individuals remained in a sitting position and used a nose clip, supporting their cheeks and chin with their hands while breathing calmly through the use of a mouthpiece. The coherence function used for the acceptance of the tests was set at a minimum of
0.9.(10-11) Figure 1 shows an illustrative photo of a
volunteer engaged in the FOT test.
resistance (mR). The total energy loss through heat production in the respiratory system is described by R0, whereas mR describes the energy loss related to the airways. The slope of resistance (S) is related to the imbalance in the time constants of the respiratory system, as well as to the effect of the upper airways.(10-11) The results are presented as mean ± standard deviation. In order to allow a comparative analysis of the variations presented by the parameters provided by the FOT and spirometry, we compared the data obtained through the use of these two techniques. To that end, the statistical analysis was carried out through the use of a commercial software package (Estatística 5.0), analysis of variance (ANOVA) was used to evaluate the alterations among the groups, and Bonferroni corrections were used to compare the control group with the other patients, as well as to compare the several groups of patients. The differences between the means were considered significant when p = 0.05 using ANOVA, and p < 0.005 after Bonferroni corrections.
RESULTS
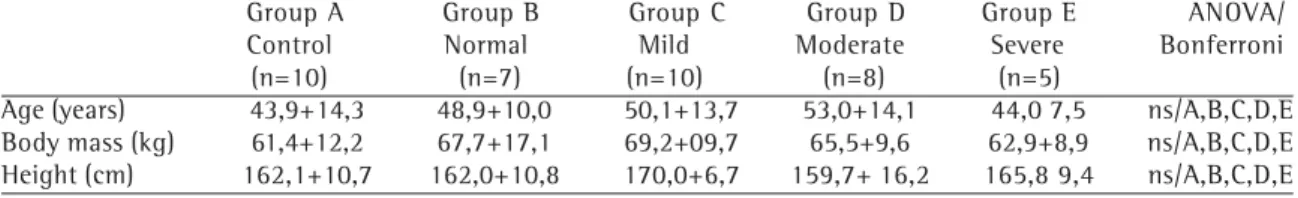
Table 1 shows the biometric characteristics of the groups studied. The groups were comparable in terms of age, weight, and height, and there were no significant differences in terms of the ANOVA or the comparisons among the groups.
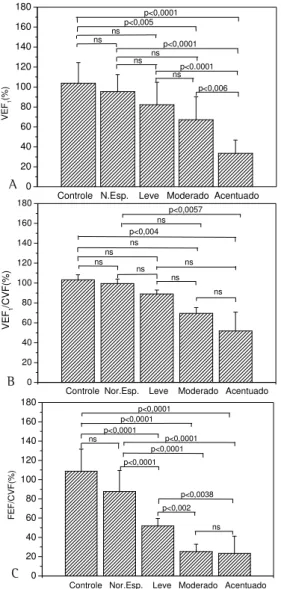
Figure 2 shows the results of the theoretical percentages of FEV1, FEV1/FVC and FEF/FVC for the groups studied. We observed significant percentage reductions in FEV1 (ANOVA, p < 0.0001), FEV1/FVC(%) (ANOVA, p < 0.0005), and FEF/FVC (ANOVA, p < 0.0001).
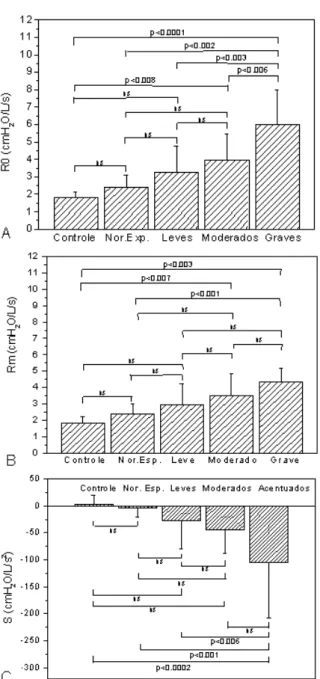
Figure 3 shows the mean total resistance for each of the groups studied, whereas Figure 4 presents the results related to R0, mR and S. From the statistical
point of view, we observed a strong tendency toward an increase in the mean R0 (ANOVA, p < 0.0001), mR (ANOVA, p < 0.003), and S (ANOVA, p < 0004).
DISCUSSION
In concordance with the methodology used,(28) we observed significant alterations in FEF/FVC (%) in the initial phases, including in the control group and the groups of individuals presenting mild and moderate obstruction, whereas more statistically relevant reductions in FEV1 were observed in more advanced phases. Normal pulmonary functions are common in simple silicosis. However, in more complicated cases, moderate reductions in diffusing capacity, pulmonary volumes, and compliance are found.(33) In concordance with the results of the present study, some authors(34) have observed a significant reduction in FEV1 (%) in parallel with the progression of emphysema in individuals with silicosis.
TABLE 1
Characteristic of the group studied (mean ± standard deviation) together with ANOVA and Bonferroni corrections for comparisons among adjacent groups
Group A Group B Group C Group D Group E ANOVA/ Control Normal Mild Moderate Severe Bonferroni (n=10) (n=7) (n=10) (n=8) (n=5)
Age (years) 43,9+14,3 48,9+10,0 50,1+13,7 53,0+14,1 44,0 7,5 ns/A,B,C,D,E Body mass (kg) 61,4+12,2 67,7+17,1 69,2+09,7 65,5+9,6 62,9+8,9 ns/A,B,C,D,E Height (cm) 162,1+10,7 162,0+10,8 170,0+6,7 159,7+ 16,2 165,8 9,4 ns/A,B,C,D,E Figure 1 - Positioning of a volunteer during the test carried out through the use of the forced oscillation technique. Note the nasal clip and the use of the support to reduce the effect of the upper airways
Figure 3 shows an increase in the respiratory obstruction according to the progression of the disease, this increase being more discriminating in the 4-16 Hz range. The comparison between the group of individuals presenting normal spirometry results and the control group revealed that resistance was slightly higher in the former that in the latter. This slight alteration might be associated with the functional modifications in the respiratory system resulting from the initial stage of the
disease. We must highlight the fact that these alterations may be indicative of risk of long-term adverse effects on respiratory function.
The control group presented lower R0 than did the other groups (Figure 4A). These results are in direct concordance with the more limited respiratory obstruction presented by these patients and with the values previously reported in the literature.(10,25,35-36) Through visual inspection, we can clearly observe the increase in R0 with the reduction in the spirometric values. This increase probably reflects the increased airway resistance, as well as tissue alterations. Similar results were obtained in studies on the progression of resistance values associated with flow and volume reduction in individuals with chronic obstructive pulmonary disease(14) and asthma.(15) Epidemiological studies(35-36) with workers who are more prone to develop occupational diseases have been carried out. The authors suggested that R0 may be a sensitive parameter to describe airway obstruction in these individuals. Considering that the R0 values obtained for individuals with silicosis were higher than those obtained for the control group subjects, the results of the present study are in direct concordance with the proposition put forward by the authors of those studies. We must highlight the fact that the total resistance values were higher in the group of patients presenting normal spirometry results than in the control group, and this, as previously emphasized, might be associated with the alterations present in
Figure 3 - Curves of total respiratory resistance (Rrs) curves in the 4-32 Hz range in the control group and in the normal spirometry group, as well as in the mild, moderate and severe silicosis-related obstruction groups. Norm.: normal spirometry results 0 20 40 60 80 100 120 140 160 180 ns ns p<0,0057 p<0,004 ns ns ns ns ns ns VEF 1 /C V F (% )
Controle Nor.Esp. Leve Moderado Acentuado
0 20 40 60 80 100 120 140 160 180 p<0,0001 p<0,005 ns ns p<0,0001 p<0.0001 p<0,006 ns ns ns VEF 1 (% )
Controle N.Esp. Leve Moderado Acentuado
0 20 40 60 80 100 120 140 160 180 p<0,0001 p<0,0001 p<0,0001 p<0,0001 p<0,0001 p<0,0038 ns p<0,0001 p<0,002 ns FE F/C V F (% )
Controle Nor.Esp. Leve Moderado Acentuado
Figure 2 - Behavior of the theoretical percentage values for FEV1, FEV1/FVC and FEF/FVC in the control group, in the group of individuals presenting normal spirometry results, and in the groups of individuals presenting mild, moderate and severe silicosis-related obstruction. FEV1: forced expiratory volume in one second; FVC: forced vital capacity; FEF: forced expiratory flow; Norm.: normal spirometry results
A
B
the initial stage of the disease. Although the increase in R0 values due to the reduction in the spirometric values is visually very clear, from the statistical point of view, the differences among the means were not significant when the control group and the group of individuals presenting normal spirometry results, as well as the groups of individuals presenting mild and moderate obstruction (p > 0.005)
were taken into consideration. However, all comparisons between the group of individuals presenting severe obstruction and the other groups studied showed values that were either significant or borderline significant (p < 0.006). A comparative analysis of the R0 means obtained in the present study and those obtained in a similar study of asthma patients shows that the means in asthma patients were higher in all of the classes studied. This is in consistent with the differences in the physiopathology of these two diseases since asthma is essentially obstructive in nature and silicosis is predominantly restrictive. Figure 4B shows the results related to mR. In the control group, the mean mR was similar to values previously described in the literature.(26,37) Although no statistically significant difference was found in the comparisons among the adjacent classes (p > 0.005), there was a significant increase in the mean values, accompanying the spirometric classification of the bronchial obstruction (ANOVA, p < 0.0003). Therefore, these results are in agreement with the interpretation presented in the Methods section, in which the mR was related to the airways. These results are also in agreement with those obtained by other authors through the use of plethysmography.(7) As was highlighted in the introductory section of the present study, these researchers observed an increase in the airway resistance due to the reduction in FEV1 in patients with silicosis. The airflow obstruction in silicosis results from the conglomeration of fibrous masses that, due to retraction, distorts the bronchi and bronchioles, as well as leading to emphysema. Comparing the mean values of the total respiratory resistance in Figure 4A with the respective means values of mR, together with the airway resistance, we observed a progressive increase in the difference between the two resistances (R0 and mR). This increase suggests that the reduction in the spirometric indices may also be related, at least in part, to the increase in tissue resistance.
Figure 4C shows the results related to the variation in resistance according to the frequency (S), this variation being associated with the ventilation heterogeneity. The individuals in the control group presented homogeneous lungs that can be described using a simple uni-behavioral model. This simplicity translates to a rather constant resistance value in the FOT assays. Individuals presenting ventilation heterogeneity require more complex models that include several compartments.
In this case, negative curves are inserted along the slope of resistance.(10-11,14-15) Through visual inspection, we can clearly observe the increase in ventilation heterogeneity according to the reduction in the spirometry values of bronchial obstruction in patients with silicosis. The individuals in the group presenting normal spirometry results showed greater heterogeneity than did those in the control group; a fact that might be related to the initial alterations resulting from the onset of the disease. Although the differences among the means of adjacent classes were not significant, the results described in Figure 4C clearly demonstrate that the reduction in the spirometry values is accompanied by a reduction in ventilation homogeneity.
We must highlight the fact that the FOT used in the present study should not be confused with the impulse oscillometry technique, which, although similar, presents differences related to the method of excitation, processing, and presentation of results.(11,38)
Similar to what occurs with other techniques of functional evaluation, the limitations of the FOT must be acknowledged. One of its main limitations is related to upper airway impedance, including that created by the cheeks. Upper airway impedance runs mechanically parallel to that of the respiratory system,(10-11) introducing a source of error that becomes significant when impedance is high in the individual being examined, a condition found in the patients included in the present study. It is of note that, in this case, the effectively measured impedances will be lower than those present in the respiratory system, and this effect increases in the frequency analyzed.(10-11) In view of this, we observed that this effect is also important for estimating the range of variation in resistance by frequency. Therefore, when the obstruction is considerable, the S will describe not only the homogeneity of the respiratory system but also the influence of the upper airways. In order to reduce this effect, individuals were asked to place their chin in their hands and firmly press their cheeks together during the test.
In studies involving FOT, the process of spontaneous ventilation introduces errors in the 0.25-8 Hz range, which could limit the reliability of the FOT results obtained within this range.(10-11) In the present study, such errors were minimized
by the use of coherence function set at a minimum of 0.9, which guaranteed that the margin of error was lower than 5%.
The results of the present study indicate that the reductions in the spirometric values in individuals with silicosis are associated with great modifications in the resistance values of the respiratory system of these individuals. Total respiratory resistance and, to a lesser degree, airway resistance are observed to increase in parallel with the progression of the airflow obstruction. In addition, the effects of this progression also include a reduction in the homogeneity of the respiratory system. In individuals with silicosis, the additional respiratory resistance-related data obtained through the use of the FOT can complement spirometric data. Therefore, the FOT presents great potential for the analysis of such patients.
ACKNOWLEDGEMENTS
The authors would like to thank the technicians of the Pulmonary Function Testing Laboratory of the Hospital Universitário Pedro Ernesto for their assistance in the performance of the tests, as well as Mr. Josiel Gonçalves dos Santos for his technical support. The authors are also grateful to CNPq and FAPERJ for the financial support provided.
REFERENCES
1. Tarantino AB. Doenças pulmonares. Rio de Janeiro: Guanabara Koogan; 1990.
2. Algranti E. Epidemiologia das doenças ocupacionais respiratórias no Brasil. Epidemiol Doenças Respir. 2001;1(3):119-43.
3. Calvert GM, Rice FL, Boiano JM, Sheehy JW, Sanderson WT. Occupational silica exposure and risk of various diseases: an analysis using death certificates from 27 states of the United States. Occup Environ Med. 2003;60(2):122-9.
4. Bagatin E, Jardim JRB, Nery LE, Capitani EM de, Marchi E, Sabino MO, et al. Ocorrência de silicose pulmonar na região de Campinas-SP. J Pneumol. 1995;21(1):17-26. 5. Pereira CAC, Carvalho CRR, Nakafani PJ. Temas de
pneumologia. São Paulo: Atheneu; 1996. 336 p. 6. Mandi A, Galgoczy G, Galambos E, Nemeth L, Dombos
K. Changes in clinical status and lung functions of patients with chronic respiratory diseases over 10 years. Respiration. 1984;46(2):151-9.
7. Krause M, Mahrlein W. [Bodyplethysmographic analysis in patients with silicosis]. Z Erkr Atmungsorgane. 1976;145(3):327-30. German.
Occupational disorders of the lung: recognition, management and prevention; New York, WB Saunders; 2002. p.105-28.
9. Dubois AB, Brody AW, Lewis DH, Burgess Jr BF. Oscillation mechanics of lungs and chest in man. J Appl Physiol. 1956;8(6):587-94.
10. Melo PL, Werneck MM, Giannella-Neto A. Avaliação de mecânica ventilatória por oscilações forçadas: fundamentos e aplicações clinicas. J Pneumol. 2000; 26(4):194-206.
11. MacLeod D, Birch M. Respiratory input impedance measurement: forced oscillation methods. Med Biol Eng Comput. 2001;39(5):505-16.
12. Lemes LNA, Melo PL. Forced oscillation technique in the sleep apnea/hypopnoea syndrome: identification of respiratory events and nasal continuous positive airway pressure titration. Physiol Meas. 2003;24(1):11-25. 13. Lemes LN, Melo PL. Simplified oscillation method for
assessing nasal obstruction non-invasively and under spontaneous ventilation: a pilot study. Med Biol Eng Comput. 2003;41(4):439-44.
14. Cavalcanti, JV, Lopes AJ, Jansen JM, Melo PL. Alterations in respiratory mechanics resulting from the progression of airway obstruction in asthmatic subjects analyzed by the Forced Oscillation Technique (FOT) [abstract]. Chest. 2003;124(Suppl 4):137S.
15. Melo PL, Mango AMG, Cavalcante JV, Lopes AJ, Jansen, JM. Forced Oscillation Technique vs spirometry to assess COPD stage [abstract]. Chest. 2002;122(Suppl 4):138S-9. 16. Melo PL, Andrade WS, Lopes AJ, Jansen JM. Evaluation of respiratory mechanics by forced oscillation technique in sarcoidosis [abstract]. Chest. 2002;122(Suppl 4):100S. 17. Souza LC, Lopes AJ, Jansen JM, Melo PL. Respiratory mechanics in interstitial lung diseases patients with and without functional alterations in spirometry by forced oscillation [abstract]. Chest. 2003;124(Suppl 4):192S. 18. Cavalcanti JV, Jansen JM, Lopes AJ, Melo PL. Técnica
de oscilações forçadas (TOF) no estudo da resposta broncodilatadora em indivíduos portadores de asma brônquica. J Pneumol. 2003;29(Supl 1):32.
19. Mango AMGT, Cavalcanti JV, Lopes AJ, Jansen JM, Melo PL. Forced Oscillation Technique assessing bronchodilator response in asthmatics and COPD patients [abstract]. Chest. 2002;122(Suppl 4):138S.
20. Tramont CVV, Lopes AJ, Jansen JM, Melo PL. Resultados preliminares do estudo das modificações introduzidas na mecânica respiratória de pacientes com sarcoidose pelo uso de broncodilatadores. In: IX Congresso de Pneumologia e Tisiologia do Estado do Rio de Janeiro, 2003. Anais. Rio de Janeiro; 2003.
21. Demedts M, Noord JA, Woestijne KP. Clinical applications of the forced oscillation technique, Chest. 1991;99(4):795-6.
22. Keman S, Willense B, Wesselling GJ, Kusters E, Borm PJA. A five year follow-up of lung function among chemical workers using flow-volume and impedance measurements. Eur Respir J. 1996;9(10):2109-15. 23. Jorna T, Koiter N, Slanger J, Henderson P, Wouters E,
Borm P. Effects of inorganic dust exposure on lung
function measured by spirometry and forced oscillation technique (FOT). Am Rev Respir Dis. 1992;145:a539. 24. Melo PL, Cruz NK, Mesquita Junior JÁ, Lopes AJ, Jansen
JM. Variações nos índices oscilométricos em indivíduos portadores de obstrução respiratória associada à silicose leve e moderada. In: XVIII Congresso Brasileiro De Engenharia Biomédica 2002. Anais, São José dos Campos; 2002. p. 61-6.
25. Brochard L, Pelle G, de Palmas J, Brochard P, Carre A, Lorino H, et al. Density and frequency dependence of resistance in early airway obstruction. Am Rev Respir Dis. 1987;135(3):579-84.
26. Pasker HG, Peeters M, Genet P, Clement J, Nemery B, Van de Woestijne KP. Short-term ventilatory effects in workers exposed to fumes containing zinc oxide: comparison of forced oscillation technique with spirometry. Eur Respir J. 1997;10(7):1523-9. 27. Sociedade Brasileira de Pneumologia e Tisiologia. I
Consenso Brasileiro sobre Espirometria. J Pneumol. 1996;22(3):105-64.
28. Jansen JM. Classificação da síndrome obstrutiva crônica - uma proposta estatística [tese]. Rio de Janeiro: Universidade Federal Fluminense; 1994.
29. Knudson RJ, Lebowitz MD, Holberg CJ, Burrows B. Changes in the normal maximal expiratory flow-volume curve with growth and aging. Am Rev Respir Dis. 1983;127(6):725-34.
30. Pereira CAC, Barreto SP, Simões JG, Pereira FWL, Gerstler JG, Nakatami J. Valores de referência para espirometria em uma amostra da população brasileira adulta. J Pneumol. 1992;18(1):10-22.
31. de Melo PL, Werneck MM, Giannella-Neto A. Effect of the pressure generator non-linearities in the accuracy of respiratory input impedance measured by forced oscillation. Med Biol Eng Comput. 2000;33(1):102-8. 32. de Melo PL, Werneck MM, Gianella-Neto A. New impedance spectrometer for scientific and clinical studies of the respiratory system. Rev Sci Instrum. 2000;71(7):2867-72. 33. Cordova FC, Junior DS. Occupational lung diseases
pulmonary. Pathophysiology. 1999;19:383-403. 34. Cowie RL, Hay M, Thomas RG. Association of silicosis,
lung dysfunction, and emphysema in gold miners. Thorax. 1993;48(7):746-9.
35. Pairon JC, Iwatsubo Y, Hubertt C, Lorino H, Nouaigui H, Gharbi R, et al. Measurement of bronchial responsiveness by forced oscillation technique in occupational epidemiology. Eur Respir J. 1994;7(3):484-9.
36. Pham QT, Bourgkard E, Chau N, Willim G, Megherbi SE, Teculescu D, et al. Forced oscillation technique (FOT): a new tool for epidemiology of occupational lung diseases? Eur Respir J. 1995;8(8):1307-13.
37. Landser FJ, Clement J, Van de Woestijne KP. Normal values of total respiratory resistance and reactance determined by forced oscillations: influence of smoking. Chest. 1982;81(5):586-91.