ARTICLE
Combined nerve conduction index in
diabetic polyneuropathy
Índice combinado de condução nervosa na polineuropatia diabética
Carlos Otto Heise, Flavia Costa Nunes Machado, Simone Consuelo de Amorim, Sonia Maria de Toledo
Nerve conduction studies are commonly used to conirm diabetic polyneuropathy1 and should be included as part of
the deinition of distal polyneuropathy for clinical research2.
hey provide objective data and are generally more accurate than clinical evaluation3. Nerve conduction studies are
com-posed of several tests, including motor and sensory responses. Each test is performed in few individual nerves and provides two to ive diferent parameters. In standard neurophysiologi-cal evaluation of the lower limbs, more than twenty diferent parameters are evaluated, and each one has its own norma-tive data. Each parameter is usually deined as “normal” or “abnormal”. his is a simplistic interpretation, since border-line values may be encountered. Moreover, normal values are inluenced by factors such as age and height4-6, thus difering
among patients.
A better way to express each parameter is providing the Z-score, which is the number of standard deviations (SD)
from the mean expected value4. Mean expected values can
be adjusted to biological variables such as age and height. Results that are more than 2 SD away from the mean expect-ed value are considerexpect-ed abnormal. his classic cutof point provides a theoretical speciicity of 97.7%. If a higher speci-icity is desired, a higher and more conservative cutof point may be used, such as 2.5 or 3.0 SD. Z-scores provide informa-tion regarding “how normal” or “how abnormal” is the param-eter in a continuous form. hey are also more intuitive to in-terpret and do not require the knowledge of each normative value. he parameter must have a normal distribution in con-trol subjects to be expressed as a Z-score. his is not the case for amplitudes of the potentials recorded in nerve conduction studies, but they can be transformed into a logarithm scale to it a normal distribution4,7.
Another advantage of Z-scores is that they can be com-bined. Since all parameters are provided in the same way,
Fleury Institute, Neurophysiology Section, São Paulo SP, Brazil.
Correspondence: Carlos Otto Heise; Rua Kansas 712; 04558-002 São Paulo SP - Brasil; E-mail: carlos.heise@grupofleury.com.br / coheise@ig.com.br
Conflict of interest: There is no conflict of interest to declare.
Received 01 December 2011; Received in final form 08 December 2011; Accepted 15 December 2011
ABSTRACT
Diabetic polyneuropathy can be confirmed by nerve conduction studies. The data can be analyzed in the form of a combined index instead of individual parameters. Methods: The combined index included five parameters of nerve conduction studies commonly used for evaluation of polyneuropathies. We evaluated sensitivity in 100 diabetic patients with suspected polyneuropathy, and specificity in 200 non-diabetic pa-tients with suspected lumbosacral radiculopathy. All results were expressed in number of standard deviations (SD). Results: The sensitivity of the combined index was 81 or 74%, and specificity was 97 or 98%, using respectively -2.0 or -2.5 SD as cutoff. The range of sensitivity of the other parameters was 57-65% or 48-56%, and specificity range was 96-98% or 98-100%, using the same criteria. Discussion: The combined index had higher sensitivity and equivalent specificity compared to isolated parameters.
Key words: diabetes mellitus, polyneuropathies, neural conduction, electrodiagnosis.
RESUMO
A polineuropatia diabética pode ser confirmada por estudos de condução nervosa. Os dados podem ser analisados por um índice combinado ao invés de parâmetros isolados. Métodos: O índice combinado incluiu cinco parâmetros usados rotineiramente na avaliação de polineuro-patias. Avaliamos a sensibilidade em 100 pacientes diabéticos com suspeita de polineuropatia e a especificidade em 200 pacientes não di-abéticos com suspeita de radiculopatia lombossacral. Todos os resultados foram expressos em número de desvios-padrão (DP). Resultados:
A sensibilidade do índice combinado foi 81 ou 74%, e a especificidade foi 97 ou 98%, usando respectivamente -2,0 ou -2,5 DP como ponto de corte. A sensibilidade dos parâmetros isolados oscilou entre 57-65% ou 48-56%, e a especificidade foi 96-98% ou 98-100%, usando os mesmos critérios. Discussão: O índice combinado apresentou melhor sensibilidade e especificidade equivalente aos parâmetros isolados.
they can be averaged. his provides a unique value repre-senting the whole neurophysiological exam. When averaging several Z-scores from a normal subject, random experimen-tal errors from each parameter are canceled and the averaged value tends to zero4,7. his means that the SD of the averaged
Z-score is smaller than it should be, so it must be also ana-lyzed in normal controls to establish its distribution7. After
that, it can also be expressed as a single combined Z-score index and interpreted in the same way.
he utilization of a single combined index has many ad-vantages over the use of several isolated parameters. he most obvious one is that it is easier to interpret. Besides that, several subnormal parameters may become abnormal when analyzed together. On the other hand, a single abnormal pa-rameter obtained because of a technical error would be com-pensated by the remaining normal values. heoretically, a combined index could enhance both sensitivity and speciic-ity of nerve conduction studies8.
In this study, we compared sensitivity and speciicity of ive diferent parameters of nerve conduction study with a combined index to detect polyneuropathy in symptomatic diabetic patients.
METHODS
Regression equations to calculate Z-scores were ob-tained from a previous study in our institution using 125 control subjects with age varying from 18 to 86 years (mean 46)9. We analyzed ive parameters in each lower limb
(to-tal of ten in each patient): sensory conduction velocity of the sural nerve (SCV-S), natural logarithm of the amplitude of the sensory action potential of the sural nerve (ASP-S) and supericial peroneal nerve (ASP-P), motor conduction velocity of the peroneal nerve (MCV-P) and F-M minimal latency of the tibial nerve (FW-T). he equation for Z-score calculation was: Z = (Vo – Ve)/SD, where Vo is the observed value of the parameter, Ve is the mean expected value cor-rected by age and height, and SD is the standard deviation observed in the normative group. he expected value was
obtained by regression analysis according to the general equation: Ve = b.a2 + c.a + d.h + e, where a is age in years, h
is height in centimeters and b, c, d, and e are experimental calculated coeicients. he coeicients and standard devi-ations of each parameter are listed in Table.
We retrospectively analyzed 100 consecutive diabetic patients referred to our diagnostic center for neurophysi-ological evaluation of clinically suspected diabetic polyneu-ropathy. All patients had glycosylated haemoglobin levels above 6.5 mg% and reported paresthesia or burning sensa-tion in both feet. Patients older than 65 years of age or with other known cause for polyneuropathy were excluded. We also analyzed retrospectively 200 consecutive non-diabetic patients referred for suspected lumbosacral radiculopathy. All patients had lumbosacral pain radiating down to one leg and fasting glucose levels below 99 mg/dL. Patients old-er than 65 years and those with bilatold-eral symptoms wold-ere excluded. his study was approved by the ethics research committee of our institution.
Nerve conduction studies were performed according to our standard protocol using a Portable Keypoint equip-ment (Dantec, Skovlunde, Denmark). Skin temperature was kept above 30ºC. Sensory nerve action potentials of sural
and supericial peroneal nerves were recorded using a bar electrode of 3 cm, with ixed distance of 14 cm between the stimulating and recording sites. We measured ASP-S and ASP-P in microvolts, and SCV-S in meters per second. Motor conduction studies were recorded with adhesive electrodes (Dantec 9013L0452, Skovlunde, Denmark) located over usu-al recording sites. MCV-P was recorded between the ankle and the ibular head, and expressed in meters per second. We measured the shortest of 10 tibial F waves latencies and subtracted the distal motor latency (M latency) to calculate FW-T in milliseconds.
All values were converted to Z-scores according to the equations in Table. FW-T was expressed in negative form, so that all negative Z-scores corresponded to subnormal val-ues. We obtained ten Z-scores from each patient ( ive from each lower limb), calculated the mean Z-score and used the last equation in Table to obtain the combined index. All
Z: Z-score; Vo: observed value; Ve: expected value; SD: standard deviation; a: age (years); h: height (centimeters); b, c, d, and e: experimental coefficients; ASP-S: natural logarithm of the amplitude of the sensory action potential of the sural nerve (µV); SCV-S: sensory conduction velocity of the sural nerve (m/s); ASP-P: natural logarithm of the amplitude of the sensory action potential of superficial peroneal nerve (µV); MCV-P: motor conduction velocity of the peroneal nerve (m/s); FW-T: F-M minimal latency of 10 F waves of the tibial nerve (ms). *Negative value of the standard deviation, so that negative Z-scores values refer to prolonged F waves.
Z = (Vo-Ve)/SD Ve = b.a2 + c.a + d.h + e
Parameter b c d e SD
ASP-S -0.00029 0.0132 -0.0133 5.029 0.418 SCV-S -0.00025 -0.0577 -0.0944 69.40 3.994 ASP-P -0.00029 0.0129 -0.0172 5.206 0.517 MCV-P -0.00025 -0.0497 -0.1154 71.66 2.761 FW-T 0.00041 0.0010 0.2909 -5.94 -2.772* Combined Index 0 -0.0085 -0.0077 1.743 0.524
calculations were done using a Microsoft Excel spreadsheet (Microsoft Corporation, Redmond, USA). If any parameter were unobtainable, the mean was calculated from the re-maining Z-scores. If all parameters were unobtainable, the Z-score was also considered unobtainable. We used two dif-ferent cutof levels to deine abnormality: -2.0 and -2.5 SD. Unobtainable parameters were also considered abnormal.
We compared sensitivity of the combined index and of the five isolated parameters to detect polyneuropathy in the diabetic group of patients. We also compared spec-ificity of the combined index and of the isolated parame-ters in the group of non-diabetic patients. The combined index and isolated parameters were compared through Chi-square test. Differences were considered statistically significant when p<0.05.
RESULTS
he group of symptomatic diabetic patients was com-posed of 39 women and 61 men. Age ranged from 25 to 65 years (median 57). he non-diabetic group was composed of 113 women and 87 men, with age ranging from 21 to 65 years (median 47).
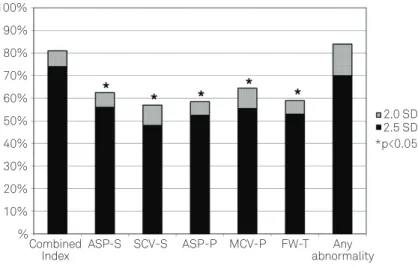
he sensitivity of the combined index was 81.0%, when using 2 SD as cutof point. Sensitivities of the other param-eters were: ASP-S – 62.5%; SCV-S - 57.0%; ASP-P – 58.5%; MCV-P – 64.5%; and FW-T – 59.0%. he combined index was more sensitive than any other isolated parameter (p<0.05). If any single abnormality was considered, the ive param-eters together yielded a sensitivity of 84.0%, which was not signiicantly diferent from the combined index. Using the same cutof point, the speciicity of the combined index was
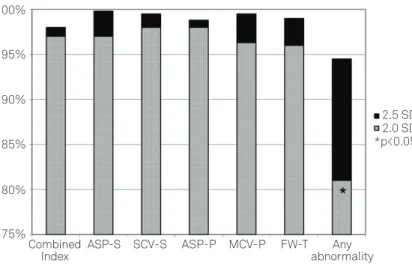
97.0%. Speciicities of the other parameters were: ASP-S – 97.0%; SCV-S – 97.0%; ASP-P – 98.0%; MCV-P – 96.3%; and FW-T – 96.0%. here was no signiicant diference in speciic-ity between the combined index and the other parameters. If any single abnormality was considered, the ive parameters together yielded a speciicity of 81.0%, which was less speciic than the combined index (p<0.05).
he sensitivity of the combined index was 74.0%, when using 2.5 SD as cutof point. Sensitivities of the other param-eters were: ASP-S – 56.0%; SCV-S – 48.0%; ASP-P – 52.5%; MCV-P – 55.5%; and FW-T – 53.0%. he combined index was again more sensitive than any other isolated param-eter (p<0.05). If any single abnormality was considered, the ive parameters together yielded a sensitivity of 70.0%, which was not signiicantly diferent from the combined in-dex. Using the same cutof point, the speciicity of the com-bined index was 98.0%. Speciicities of the other param-eters were: ASP-S – 98.0%; SCV-S – 99.8%; ASP-P – 98.8%; MCV-P – 99.5%; and FW-T – 99.0%. here was no signiicant diference in speciicity between the combined index and the other parameters. If any single abnormality was consid-ered, the ive parameters together yielded a speciicity of 94.5%, which was not signiicantly diferent from the com-bined index. Sensitivities of the comcom-bined index and of all isolated parameters with both cutof points are shown in Fig 1, while speciicities are shown in Fig 2.
DISCUSSION
his study showed that our combined index is more sen-sitive than isolated common nerve conduction parameters for diagnosis of clinically suspected diabetic polyneuropathy.
100% 90% 80% 70% 60% 50% 40% 30% 20% 10%
Any abnormality Combined
Index ASP-S SCV-S ASP-P MCV-P FW-T
2.0 SD 2.5 SD *p<0.05
%
If any single abnormality was considered, sensitivity of the combined index was similar to that of all parameters taken together; however, speciicity of the combined index was higher. his efect was observed only if the cutof point of 2 SD was used, but not with 2.5 SD. he probable cause for this discrepancy was insuicient power of the study; a larg-er numblarg-er of patients would be required to demonstrate the same efect when using the 2.5 SD cutof point.
How many diferent nerve conduction tests should be done to conirm diabetic polyneuropathy? It is logical that several tests would yield better sensitivity, but it also in-creases the chance of abnormal results with no clinical sig-niicance, thus reducing speciicity8. From the mathematical
point of view, if we considered ive independent tests with sensitivity of 60% and speciicity of 97%, sensitivity would in-crease from 60 to 99%. On the other hand, speciicity would decrease from 97 to 86%.
Our combined index had the advantage of enhancing sen-sitivity without losing speciicity. It was designed in the clini-cal context of diabetic polyneuropathy, and all parameters were afected in a similar way. he most sensitive parame-ters were MCV-P and ASP-S, as previously reported by Dyck et al.10, but we could not demonstrate signiicant diferences
between the parameters due to the small number of patients. Our combined index is possibly not suited for the diagnosis of other types of polyneuropathy, such as vitamin deiciency or Guillain-Barré syndrome, because these parameters are not af-fected in the same way. Dyck et al. have shown that composite scores were less sensitive than isolated motor conduction pa-rameters in patients with multifocal motor neuropathy11.
Combined nerve conduction indexes, also known as “composite nerve conduction scores”, have been used
successfully before1,4,7,8,10-13. Perhaps the most popular one is
the combined sensory index for carpal tunnel syndrome de-veloped by Robinson et al., which showed higher sensitivity when compared to isolated sensory latencies diferences8.
Even so, combined indexes have not achieved wide accep-tance, probably because they need some post-processing cal-culation and require well-established normative values.
A combined index provides better distinction between healthy and diseased subjects through the addition of mul-tiple trends from each individual test8. A combined index
should also be more reproducible, since it minimizes random experimental errors from isolated parameters, although we cannot demonstrate that with the present study. However, other studies have shown this efect4,7,11,14. A single parameter
that is more reproducible and more representative is better suited for patient follow-up or for longitudinal studies, in-cluding clinical trials6.
here is some discussion regarding which is the best mathematical approach for normative values: normal devia-tions or percentiles5,15. Z-scores assume a Gaussian
distribu-tion for the normative data while percentiles do not15. On the
other hand, percentiles require a larger normative sample15
and do not provide information on “how abnormal” is the pa-rameter, since they cannot see beyond percentiles 0 and 100. One great advantage of Z-scores is that they can be averaged while percentiles cannot. Percentiles have to be converted into standard deviations before they can be averaged11, which
is ine when dealing with values in the intermediate range, but may be inaccurate when dealing with abnormal values.
A troublesome problem about averaging Z-scores is what to do with unobtainable parameters. We chose a conserva-tive approach and excluded unobtainable parameters from Fig 2. Specificity of the combined index compared to isolated parameters in 200 non-diabetic patients with suspected
lumbosacral radiculopathy. SD: standard deviation; ASP-S: amplitude of the sensory potential of the sural nerve; SCV-S: sensory conduction velocity of the sural nerve; ASP-P: amplitude of the sensory potential of the superficial peroneal nerve; MCV-P: motor conduction velocity of the peroneal nerve; FW-T: F-M minimal latency of the tibial nerve.
75% 80% 85% 90% 95% 100%
2.0 SD 2.5 SD
*p<0.05
Any abnormality Combined
1. Feki I, Lefaucheur JP. Correlation between nerve conduction studies and clinical scores in diabetic neuropathy. Muscle Nerve 2001;24:555-558. 2. England JD, Gronseth GS, Franklin G, et al. Distal symmetric
polyneuropathy: a definition for clinical research: report of the American Academy of Neurology, the American Association of Electrodiagnostic Medicine, and the American Academy of Physical Medicine and Rehabilitation. Neurology 2005;64:199-207.
3. Dyck PJ, Overland CJ, Low PA, et al. Signs and symptoms versus nerve conduction studies to diagnose diabetic sensorimotor polyneuropathy: Cl vs. NPhys trial. Muscle Nerve 2010;42:157-164.
4. Solders G, Andersson T, Borin Y, Brandt L, Persson A. Electroneurography index: a standardized method to assess peripheral nerve function in patients with polyneuropathy. Muscle Nerve 1993;16:941-946. 5. Peng L, Wuu J, Benatar M. Developing reference data for nerve
conduction studies: an application of quantile regression. Muscle Nerve 2009;40:763-771.
6. Dyck PJ, O’Brien PC, Litchy WJ, Harper CM, Daube JR, Dyck PJB. Use of percentiles and normal deviates to express nerve conduction and other test abnormalities. Muscle Nerve 2001;24:307-370.
7. Tacconi P, Manca D, Tamburini G, et al. Electroneurography index based on nerve conduction study data: method and findings in normal subjects. Muscle Nerve 2004;29:89-96.
8. Robinson LR, Micklesen PJ, Wang L. Strategies for analyzing nerve conduction data: superiority of a summary index over single tests. Muscle Nerve 1998;21:1166-1171.
9. Heise CO, Toledo SM. Combined nerve conduction index for diagnosis of diabetic polyneuropathy. Muscle Nerve 2005;32:386.
10. Dyck PJ, Carter RE, Litchy WJ. Modeling nerve conduction criteria for diagnosis of diabetic polyneuropathy. Muscle Nerve 2011;44:340-345.
11. Dyck PJ, Litchy WJ, Daube JR, et al. Individual attributes versus composite scores of nerve conduction abnormality: sensitivity, reproducibility, and concordance with impairment. Muscle Nerve 2003;27:202-210.
12. Jabre JF, Sato L. The expression of electrophysiologic data as mean related values. Muscle Nerve 1990;13: 861-862.
13. Wennberg A. A neuropathy index based on sensory-motor electroneurography (ENeG). Acta Neurol Scand 1984;70:S107-S111. 14. Lew HL, Wang L, Robinson LR. Test-retest reliability of combined
sensory index: implications for diagnosing carpal tunnel syndrome. Muscle Nerve 2000;23:1261-1264.
15. Robinson LR, Temkin NR, Fujimoto WY, Stolov WC. Effect of statistical methodology on normal limits in nerve conduction studies. Muscle Nerve 1991;14:1084-1090
References
the averaged Z-score. his excluded the most abnormal pa-rameters from the analysis. Dyck et al. recommended a difer-ent approach: they would divide the averaged Z-score by the proportion of parameters used, increasing absolute obtained values11. In other words, if only 8 out of 10 parameters were
available, they would divide the averaged Z-score by 0.8. Yet another approach was suggested by Joe Jabre (personal com-munication): he would arbitrarily attribute a Z-score value of -4.0 to unobtainable parameters. Speciic abnormal values can also be attributed to unobtainable parameters4,13, such
as 1 µV for ASP-S or 30 m/s for MCV-P. All options presented here are arbitrary and cannot be established in control sub-jects. he use of any of these approaches would actually in-crease the sensitivity of the combined index, but not of the other isolated parameters.
Our study has some methodological problems. It is a ret-rospective study, and we had limited clinical data from the subjects. Symptoms alone have poor diagnostic accuracy in predicting the presence of polyneuropathy2. It would be
bet-ter to include clinical exam details in order to obtain more objective data conirming the presence of polyneuropathy, but this was not available in all subjects. Besides that, pa-tients with burning feet due to small iber neuropathy are not expected to have abnormalities in nerve conduction stud-ies. his could explain the low sensitivity of isolated parame-ters, but it also afected the combined index in the same way. Subjects older than 65 were excluded despite the fact that polyneuropathy is more common in older patients. his was
done because there is a higher chance of idiopathic polyneu-ropathy in this age group not related to diabetes mellitus. It also enhances the chance of unobtainable ASP-S or ASP-P with no clinical signiicance.
Our control group was not composed by healthy sub-jects. This could actually be an advantage, since healthy subjects are not referred for neurophysiological evalua-tion, and lumbosacral radiculopathy is an important dif-ferential diagnosis. However, patients with L5 radiculop-athy may occasionally show abnormalities in MCV-P or even in ASP-P, and patients with spinal stenosis could have abnormal FW-T (although subjects with bilateral symp-toms were not included), which means that specificity of nerve conduction studies could be even higher in normal subjects. The groups were also not comparable in terms of age or sex distribution, although Z-scores were corrected by age. Better designed prospective studies are required to confirm the utility of our combined index for the diagnosis of diabetic polyneuropathy.