Regulation and Informal Settlements in Brazil: A Quasi-Experiment
Approac
hAbstract
This paper discusses the relation between urban norms and informality and presents some evidence for Brazil using a quasi-experimental approach. Using a theoretical framework that relates the supply of house elasticity with the urban norms I argue and give some evidence that in developing countries a more stringent urban regulation would generate more informality while in developed countries it is expected to generate higher housing prices. But not all norms have equal impact. Zoning and land parceling norms seem to have a large impact on informal housing formation while the urban perimeter and building codes have small or no effect. This conclusion is strong and there are some important consequences to land policy issues. The findings are consistent with the dual market model presented in the paper and refute the notion that the formal and informal market are completely independent, since in this case we would expect no impact from regulation on the informal market. Also the idea that urban norms are not enforced in Brazil is very much questioned in this study by exactly the same argument.
Introduction
This paper assesses the impact of regulation on the size of urban settlements in Brazil. As is well know informality is increasing systematically in Brazil and in most
developing countries in the last 30 years or so despite all attempts made by the governments and international institutions. According to the United Nations
estimates, there is more than 1 billion slum dwellers worldwide accounting for 32% of the global urban population. In Brazil the situation is surprisingly (given the country’s income) not very different. There are many causes for informal (or irregular) housing settlements. In this paper I will deal with one possible cause of informality: excess regulation.
There are few papers in economics on the virtue of regulation on the (quality of) housing supply. Most of the analysis on housing demand or supply elements (including price) approaches the topic, as in the classic analysis of Bailey (1959), essentially as an application of the Coase theorem: land use regulation solves a property right issue. Not regulating building-height, for instance, would impede (the right of) each other’s view and access to sunlight. In other words, the regulation would eliminate negative externalities increasing the (total) welfare of city residents. Another important issue is related to imperfect information. Assuming that consumers do not know what reasonable standards are, setting quality standards (with
inspections) would also improve the welfare of the residents.
Giving that framework, the only debate remaining in the economics literature was comparing regulation with taxes or fees. The fundamental theorem of public finance states that you can get the same result using taxes or regulation so taxes will be at least as good as regulation to any policy goal. Some elements may concur with the classic theorem making regulation superior to taxes or, in some circumstances, taxing would not be feasible. In any case, there was a common sense that the standards defined by the regulation were virtuosi and the only economic question was the most efficient way to guarantee such standards. So, the debate was very much concentrated on the architecture and urban planning literature occupying a smaller role in the economics debate.
There is however a potentially vicious side of regulation. The debate was also more intense in the urban planning literature but there was an important contribution in the urban economics literature as well. The main debate in the 1970s was whether Tiebout-type equilibrium would concentrate income or not. In particular it was clear that zoning might be a way to segregate low-income households migrating to the city. This debate was influent on Proposition 2 ½ in Massachusetts and Proposition 13 in California.
Although the literature on the impacts of zoning on efficiency and distribution is relatively old, the debate was concentrated in just few regulations (essentially zoning). As is well known there are many different types of land regulation in the cities.
Actually, it is puzzling why the supply of housing has been outside the papers in urban economics, especially in general interest economic journals. The seminal papers from Alonso (1964), Mills (1967) and Muth (1969) that are considered key for the New Urban Economics literature rely on the interplay between housing markets and
the urban economy. However, urban economics and real estate economics developed as almost independent subjects.
One of the first attempts to understand the connection between the supply of housing and regulation was done by Mayo and Angel (1993). Malpezzi (1996) using the “Wharton Index” that was built in the early 1990s and accounts for many different urban norms and the time needed to approve a new development shows that an increase in regulation is associated with a less elastic supply of housing. Several analyses followed Malpezi’s and the theme got definitely on the mainstream very recently with the section “Regulation and the High Cost of Housing” of the American Economic Association in 2005 on this theme that was published in the 95th issue of the American Economic Review. The papers in this section1 are already significantly influencing the analysis of the supply of housing and urban growth.
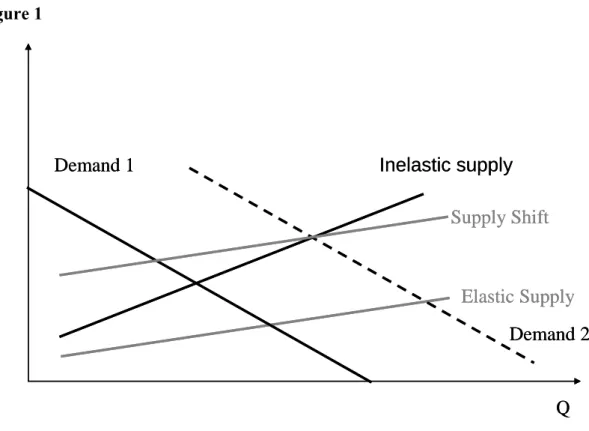
The main results are showing that increases in regulation are positively related with increases in housing prices. The main argument can be associated with the figure bellow proposed by Glaeser, Gyourko and Saks (2005). Regulation makes the supply of housing more inelastic so, an (exogenous) increase in the demand for housing in the more elastic (unregulated) city would imply in a lower increase in prices than in the regulated city. The stylized fact supporting their argument is a huge difference in price increases during the last 50 years: from a reduction in price larger than 40% in the lowest growing city to an increase of more than 5 times the value in 1950 in the fastest growing one.
Figure 1
P
Q
Elastic Supply
Inelastic supply
Demand 2
Demand 1
Supply Shift
P
Q
Elastic Supply
Inelastic supply
Demand 2
Demand 1
Supply Shift
Basic comparative static imply that exogenous demand shocks in cities with inelastic supply of land have larger increases in prices than in cities with more elastic supply.
1
Glaeser, E.L., J. Gyourko and R. Saks (2005), Quigley, J.M. and S. Raphael (2005) and Green, Malpezzi and Mayo (2005).
Regulation would make the supply of land less elastic. Another alternative is that regulation would shift the supply curve up to the dashed line in Figure 1. It is possible to make arguments for both sides (shift or change in elasticity) but in both cases the impact on prices and quantity could be the same2. If regulation makes the supply of land less elastic or shift it up, we expect prices to grow faster and quantity to grow slower in regulated cities than in their unregulated counterparts. There is evidence supporting both hypotheses. Regulations in the land use do increase segregation in the cities “protecting” residents against migrants although it is usually very difficult to check if it was through increased elasticity or through a shift in the supply curve. The main difficulty with this analysis is that it has a straightforward problem of endogeneity. Cities that are more likely to regulate are the ones that grew the most in the past3. In these cities, the supply of land is already inelastic since they are much more urbanized than the others. Most of the recent studies attempt to control for the endogeneity problem. However, not all the studies controlled for another related problem. The most regulated cities tend to be more problematic in terms of environment, open space, etc. As a result, the residents of these cities will value regulations more than residents in other regions.
Very few studies realize that in countries with weak institutions and higher indices of poverty, there is an alternative: building irregular houses, i.e. houses that do not comply with the norms. This is the case in most of the developing word. To the best of my knowledge, the only attempts to connect regulation with the (size of) informal market is Biderman (2006), Henderson (2007) and Lall, Wang and Da Mata (2006) where the evidence is blurred, i.e. regulation seems to be insignificant in the
determination of slum formation. Dowal (2007) and some works directed by himself like Avila (2007) gives some stylized facts about informality in Brazil also reasoning from the supply of housing point of view. All these papers seem to neglect the fact that in part of these settlements the tenants may not pay for the land. The anecdotic evidence, however, shows that the land is costless just for the first settlers.
This paper adds some evidence to the connection between informality and urban norms. The paper has 7 sections including this introduction. In the second section a model considering that formal and informal markets are substitutes goods produced with different technologies is proposed. The third section proposes some definitions of informality, explains which definition will be adopted in the empirical study and describes the dynamics of urban norms enactment in Brazil since the first federal regulation, law 58/37. The fourth section discusses the econometric strategy that explores the idea, currently standard in the evaluation literature, of a quasi-experiment. There is an opportunity for a “natural experiment” since some
municipalities enacted urban norms during the 1990s while some did not. The fifth section describes the data and the groups under analysis (municipalities that enacted the laws in the 1990s; the municipalities that enacted the laws before 1991; and municipalities that enacted the law after 2000 or that have never enacted the law). The sixth section briefly analyzes the determinants of the size of the informal market in Brazil in the 1990s and presents the result of the quasi-experiment analysis. A final section concludes the paper.
2
It is the same in Figure 1 by construction. 3
Although regulation in the U.S. is not connected to the city size as showed by Gyourko, Saiz, and Summers (2006).
A Dual Market
There are some ways we can add the supply of informal housing to the housing market in general depending upon the hypothesis about the (in)dependence of each market. Abramo (2003) based on case studies claims that there is no competition between each market. This would imply that the markets are not substitute to each other. My (very) anecdotic evidence would indicate that it is indeed complicated to buy a house in a Favela4 in São Paulo or Rio. You can buy it only if you know someone that currently lives there. Even so, the tenure would be guaranteed only if you keep good relations with the community especially if the Favela is dominated by drug dealers. If Abramo (2003) hypothesis is correct, we would expect urban norms to have no connection with the informal market since the norms (by definition) affect just the formal market.
In this paper I assume that the markets are inter-related, i.e. formal and informal houses are (imperfect) substitutes. Although the friction suggested by Abramo (2003) may exist, I think that it is quite difficult to believe that it would be so strong for the markets to be totally unrelated. This behavior can be justified by a random utility model where the individual will decide to buy a house in the informal market at a specific location if the attributes of this house (including the fact that it is informal) and the attributes of the location are higher than any other house given the buyer characteristics. On the other hand the production cost of each market will be different. More specifically, I will assume that (i) the informal market is more elastic than the formal and (ii) regulation affects only the production cost of the formal housing market. It is possible to move from one market to another (from the consumer
perspective) but the determinants of cost in each market may not be directly related. It is not a problem to the model if some costs in each market are related but regulation might affect just the formal market. Given these assumptions, with minor
modifications, we can think about the dual market in the same fashion as we did in Figure 1.
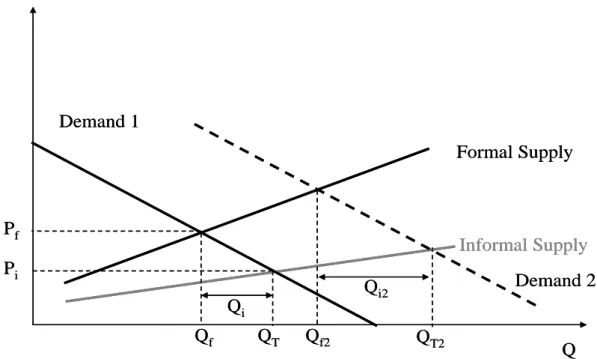
In Figure 2 the formal supply is represented by the black line and the informal supply is represented by the grey line. The demand is originally at the solid line (Demand 1). At this level of demand, the equilibrium quantity of the formal market is Qf and the price is Pf. The total demand for housing is QT so QT-Qf=Qi and Pi is the equilibrium price in the informal market. In this imperfect substitutes model it is possible to have different prices in each market. When there is a demand shock and the demand moves outward from Demand 1 to Demand 2 (the dashed line in Figure 2) both markets increase equilibrium quantities and price but the increase is larger in the informal market than in the formal market. This is a consequence of the assumption that the informal market is more elastic than the formal one. Under this assumption, the fact that the informal market for housing is increasing at a faster pace than the formal may not be connected with any institutional change.
Figure 2: Impact of a Demand Shock over the Formal and the Informal Housing Market
4
Favela is a Brazilian name for a specific kind of squatter. The characteristics of this typology have changed in the last 20 years but in general represent a settlement in a invaded (often public) land with self-help built houses in urban areas.
P Q Informal Supply Formal Supply Qf Qi Pi Pf Qf2 Demand 2 Demand 1 Qi2 QT QT2 P Q Informal Supply Formal Supply Qf Qi Pi Pf Qf2 Demand 2 Demand 1 Qi2 QT QT2
In Figure 3 we compare two cities with different elasticities in the supply of housing. As in Figure 1 we are assuming that the more regulated city has a less elastic supply of formal housing than the less regulated one, i.e. we are considering cost increasing regulations. However the elasticity of the informal market is the same in both markets since the only difference between the two cities is in the stringency of regulation. Notice that the more regulated city increases the equilibrium quantity for informal housing at a faster pace than the less regulated one. The increase in the informal market due to regulation can be measured by Qf2-Q’f2. This result will be explored in the estimation procedure. The result would be the same if the supply of housing in the more regulated city had the same elasticity but it was shifted up given the extra cost associated with regulation but this case is not considered to make the analysis more readable. The cost increasing regulation incentives informal housing that does not have to comply with the norms. So the original concern of the legislator (a better urban environment) is not achieved.
Figure 3: Impact of a Demand Shock over Two Cities with Different Cost-Increasing Regulation
P Q Informal Supply Formal Supply (unregulated city) Qf Qi Pi Pf Qf2 Demand 2 Demand Qi2
Formal Supply’ (regulated city)
Q’f2 Q’i2 QT QT2 P Q Informal Supply Formal Supply (unregulated city) Qf Qi Pi Pf Qf2 Demand 2 Demand Qi2
Formal Supply’ (regulated city)
Q’f2
Q’i2
QT QT2
The analysis of this dual market is particularly interesting in Brazil because there is a group of municipalities that implemented land use regulation during the 1990s and another group of municipalities that did not. Since there are some proxies for informal land use in both the 1991 and 2000 census (see discussion below) and information on the date of land use regulation implementation (for six broad types of regulation, see below), it is possible to compare the change in informal housing in cities that adopted the regulation in the period (treatment group) with the change observed in
municipalities that remained unregulated (control group 1). Notice that we can also use the cities that were regulated before 1991 as an alternative control group (control group 2). Based on Figure 3, we expect the (average) impact on the treated to be higher under control group 1 than under control group 2. What is interesting about the comparison with the analysis with both groups is testing if the difference is actually lower, that would confirm the hypothesis behind Figure 3. Also, if the urban norm takes some time to be enforced, we would expect the (average) impact on the treated to vanish under control group 2. So, the analysis of each group would give us insights both on the validity of the model assumptions as on the time necessary for
enforcement.
It is also important to notice that, in general, the impact of cost increasing regulation on the growth of informality may be positive or negative. A cost increasing regulation may impact negatively on immigration to the city. So, we may observe a regulated city where the growth in informal settlements was lower than in the not regulated counterpart. However, this is not a problem in this analysis since we will compare cities that had the same population growth as is implicit in Figure 3. So, if cities that adopt cost increasing regulation during the 1990s increased informality at a faster pace than municipalities that has the same growth in population but did not implement such norms we can say that the formal and informal housing markets are inter-related and that the regulation was responsible for such change.
Informality and Regulation in Brazil
There are many alternatives for defining if a house is informal or irregular. Using 1991 and 2000 demographic census data one alternative, adopted by Lall, Wang and Da Mata (2006), is using the concept of subnormal census block. To be considered a “subnormal agglomeration”, the block has to satisfy the following three conditions: (i) a nucleus (group) made up of over 50 housing units, (ii) land occupation is illegal, and (iii) meets at least one of the following criteria of (a) urbanization in a disordered pattern (for example, narrow and winding roads) and (b) lack of essential public services and utilities. The typology is very appealing since it includes both irregular and illegal units. The main problem with this proxy is that the municipality is in charge of defining if a block is subnormal or not.
Another definition of informal housing somehow adopted by Dowal (2007) assumes that a house that is not served by public utilities is informal. The main problem with this definition is that the supply of public services like water and electricity has been growing in Brazil in the last decades. The only proxy that would capture the actual pace of growth in informal housing is sewage connection. So, a reasonable proxy for informal housing would be the connection to the sewage network. There is still another problem with this definition. It does not allow analyzing the trend in the 1990s after the 1988 constitution when many illegal or irregular settlements received public services.
The third proxy adopted in Avila (2007) and Biderman (2006) is defining a house as informal when the resident owns the house but does not own the land. This is usually the case in illegal settlements. The problem with this proxy is that there might be irregular houses with secure land tenure. If the regulation is affecting e.g. the
construction cost, inducing new tenants to choose irregular settlements, there might be no increase in houses without titles although there was actually an increase in
irregular settlements. This problem may not be so intense in the definition above (lack of public services) but it is also not guaranteed that a house with public services is actually complying with the urban law. The main problem with the “no titling” variable is that it cannot be used in 1980 or 1970 demographic census so it is not possible to make a long term analysis of the informal market in Brazil. One appeal of the definition is that it seems to be very precise. For the 830 municipalities with reliable cadastre for informal settlements the correlation between the number of units measured by the census variable and the number of units reported by the
municipalities is 95%.
The proxies for informal or irregular housing have an institutional counterpart. During the dictatorship period (1964-1985) the City Hall was not allowed to supply public services for illegal settlements. So, if the owner of the house had no title, the
municipality could not furnish the services and vice versa, i.e. the municipality could not provide title to a property located in non-serviced land. The developer was expected to furnish all the distribution networks inside the subdivisions plus lot connections to have a new development approved. The truck infrastructure (e.g. large sewerage mains and pipe connections) was always (and it is still) a responsibility of the municipality or other government level (subject to the constraint above). In some cases the developer would start the project without the distribution network inside the settlement with a temporary license and usually leave part of the land for the
developer would often not implement the infrastructure and the public land inside the settlement (left as collateral) would be occupied. Those houses would probably be classified as illegal but other houses may have a land title but not a construction license. So, in practice we can observe houses with no sewage connection and secure land tenure or the other way around.
Until 1979 the federal legislation was not very specific about the type of urban regulation that was expected from the municipalities. The autonomy of the
municipalities in defining the urban norms was reinforced in each new federal law but no comprehensive guideline was ever issued. The 6.766/79 Law is much more explicit about the urban norms and the authority of the municipalities over it. This law is still very influential in the urban norms regulation. The municipalities were not recognized as federal entities until the 1988 constitution. The federal law determined some
standards such as a minimum lot size of 125 square meters5 but left some norms to be defined by the municipality such as maximum Floor-Area-Ratio (FAR); urban
boundary growth; parceling standards; etc. A major change in terms of enforcement was that not complying with the norm would be considered as a crime. All previous legislation did not clearly define the penalties for not compliance.
Although the 1979 federal law was the first to explicitly require compliance with urban norms, some municipalities had already enacted urban regulations long before the federal legislation. The first norm adopted in most municipalities was the building code. Some municipalities have that norm as early as in 1929. However, very few municipalities had implemented the norm prior to the mid 1960s. In the second half of the 1960s the number of municipalities that have implemented the law began to grow steadily. Currently some 2.5 thousand municipalities have a building code.
Municipalities in Brazil began defining urban boundaries in the 1940s with some anecdotic examples dating back to the 1930s. It is relevant to note that urban boundaries have a special meaning in Brazil—it defines the official built-up area. Although the entire municipality is under direct responsibility of the local
government, the municipality is not supposed to furnish certain basic public services beyond the urban boundary—as for example, water supply. Although the restriction is not strictly enforced now, during the military regime (1964-1985) it was very difficult for a municipality to provide public services outside the urban boundary as, by
definition, urban development outside the boundary is illegal.
The number of municipalities with a Master Plan has grown steadily starting in the early 1960s. There is a clear jump in the early 1990s and this is connected to the 1988 constitution that declared municipalities to be federal entities with constitutional power to legislate and tax. Of course many municipalities already legislated and taxed before that date, but the new constitution gave extra incentives for municipal
planning. The practice of zoning also started in the early 1950s and has grown
uniformly until the late 1990s when it drops considerably. The drop may be connected to the fact that zoning may be included in the Master Plan thus not warranting a separate norm. Less than 200 municipalities had Master Plans or zoning until 1979. Currently more than one thousand have a Master Plan and more than 1.5 thousand have zoning regulations.
5
In the 1960s municipalities started implementing a new type of regulation called parceling, or subdivision norms, which marked a new way of addressing urban development. While urban boundaries just define where the development might or might not occur, and building codes just regulate construction standards, parceling norms define how land within the urban boundary can be subdivided. It defines land uses, service standards and the characteristics of the lot for converting raw land to urban use. The number of municipalities with parceling norms increased up to the early 1980s, stayed almost the same for several years and resumed growth in the 1990s, peaking by the end of the decade.
The 1979 legislation considerably increased the requirements for registering a house. The law established urban standards (some to be determined by the municipality) that should be met by the settlement as a condition for the approval of the development. To register a house after the law it became necessary to obtain 12 certificates, unless the house was located in a settlements developed before 1979. The law reinforced private property guarantees but connect the property title to the compliance with the law. Moreover, the municipalities were forbidden to build trunk infrastructure in non-regularized settlements. This requirement was intended as a strategy to promote the enforcement of the law. Although the intention was good, i.e. to protect buyers in the housing market and to guarantee urban standards, it resulted in making it much more difficult for the poor to regularize their properties. In fact, the law ended up hurting one of the groups that it intended to protect.
The negative effect of regulation was identified in the late 1980s and the legislation attempted to take the problem into account by creating different rules for the poor and for the rich. Of course it is very difficult to discriminate, so the legislation created the concept of “Special Interest Zones” (ZEIS) where urban norms can be made more flexible at the discretion of the municipality. Although some municipalities claim to have implemented ZEIS in the 1970s, given the institutional framework at that point it is not very likely that what was done at that time is actually comparable to the current special zone. The ZEIS were clearly boosted by the 1988 constitution, although we do know of some early experiences in the city of Recife (PE) where social interest zones were defined as early as 1987. 6
By the 1990s, the implementation of ZEIS was still slow compared to the
development of other local urban norms. In 1999 452 municipalities declared having ZEIS (1999 MUNIC). Data on ZEIS were not disclosed in the 2001 or 2005 MUNIC, but only dichotomous information indicating whether the municipality had
implemented the norm or not. Based on that, 200 more municipalities enacted ZEIS by 2001 and another 900 did so by 2005. Once again the rate of implementation is connected to the institutional development. The first institutional change was the Law 9.785/99 that replaced Law 6.766 making it considerably easier to register a house inside a ZEIS.7 The second change occurred in 2001 with the issuance of the “City Statute” (Estatuto da Cidade) that, among other things, emphasized the social role of the property already stated in the 1988 constitution.
6
Law 6.766/79 already legislate special interest zones e.g. environment protection zones to be defined at the state level.
7
For instance, a typical house outside a ZEIS needs 12 documents to be registered while a house inside a ZEIS needs just 3.
Econometric Strategy
The empirical strategy is an immediate application of Figure 3. Since we have municipalities implementing urban norms between 1991 and 2000 (treatment group), municipalities that did not implement the norm during that decade (control group 1), and municipalities that have implemented urban norms before 1991 (control group 2), we can conduct a quasi-experiment analysis comparing the increase in informal market in the treatment group with control group 1. Of course it is not easy to actually define in which group a municipality is. The 2005 MUNIC gives the original date of enactment for several norms but does not list the last update. The 2001 survey does not disclose any information on enactment year although the information was collected.8 Another problem is that sometimes not all the norms are approved in the same year. In this case, if they were approved in the same period (before 1991; 1991-2000; after 2000) it is be possible to combine the municipalities in the same group. Otherwise, one would need to have enough information to study each law separately as discussed below.
Assuming that we can construct the groups, the question posed is essentially the same as in the evaluation of any social program. A standard method for evaluating social programs uses the outcomes of non-participants to estimate what participants would have experienced had they not participated in the program. The difference between outcomes of participants and non-participants would be the estimated gross impact of the program. The empirical strategy adopted is to use exactly this estimative as a measure of the impact of the regulation on the size of the informal market, i.e. the gross impact of the regulation will be measured by the difference between the outcomes of municipalities adopting regulation in the 1990s (treatment group) and municipalities that did not adopt any regulation until 2000 (control group 1). The main shortcoming of the analysis is the same as in the evaluation of any social program. The outcomes of municipalities adopting regulation in the 1990s (hereafter regulated municipalities) and municipalities that did not adopt any regulation until 2000 (non-regulated municipalities) differ systematically from what the outcomes of regulated municipalities would have been without adopting the regulation, producing selection bias in the estimated impacts. Following the literature on social program evaluation9 it will be assumed that each municipality has two possible outcomes:
) 0 ( ) 1 ( and t t Y
Y in the regulated and non-regulated states, in period t, respectively.10 The gross impact of adopting the regulation could be measured by Δt =Yt(1)−Yt(0). The problem of evaluation arises because only Yt(1)or Yt(0) is observed for each
municipality but never both. That is, it is impossible to know the outcome of a municipality had it not adopted the regulation, given that it has adopted it. The alternative is comparing the regulated municipalities with non-regulated municipalities conditional on observed variables.
To make this comparison, the outcome of municipality i in period t (Yit) is assumed to
depend on a vector of (observed) municipalities characteristics (Xit). The over
8
The original date of the specific law in 2005 (except for Master Plans) was also not disclosed to the public but IBGE kindly furnished me access to this information.
9
This goes back to Fisher (1935). 10
increase in informality associated with the implementation of the regulation depend on a dummy variable (dit) that equals 1 if the municipality implemented the norm in
the previous period and 0 otherwise. To account for unobserved characteristics, a mean zero disturbance (Uit) is assumed. A linear version of this specification is:
k t U Y k t U d Y it it it i it it it < + = > + + = , , ) 0 ( ) 1 ( β X β X α (1)
Where k is the period when the norm was actually enacted, E(Uit) = 0 and Uit is
independently and identically distributed (i.i.d.) across municipalities. That is, the main goal of this study is estimating
α
. The decision of enacting a norm may be determined by the party in power, the voters or both. Whatever the specific content of the norm, it can be described in terms of an index function framework. Let INi be anindex of benefits (to the appropriate decision maker) of enacting a norm. It is a function of observed (Zi) and unobserved (vi) variables:
otherwise d IN iff d V Z IN i i i i i i 0 0 1 = > = + =
γ
(2)To estimate
α
a very complete set of information is need (that is rarely available) or additional assumptions have to be made regarding the (stochastic) dependence of the variables above. In many cases it is not possible to efficiently estimateα
with cross-section data if there is no regressors in equations (1) and (2). Most cross-cross-section estimators require a regressand in the decision rule (2) although it is possible to avoid most of the requirements with longitudinal data. The vector of municipalcharacteristics is not very problematic for this study since it is well established that (a) municipal characteristics do play a role in the outcome and (b) there is a large amount of information on municipal characteristics for Census years 1991 and 2000.
To carryout the analysis, a comprehensive database was built based on three main sources of information: census data for 1991 and 2000; the MUNIC survey for 1999, 2001 and 2005; and fiscal information on the municipalities (revenues and
expenditure) for 1992, 1996 and 2000 from the Brazilian Treasury Secretariat (Secretaria do Tesouro National—STN). Census data will be used to construct the dependent variable (number of informal/irregular dwellers) and some control variables such as income and population. The MUNIC will be used to construct the treatment and control groups, and the fiscal data will be an important control for differences in municipalities’ investment in housing.
The starting point of the analysis is identifying the groups described in the previous section. Enough information on each group is needed to make a robust analysis. In theory one would be able to work with 5,507 observations (the number of
municipalities in Brazil in 2000). However, many of those municipalities did not exist in 1991. During the 1990s many municipalities were created in Brazil by splitting the original area in two or more new units. In 1991 there were 4,491 municipalities. So, not considering the municipalities created after 1991 or the municipalities that existed in 1991 but split between 1991 and 2000, the sample is reduced to 3.5 thousand
municipalities. Also, some municipalities did not inform the relevant variables to the STN or to the MUNIC survey, so these had to be dropped from the sample as well. This approach differs from the one adopted by Lall et all (2006) and Avila (2007). These authors used “minimum comparable areas” (Areas Mínimas Comparavies— AMC) developed by the Brazilian Institute of Applied Economic Research (Instituto de Pesquisa Economica Aplicada—IPEA). The AMC are regions artificially defined in such a way that municipalities that split in the period are aggregated together again to form the AMC. I decided to discard the municipalities that split because I believe that the correct unit for this analysis is the municipality and not an agglomeration of municipalities. My rationale for making this choice is the fact that the law is
municipal so it impacts just the (new) houses within the jurisdiction of the
municipality. The way that other researchers dealt with AMCs was by weighting the norm indicator by population. In other words, they recognized that not all houses were subject to the regulation but just the portion of the houses that were located in the municipality that enacted the norm.
Impact of Regulation on Informality
The estimation of ATE will be done using 6 different methodologies, three parametric and three non-parametric. For the parametric estimations we need to know which control variables to include in the specification. The non-parametric analysis also needs control variables to build the propensity score that will guide the analysis. The data suggests that municipal expenses on housing do play a role in reducing
informality but municipality’s income (or its distribution) is irrelevant to the
informality level. This may be due to a lack of distribution capacity. But it can also be connected with two contradictory effects of income. On one hand, richer
municipalities would have more resources to deal with informality. On the other hand, a richer municipality may have higher land prices inducing households to find cheaper alternatives.
Poverty does explain part of the level of informality although the endogenous nature of this variable may result in contradictory signs. When using lagged variables
(supposedly exogenous to the current level of informality) poverty has the correct sign and it is significant. Population is the single variable that explains the larger part of informality. Comparing two municipalities with the same proportion of poverty the larger one will also have a larger proportion of informal housing. This result has some implications for land policy since one cannot assume that informal houses are a straight consequence of poverty. The structure of the labor market also has effects on informal settlements. Coherent with some anecdotic evidence, a (initial) larger proportion of manufacturing seems to induce more informal housing formation. The political variables indicate that there might be a “political economy” side of the informal housing formation in Brazil. It is relevant to consider that during the military period (1964-1985) the provision of services in informal settlements was not
permitted and after the 1988 constitution (already with a civil president, although not directly elected) some municipalities began upgrading slums based on the “social function of the land” stated in the constitutional text. Political parties associated with informal settlements will tend to support those dwellers when in power. The data suggests that municipalities with more votes for PT will have more informality. This is a question that needs to be carefully studied but it is out of the scope of this paper.
To test the impact of regulation on informality all the test were run both restricting the analysis to the common support of the treatment group and not restricting it. On Table 2, the second column shows the estimation based on a simple OLS regression of the outcome variable (informal housing) in 2000 regressed on the lagged (1991)
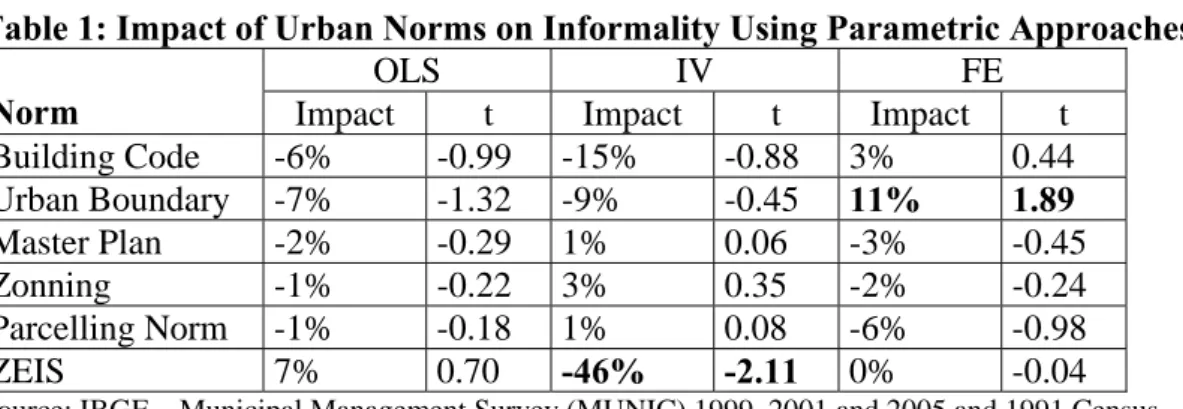
significant variables described in the previous section. This regression does not produce any significant (at 90%) coefficient for the dummy variables representing the norms. Furthermore, the signs of the coefficients are exactly the opposite of that would be expected, i.e. enacting a norm would reduce informality except for ZEIS that would increase informality, even though ZEIS was the only norm expected to decrease informality since it makes the urban norm more flexible.
As discussed in the econometric strategy section above, the OLS is biased for estimating ATE unless we impose very strong assumptions. There are many techniques to correct for this bias. One originally proposed in the seminal paper by Rosenbaum and Rubin (1983) uses the probability of implementing the program to correct for the bias. The estimator is calculated in two steps. In the first step the probability of program implementation is estimated using a probit or a logit model.11 In the data section I estimated and presented some results on the probability of a municipality enacting an urban norm in the 1990s. The norm enactment dummy is instrumented by the estimated probability and the other independent variables. The results from this estimation are presented in Table 4 and labeled “IV.” The only significant result (at 90% or more, highlighted in bold) is the implementation of ZEIS that would reduce the level of informality as expected. The building code and urban boundary are still with the unexpected sign but all other norms have the expected sign.
The third method is known as difference-in-differences since it compares the
difference in the outcome and then again the difference between treated and control. This is done by using a fixed-effects regression. For this estimator, the only
significant result (at 90% or more) shown in bold in Table 4 was for urban boundary that was positive, i.e. municipalities that defined urban boundaries have more
informality than “identical” municipalities that have not done so.
Table 1: Impact of Urban Norms on Informality Using Parametric Approaches
OLS IV FE
Norm Impact t Impact t Impact t
Building Code -6% -0.99 -15% -0.88 3% 0.44 Urban Boundary -7% -1.32 -9% -0.45 11% 1.89 Master Plan -2% -0.29 1% 0.06 -3% -0.45 Zonning -1% -0.22 3% 0.35 -2% -0.24 Parcelling Norm -1% -0.18 1% 0.08 -6% -0.98 ZEIS 7% 0.70 -46% -2.11 0% -0.04
Source: IBGE – Municipal Management Survey (MUNIC) 1999, 2001 and 2005 and 1991 Census. The problem with the difference-in-differences approach in this case is that it requires the use of contemporaneous variables and there seems to be an endogeneity problem. In this sense, the IV estimator may be more efficient than the FE approach since it
11
allows for the use of cross-section. So, in the IV estimator, both the independent variables and the instruments will be from 1991 while the outcome will be from 2000. The problem with all parametric approaches presented on Table 4 is that the
significance over the parameters is sensitive to the specification used and to restrictions imposed on the sample. For instance, when I restrict the sample to be consistent with the common support of the treated group (as done in all parametric estimations)12 most of the coefficients are not significant. So, my next step is to attempt some non- parametric approaches that would not depend on the specification. As discussed in the data section, I have to compare municipalities that are as similar as possible and to do so I use a single measure (propensity score), as used for the enactment of the norm in the IV estimation discussed above. However, the probability that two municipalities will have exactly the same propensity score is in principle zero since we have continuous variables defining it. One way to use the propensity score in practice is by taking each “treated” unit and searching for the control unit with the closest propensity score. The closest match is the “nearest neighbor.” Then the ATE is calculated by averaging the difference in the outcome variable between the “treated” and the “nearest neighbor” in the control group.
Table 2: Impact of Urban Norms on Informality Using Non Parametric Methods Restricted to the Treatment Common Support
Nearest
Neighborhood Stratification Kernel
Norm Impact t Impact T Impact t
Building Code 14% 1.087 10% 1.056 7% 0.805 Urban Boundary -8% -0.627 -8% 0.114 -8% -0.835 Master Plan 32% 1.144 13% 0.209 10% 0.515 Zonning 48% 1.538 49% 0.284 57% 2.153 Parcelling Norm 53% 1.861 10% 0.323 11% 0.411 ZEIS 11% 0.622 16% 0.124 27% 2.096
Note: Standard deviation estimated by analytical form when feasible and by bootstrap otherwise. Source: IBGE – Municipal Management Survey (MUNIC) 1999, 2001 and 2005 and 1991 Census. Using the nearest neighborhood as matching criteria very few estimations of the ATE are significant. The parceling norm is the only that show significant impact.
According to this estimation, enacting a parceling norm would increase the level of informality by 53%. All other norms are not significant for the level of informality. However, except for urban boundary for which the estimated impact is negative and for ZEIS for which the estimated impact is positive, all other signs are coherent with the theory. It should be noted however that the significance for both urban boundaries and ZEIS is the lowest using this estimator.
The problem with the nearest neighborhood matching is that, by construction, all treated units find a match. However, some of this matching may be quite poor since for some treated units the nearest neighborhood may have a very different propensity score but nevertheless it contributes to the estimation of the impact. One alternative is
12
In this case it is necessary to restrict the analysis to the common support in order to “compare comparables” as discussed in the data section. It is possible to drop this restriction in the
non-parametric approach since we will be using a matching method that would guarantee the matching on a case by case basis. I will come back to this point soon.
to use what is called stratification. This method consists in dividing the range of variation of the propensity score in intervals such that within each interval the treated and control units have the same propensity score on average. This may imply
eliminating some municipalities from the treatment group.
Using stratification I find no significant impact from any norm. Once again the only unexpected sign is for urban boundary and ZEIS. The problem with stratification is that it discards observations in blocks where either treated or control units are absent. In other words, stratification may discard too many observations while nearest neighborhood may discard too few. The insignificance observed in this indicator suggests possible problems associated with the number of treated municipalities. An alternative is the Kernel matching where all treated units are matched with a weighted average of all controls using weights that are inversely proportional to the distance between the propensity-score of treated and control units.
Using Kernel matching, two norms are significant: zoning and ZEIS. While zoning is significant and have the expected sign, this is not true for ZEIS which, once again, shows a positive impact. Instead of reducing informality, ZEIS would increase it. As observed before, the (non-significant) impact of urban boundaries is negative using Kernel. All other norms are coherent. One potential problem in the above analysis is that is constrained to the common support of the treated in all estimations. Although the quality of the matches may be improved with this constraint, quality matches may be lost at the boundaries of the common support.13 So I re-estimate the parameters without this constraint.
Not restricting the analysis to the common support increases the significance of the estimators in general. In particular it makes the positive impact of zoning significant (at 90%) using the nearest neighborhood matching and it is still significant in the Kernel estimation. The coefficient is marginally lower but is still very high. According to that estimation, a municipality with zoning norms would have 53% more informality than its counterpart without zoning. Not constraining the analysis using the stratification matching method does not change the results: no impact is significant at 90%. Also the Kernel matching method not constraining the sample gives results virtually identical to the constraint estimation.
Although the analysis reveals few significant (at 90%) impacts, in general the signs are coherent except for urban boundaries and ZEIS. However, if I relax the
significance level to 68% (or one standard deviation) the average impact of
implementing the norm on treated will be significant (and positive) in other instances. Not considering the OLS estimation, given its alleged bias, we can see that even with the relaxed “threshold” the negative sign for building code (found in some estimators) is never significant. On the other hand, it will be positive and significant (at 68%) in three other estimations.
When relaxing the level of significance one can also notice that in two estimates the issuance of a master plan would be significant for increasing informality in two cases and for zoning in one more estimator (nearest neighborhood). All other norms are not affected by the relaxation of the threshold for considering the impact significant.
13
What is interesting is that, except for ZEIS, the impact of the norm is always positive. That is, the results do suggest that the enacting regulations will induce more
informality. It also suggests a certain hierarchy among norms. Zoning and parceling norms tend to induce more informality while building codes and urban boundaries have lower impact. Master plans are somehow in between but the impact is not significant at 90% in any estimation.
It is possible to understand why urban boundaries may not be significant for increasing informality. Since the Brazilian legislation limits the collection of the property tax by the municipality to the area within the urban boundary, there is an incentive to municipalities to define very large urban boundaries. Further, while the municipality is responsible for furnishing some services within the urban area, it is also allowed to define urban expansion areas (“áreas urbanizáveis”), i.e. areas in which the municipality does not need to make any service investment (because it is not yet urbanized) but where it can collect property tax. In brief, the municipality has a large incentive for defining very far urban growth boundaries.14 If the urban
perimeter is large enough this particular norm would have no impact on (formal) house prices and consequently gives no incentive for informal housing formation. It is not so easy to interpret the non-significance of building codes. The enactment of building codes is supposed to increase the costs of construction in general. While establishing urban growth boundary was significant at 90% in just one estimator, the building code norm was not significant at 90% for inducing informality in any estimator. However, it should be noted that the urban growth boundary was
significant at 90% just in one case, i.e. in the difference-in-differences estimation. As discussed before, this estimator is problematic since it is parametric and very sensitive to the specification adopted. Although the implementation of building codes is not significant at 90% in any estimator, it is significant in three out of six non-parametric estimations at 68%.
The impact of zoning in informality is the most robust. Considering just the non-parametric estimators, it is not significant only when I used stratification matching. As discussed above, this method may eliminate too many observations and usually will derive less significant estimators. Zoning is also not significant at 90% using nearest neighborhood matching if I restrict the sample to the common support of the treated group, but it is significant at 68%. When the constraint is eliminated, it is significant at 90% also using the nearest neighborhood matching methodology. So, the evidence is robust that implementing zoning will induce more informality. As is well known, zoning is a strategy for segregating the poor from certain parts of the city. In this case instead of segregating the poor the norm was probably pushing them to informality. If the municipality does not furnish services to informal settlements, the strategy would work as well since revenues from local taxes would not be distributed to the lower classes.
14
The situation may change in the 2000s since all municipalities with more than 50 thousand inhabitants are required since that date to have a master plan and the master plan should comprehend the whole urban perimeter. I know two cities that are reducing their urban perimeter in order to keep the plan at a reasonable cost. However it is far from clear if the new perimeters will represent an improvement or not.
Parceling norms have also a very high impact on informality but it is not significant in so many analyses as zoning. It is significant at 90% only when we use nearest
neighborhood matching (constraint to the common support of the treated or not). The problem is that parceling may not actually mean a more stringent law. For instance, regarding lot size, the lack of municipal regulation may be interpreted as if the federal law would be enforced, i.e. the minimum lot size would be 125 square meters. So, municipalities with parceling norms may have (implicitly) exactly the same
(minimum) lot size as municipalities with no norm. If the municipality defines a lot size larger than 125 square meters then the law in this municipality would actually be more stringent than in other municipalities that did not implement the norm. This is not the case for zoning since law 6.766/79 was not explicit about zoning regulation. Parceling often regulates other standards besides lot size so we do expect
municipalities with parceling norms to have a more inelastic supply of formal houses but the difference may be small depending on the comparison group.
The impact of master plans on informality is lower than zoning or parceling norms but higher than building codes or urban boundaries in terms of magnitude. However the result is not robust since it is not significant at 90% in any estimator although it is significant at 68% in the nearest neighborhood estimation (both constrained and not constrained). The problem is that master plans can increase the stringency of urban regulations or not. The few master plans that I know do (potentially) increase the cost of a development but at the same time do relax some urban norms for the poor. So, the problem with the estimation is similar to that with parceling. Depending on the specific plan we may be comparing municipalities in the treatment group that do not have a more stringent law than the control.
The result for ZEIS is much more complicated than the findings regarding the other urban norms. ZEIS is significant for both the nearest neighborhood and Kernel matching if we do not constrain the sample to the common support of the treated. The problem is that it is positive but we would expect a negative impact since ZEIS makes the urban norm more flexible. The only negative coefficient happened in the IV estimator that is sensible to the specification adopted. The problem with ZEIS is that it does reduce informality on the designated area. On the other hand it gives
incentives for more informality by signaling that getting property titles or the services is more likely in the municipality that uses ZEIS.
Once again our anecdotic evidence shows that the signaling effect did occur both in Diadema and in Recife. When an informal settlement is declared as a ZEIS, the houses immediately increase its value given that the likelihood of service-upgrading and titling increases considerably. The way to cash it in is cashing it out so many dwellers would sell their house and buy a new one in an informal area that is not inside a ZEIS. What one observes is a net increase in informality, i.e. municipalities that implemented ZEIS may be increasing the informality by more than the titles distributed in the designated special zone.
All in all the results seem to be consistent with the dual market model presented in the second section of the paper. The signs are consistent and the specificities of each law can also explain the lack of significance in some estimations and also the opposite result found just for ZEIS. It is very hard to support the hypothesis of two completely different markets proposed by Abramo (2003) given the evidence presented in this
study. If the formal and informal market were completely independent we would expect no impact from regulation on the informal market. Also the idea that urban norms are not enforced is very much questioned in this study by exactly the same argument.
Conclusions
This paper discussed the relation between urban norms and informality and presented some evidence for Brazil using a quasi-experiment approach. Using a theoretical framework that relates the supply of house elasticity with the urban norms I argued and give some evidence that in developing countries a more stringent urban regulation would generate more informality while in developed countries it was expected to generate higher house prices. This argument is very much related to Henderson (2006). What is interesting is that the “perverse” goal of the regulation may be similar in both developing and developed countries. In both cases regulation may be used to segregate the poor. This argument is more straightforward when the impact is on price. The segregation mechanism in developing countries is more subtle. Since informal settlements do not have basic public utilities, there is no redistribution from the rich to the poor living in the same city.
The studies on informal or irregular housing in Latin America have relied basically on case studies. The case studies helped explain part of the results discussed in this paper and also helped formulate some hypothesis. Of course, by construction, the case studies do not allow generalization of the findings. This study relies mainly on demographic census data. The main advantage of using census data is that it is extremely inexpensive compared to a survey if we consider the coverage. Also, similar information regarding informality can be found in other Latin American countries, as for example in Argentina. It is surprising that few studies have used census for analyzing the informal housing market. There are some important descriptive studies such as Pasternak (2001) or Cravino (2003) though.
While poverty is one of the main determinants of informal house formation, there are other relevant factors such as lack of land, insufficient (or misguided) public housing policy and excessive regulation—the latter is the focus on this paper. I estimated the impact of some urban norms on the growth of informal housing using census data and information on the date when the norm was enacted. One important conclusion of this study is that it is possible to use census data to study the informal housing market not only in Brazil but in other Latin American countries as well. In other words, census information has been highly underutilized in the informal housing studies in Latin America.
In this paper I used a methodology often used in labor economics and known as “quasi-experiment.” The opportunity for adopting such approach is given by the fact that some municipalities enacted urban norms during the 1990s while others have not done so until a decade later. By comparing informal housing formation in
municipalities that have enacted urban regulations (treatment group) with similar municipalities that have not done so, it is possible to estimate the size of the impact of regulation on informality. Despite some difficulties it was possible to do such analysis and I believe that many other analyses of the informal housing market could be done
using the same approach. For instance, if municipalities adopt different housing policies over time, it would be possible to compare the impact of these policies using the same approach.
The information provided by the IBGE MUNIC survey on municipal management made possible the use of a quasi-experiment approach because it gives the year when the municipalities enacted a given urban regulation. This information is not very precise however. Some municipalities declare the year of implementation of the most recent norm. I did check if the information was correct in the case of five
municipalities and have a very good result: four of them were correct, but in one there was a mistake. Of course this is very anecdotic test and I am not sure about the overall quality of the information. Also, the information is binary, i.e. the survey simply informs whether or not the municipality has enacted a given type of norm, but does not say if the norm was more or less stringent. An important advance on this study would be to conduct field research about the urban norms enacted by municipalities, to record not only the original date of each norm, but also the stringency of the norm and its development over time.
Census information is very good for this type of analysis. Actually it seems to be much more useful than circumscribed household surveys. The one drawback that affects the outcome variable is that it may not fully reflect the actual variation in informality under certain circumstances, e.g. net of the titling programs. The case in point is a municipality with a large titling program that may have induced many people to informality but that ends up with a small net increase in the number of informal households since those previously measured were titled by the program. Thus, a significant data challenge is constructing measures for the gross increase in informality.
The analysis showed that urban norms do incentive housing informality but the effect varies with the norm. In Brazil urban growth boundaries are not significant because they were often set way beyond the agricultural frontier. Building codes do have a small impact but zoning and parceling norms seem to have a large impact on informal housing formation. Those are the typical norms used by the elite to segregate poor from living in the city or from having access to the public utilities paid for with local or state taxes. This conclusion is strong and there are some important consequences to land policy issues.
It is important to emphasize that we cannot conclude that the norms should be
abolished. The urban norms do have a role in making for a better urban environment. However they do have an unintended consequence that is increasing informality. While, to the best of my knowledge, no study has showed such evidence before, Brazilian policy-makers did have an intuition that some of the informality was probably connected to urban norms and attempted to remedy the problem by creating the ZEIS. Unfortunately the evidence I present shows that the effort probably failed. Case studies suggest that the reason of failure is probably related with bad signaling connected to the increased flexibility of norms in the ZEIS.
It is not clear to me why policy-makers do not reduce the minimum lot size in the whole city instead of just in designated areas (ZEIS). The demand for small lot sizes comes essentially from the poor who would be the main beneficiaries of such
increased flexibility. Some argue that minimum lot size reduction is not politically feasible, but it is not clear which group would resist to such change. The main reason why the elite push the poor to informality is probably to avoid the tax burden of providing public services for this group. However, current regularization programs are providing services in informal settlements in large scale, and that may be changing the political views of the elite regarding urban regulations.
An alternative would be authorizing regulation changes that benefit the affluent, e.g. zoning norms, but charging for the change and returning the proceeds to the poor as subsidies. Of course such a policy is easy to define conceptually but quite difficult to implement. A combination of taxes and subsidies together with active direct
investment in housing that do not repeat the traditional errors of building public houses in the far suburbs could help minimize the problem of informality. This paper shed some light in which norm should be the subject of such policy but there is certainly a long way forward to actually specify such policy.
References
Avila, P. (2007) “Land use regulation and the informal production of the city: Implications of the Federal Law 6,766/1979 in increasing informality in Brazilian cities”. Lincoln Institute of Land Policy Research Report.
Biderman (2006) “Informality and regulation: a brief note and a research
perspective.” Paper presented at the meeting of the Social Management of the Land Valorization (GESVAT). Polis Institute, April, 2006.
Dowal, D.E. (2007) “Brazil’s Urban Land and Housing Markets: How well are they working?” In Ingram, G.K. and Y-H. Hong (2007).
Glaeser, E.L., J. Gyourko and R. Saks (2005a) “Why Have Housing Prices Gone Up?” American Economic Review, 95(2), pp. 329-333.
Green, R.K., S. Malpezzi and S.K. Mayo (2005) “Metropolitan-Specific Estimates of the Price Elasticity of Supply of Housing, and Their Sources”, American Economic Review, 95(2), pp. 334-339.
Henderson, J.V. (2007) “The Effect of Residential Land Market Regulations on Urban Welfare”. Urban Research Symposium 2007, World Bank, May 14-16, 2007
Lall, S.V., H.G. Wang and D. da Mata (2006) “Do Urban Land Regulations Influence Slum Formation? Evidence from Brazilian Cities”. mimeo.
Lechner, M. (2001a). “A note on the common support problem in applied evaluation studies”, Discussion Paper 2001-01, Department of Economics, University of St. Gallen.
Malpezzi, S. (1996) “Housing Prices, Externalities, and Regulation in U.S. Metropolitan Areas,” Journal of Housing Research, 7(2), pp. 209-241.
Quigley, J.M. and S. Raphael (2005) “Regulation and the High Cost of Housing in California”, American Economic Review, 95(2), pp. 323-329.
Rosenbaum, P.R., and D.B. Rubin (1983) “The Central Role of the Propensity Score in Observational Studies for Causal Effects”, Biometrika 70(1), 41-55.
United Nations (2003) World Urbanization Prospects. New York, NY: United Nations.