UNIVERSITY OF BEIRA INTERIOR
Sciences
Validation of an analytical method using an
anion-exchange monolithic column for the assessment
of supercoiled plasmid DNA
Élia Marília da Fonte Mota
Thesis for obtaining a Master degree in
Biochemistry
(2nd Cycle of Studies)
Supervised: Professor Fani Sousa and Professor Cândida Teixeira Tomaz
iii
“Nothing in life is to be feared, it is only to be understood.
Now is the time to understand more, so that we may fear less.”
Marie Curie
v
To my greatest love,
vii
Acknowledgments
First and foremost, I would like to thank my supervisors Professor Fani Sousa and Professor Cândida Teixeira Tomaz, not only for the continuous guidance of this work, but also for the trust placed on me. I really appreciate all the dedication and availability throughout this year, the scientific expertise, as well as the constructive criticisms and suggestions made during the guidance of the work. It has been a huge privilege for me to work and learn with them.
I am deeply grateful to Doctor Ângela Sousa for her countless suggestions, availability, guidance, support and friendship that were crucial for the success of this work. Between a pause and a laugh, she was conspicuous by her unspeakable patience and willingness that contributed for this work to move forward. I really appreciate the enthusiastic way how she shared her knowledge, always being willing to fruitful discussions.
To Professor João Queiroz from University of Beira Interior, I would like to express my sincere gratitude for his contribution and availability in the development of this research project. I would also like to acknowledge the opportunity to develop this study on Health Sciences Research Centre of the University of Beira Interior and express my gratitude to BIA Separations (Slovenia) by kindly providing us the monolithic column for the development of all this work.
Moreover, I would also like to express my gratitude to all the people involved in Health Sciences Research Centre of the University of Beira Interior, especially to the Biotechnology and Biomolecular Sciences group for the nice way how they received me, for the great atmosphere in the lab, for their help and for all their friendliness. Thank you. It has really been a great time.
I would like to thank to Professor Eugenia Gallardo for fruitful discussions about the analytical method validation.
I am also grateful to my friends and my family, especially to my sisters Naida and Soraia, for all their love.
Finally, I will be eternally grateful to my father and Ilda for all their sacrifices, patience and support throughout all the last years. I love you both. I am deeply thankful to you father, for your presence during the difficult moments, for your advices and encouragement to believe that it is possible to overcome all the challenges.
ix
Resumo
Nos últimos anos tem aumentado a exigência para obtenção de DNA plasmídico superenrolado de elevada pureza de forma a ser aplicado como vector em novas estratégias terapêuticas, como a terapia génica ou as vacinas de DNA. Assim, é necessário implementar uma técnica analítica adequada para controlar a qualidade do plasmídeo superenrolado, como um produto farmacêutico, durante o processo de produção. O presente estudo descreve o desenvolvimento de uma nova metodologia para quantificar e controlar a pureza do plasmídeo superenrolado, usando uma coluna monolítica que se baseia em cromatografia de troca aniónica. Este método analítico com detecção UV permite a separação das isoformas do plasmídeo, usando um gradiente por passos de NaCl. Avaliou-se a selectividade, linearidade, exatidão, reprodutibilidade e repetibilidade do método, e também se estabeleceram os limites inferiores de quantificação e de detecção. A validação foi realizada de acordo com as directivas, sendo demonstrado que o método é preciso e exato até uma concentração de plasmídeo superenrolado de 200 µg/mL. O principal avanço alcançado ao usar este método é a possibilidade de quantificar plasmídeo superenrolado numa amostra contendo outras topologias do plasmídeo, num ensaio de 4 minutos. Esta coluna também possibilita a avaliação de plasmídeo superenrolado presente em amostras mais complexas, permitindo o controlo ao longo do bioprocesso. Assim, estes resultados confirmam a possibilidade de utilizar esta coluna monolítica associada a um método analítico poderoso no controlo do processo “downstream” do plasmídeo superenrolado para aplicações terapêuticas.
Palavras-chave
Coluna monolítica, cromatografia de troca aniónica, DNA plasmídico superenrolado, método analítico, validação.
xi
Abstract
The demand of high-purity supercoiled (sc) plasmid DNA (pDNA) to be applied as a vector for new therapeutic strategies, such as gene therapy or DNA vaccination has increased in the last years. Thus, it is necessary the implementation of an analytical technique suitable to control the quality of the sc pDNA as a pharmaceutical product, during the manufacturing process. The present study describes a new methodology to quantify and monitor the purity of sc pDNA, using a monolithic column based on anion-exchange chromatography. This analytical method with UV detection allows the separation of the plasmid isoforms by using a NaCl stepwise gradient. The selectivity, linearity, accuracy, reproducibility and repeatability of the method have been evaluated, and the lower quantification and detection limits were also established. The validation was performed according to the guidelines, being demonstrated that the method is precise and accurate for a sc plasmid concentration up to 200 µg/mL. The main advance achieved by using this monolithic method is the possibility to quantify the sc plasmid in a sample containing other plasmid topologies, in a 4 minutes experiment. This column also permits the assessment of the sc pDNA present in more complex samples, allowing the control of pDNA throughout the bioprocess. Thus, these findings strengthen the possibility of using this monolithic column associated with a powerful analytical method to control the downstream process of sc pDNA for therapeutic applications.
Keywords
Analytical method, anion-exchange chromatography, monolithic column, supercoiled plasmid DNA, validation.
xiii
Table of Contents
Page
Chapter I - Introduction
1
Section I – Clinical application of plasmid DNA: gene therapy or DNA vaccination 1 Section II – Characteristics of pDNA biomolecule 2 Section III – Biotechnology process for pDNA manufacturing 3 Section IV – Analytical methods for pDNA quantification 6
Section V – Anion-exchange chromatography 9
Section VI – Monolithic columns 10
Section VII - Aims 11
Chapter II – Materials and Methods
13
Section I – Materials 13
Subsection I – Chemicals 13
Subsection II - Instrumentation 13
Subsection III - Column 13
Section II – Methods 14
Subsection I – Plasmid and bacterial growth conditions 14
Subsection II – Alkaline cell lysis and pre-purification of pVAX-LacZ 14
Subsection III – Isolation of plasmid DNA isoforms 15
1. Supercoiled isoform 15
2. Open circular isoform 15
3. Linear isoform 16
Subsection IV – Isolation of host nucleic acids 16
1. gDNA 16
2. RNA 16
Subsection V – Preparation of process samples 17
Subsection VI – Analytical chromatography 17
Subsection VII – Agarose gel electrophoresis 18
Chapter III – Results and Discussion
19
Section I – Establishment and validation of the analytical procedure for
assessment of purity and quantification of supercoiled plasmid 19
Subsection I - Specificity 19
Subsection II - Linearity 23
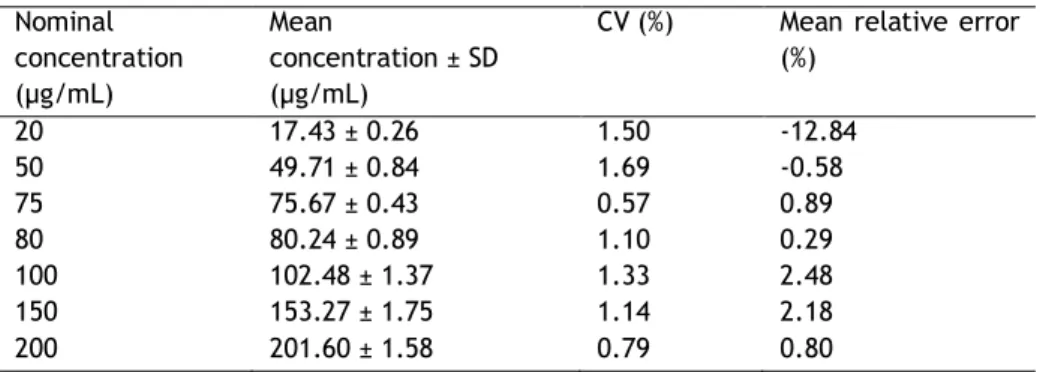
Subsection III – Accuracy, limit of detection and limit of quantification 25
Subsection IV - Precision 27
xiv
Subsection I – Open circular isoform 29
Subsection II – Linear isoform 30
Subsection III - RNA 31
Subsection IV – Genomic DNA 31
Subsection V – Clarified lysate 33
Subsection VI – Clarified lysate enriched with pDNA 37
Subsection VII – Validation of the analytical method for impure plasmid solutions –
Process monitoring 38
Chapter IV - Conclusions
41
Chapter V – Future Trends
43
Chapter VI - Bibliography
45
xv
List of Figures
Page
Chapter I – Introduction
Figure 1 – Schematic representation of the three stages involved in process development for pDNA manufacturing. ... 3 Figure 2 – The role of analytical chromatography in process-scale manufacturing of therapeutic pDNA. ... 7
Chapter III – Results and Discussion
Figure 3 – Chromatographic analysis of native pDNA (oc+sc) using the monolithic column based on anion-exchange chromatography... 20 Figure 4 – Analysis of pDNA using the analytical method based on anion-exchange chromatography ... 21 Figure 5 - Analysis of isolated pDNA isoforms using the analytical method based on anion-exchange chromatography ... 22 Figure 6 - Calibration curves obtained from the correlation between the supercoiled pDNA peak area and the concentration ... 24 Figure 7 - Chromatographic profiles obtained for three supercoiled pDNA standards in each calibration curve ... 24 Figure 8 - Chromatographic profile obtained for blank and for sc plasmid standard with the concentration of 1 µg/mL ... 27 Figure 9 – Analysis of linear pDNA isoform using the analytical method based on anion-exchange chromatography ... 30 Figure 10 – Analysis of RNA using the analytical method based on anion-exchange chromatography ... 31 Figure 11 – Analysis of genomic DNA using the analytical method based on anion-exchange chromatography ... 32 Figure 12 - Analysis of the lysate sample of non-transformed E. coli using the analytical method based on anion-exchange chromatography ... 33 Figure 13 – Analysis of the concentrated lysate sample of non-transformed E. coli using the analytical method based on anion-exchange chromatography ... 34 Figure 14 - Analysis of lysate sample of transformed E. coli using the analytical method based on anion-exchange chromatography... 35 Figure 15 - Analysis of concentrated lysate sample of transformed E. coli using the analytical method based on anion-exchange chromatography ... 36 Figure 16 - Analysis of sc pDNA using the analytical method based on anion-exchange chromatography ... 37
xvi
Figure 17 – Analysis of sc pDNA using the analytical method based on anion-exchange chromatography ... 39
xvii
List of Tables
Page
Chapter I - Introduction
Table 1 – Specifications of bacterial cell lysates and accepted levels of impurities for the final product ... 5
Chapter III – Results and Discussion
Table 2 - Accuracy for the assessment of sc pDNA in the range of 2 – 20 µg/mL (n=4) ... 25 Table 3 - Accuracy for the assessment of sc pDNA in the range of 20 – 200 µg/mL (n=3) ... 26 Table 4 - Intra-day and inter-day precision for the assessment of sc pDNA in the range of 2 – 20 µg/mL (n=4) ... 28 Table 5 - Intra-day and inter-day precision for the assessment of sc pDNA in the range of 20 – 200 µg/mL (n=4) ... 28 Table 6 - Assessment of sc pDNA in lysate sample enriched with sc pDNA in different concentrations (0, 5, 75, 150 µg/mL) (n=2) ... 40
xix
List of acronyms
A Adenine
AEX Anion-exchange
AIDS Acquired immunodeficiency syndrome
BCA Bicinchoninic acid
C Cytosine
CGE Capillary gel electrophoresis
CIM Convective Interaction Media
DEAE Diethylaminoethyl
DNA Deoxyribonucleic acid
dsDNA Double-stranded DNA
E. coli Escherichia coli
E.U. Endotoxin units
EDTA Ethylene-diamine tetraacetic acid
EMEA European Agency for the Evaluation of Medical Products
FDA Food and Drug Administration
G Guanine
gDNA Genomic DNA
h Hour
HIC Hydrophobic interaction chromatography
HPLC High-performance liquid chromatography
kbp Kilo base pairs
LAL Lymulus amebocyte lysate
LB Luria-Bertani ln Linear LPS Lipopolysaccharide M Molar min Minute mL Milliliter mm Millimeter
Mr Relative molecular mass
mRNA Messenger RNA
NaCl Sodium chloride
nm Nanometer
NaOH Sodium hydroxide
oc Open circular
xx
PCR Polymerase chain reaction
pDNA Plasmid DNA
pDERMATT Plasmid DNA encoding recombinant MART-1 and tetanus toxin fragment-c
Q Quaternary amino groups
® Registered trademark
RNA Ribonucleic acid
RNase Ribonuclease
rpm Rotations per minute
rRNA Ribossomal RNA
s Second sc Supercoiled SDS Sodium dodecylsulphate T Thymine TB Terrific Broth Tris Tris(hydroximethyl)methylamine
tRNA Transfer RNA
UV Ultraviolet
1
Chapter I - Introduction
Section I - Clinical application of plasmid DNA: gene therapy or
DNA vaccination
In the last decades, a technological advance in medical and pharmaceutical areas allowed the accomplishment of several human clinical trials, testing the ability to inject plasmids providing therapeutic benefits for untreatable pathologies [1–4]. The rapid evolution of gene therapy and DNA vaccination promises to revolutionize the treatment of inherited and acquired diseases, by the development of specific DNA vectors in large quantities under pharmaceutical grade [5].
Briefly, DNA vaccines use the plasmid DNA (pDNA) to express specific antigens on cell membranes, stimulating and enhancing the immune system’s response and memory [6], providing immunity against major killers, such as malaria [7]. On the other hand, gene therapy is based on the introduction of functional genes into human cells and expression of correct copy [8] to repair genetic defects, such as cystic fibrosis, or acquired diseases like cancer and AIDS [9].
An effective application of pDNA for therapeutic benefits has been made difficult by issues associated with intracellular delivery, transfection efficiency and purity degree required for pDNA expression vectors, to avoid adverse immune responses [10]. Effective DNA vaccination and gene therapy require the control of both the location and function of therapeutic genes at specific target sites within the patient’s body [11]. Thus, one of the main challenges in the development of molecular medicine is to introduce naked DNA into target cells overcoming the extra- and intracellular barriers.
Most gene administration methods are based on viral vectors [9,12] but this delivery system has raised safety and regulatory concerns because of their toxicity and immunogenicity [10]. Non-viral vectors, such as pDNA vectors have been considered to be safer, simpler to use and easier to produce on a large-scale [13,14]. Thus, the non-viral vectors overcome the problems associated to the viral vector-mediated therapy [11,12,15], becoming the most attractive gene-transfer systems to be used as biopharmaceutical products [9,11,16].
The clinical application of pDNA is progressing and the commercial availability for immunotherapeutic and gene therapy purposes is approaching reality. Plasmid DNA is considered a new generation biotechnology product, and several clinical trials are currently in progress using these vectors to treat or to prevent a wide range of diseases with complex
2
etiologies including: cancer, AIDS, allergic diseases, infectious diseases like malaria, neurological disorders such as Parkinson’s disease and Alzheimer’s disease, and cardiovascular disorders [17,18]. The consequent use of pDNA vectors in these therapeutic approaches has increased the need for large amounts of highly pure pDNA with a therapeutic or pharmaceutical-grade and the development of large-scale and efficient pDNA purification processes is also required [19].
Section II - Characteristics of pDNA biomolecule
Plasmids are extra-chromosomal covalently closed double stranded DNA molecules found most frequently but not exclusively in bacterial cells [20]. They replicate independently of the cell chromosome, and typically carry genes that encode for antibiotic resistance [20]. On a molecular level, pDNA molecules can be considered pro-drugs that upon cellular internalization employ the DNA transcription and translation apparatus in the cell to biosynthesize the specific protein [17].
Plasmid DNA molecules are very large (Mr >106, sizes in the µm range) when compared with proteins [15]. Each strand of a pDNA molecule is a linear polymer of deoxyribonucleotides linked by phosphodiester bonds. The phosphate groups are negatively charged for pH > 4 [21]. The winding of the two anti-parallel DNA strands around each other and around a common axis originates the classic right handed double helix structure, which is stabilized by Watson-Crick hydrogen bonds between AT and GC base pairs and by stacking forces [21]. The inside of the double helix is highly hydrophobic due to the close packing of the aromatic bases [19]. When the helix axis of pDNA is coiled in space appears sc pDNA.
Despite pDNA being a very stable biomolecule, during the manufacturing and recovery processes, it can undergo several types of stress that may disrupt its structural stability [22]. In this way, plasmid molecules that are mainly recovered in the sc isoform can also exist in a non-sc or relaxed form, such as the oc conformation resulting from the damage of the sc form. Other variants, such as linear (ln), denatured or oligomeric conformations can also be found in cell lysates [19]. If the manipulation induce nicks in one DNA strand (cleavage of the phosphodiester bonds), the sc pDNA uncoils to become the oc plasmid isoform; on the other hand, if the manipulation induce double-stranded nicks it produces the ln plasmid form [23]. The denatured forms exhibit a conformation where the hydrogen bonding between complementary strands at certain locations has been disrupted and oligomers are a consequence of homologous recombination [24].
3 Supercoiled pDNA, due to its structure and conformation extremely compact and functional, is considered the most efficient isoform at inducing gene expression comparing with other conformational variants [25]. Thus, the sc pDNA isoform is the desired topological form since it induces the most efficient access to the nucleus of the cell and consequently improves gene expression in eukaryotic cells [25]. Since the diversity of pDNA forms results from the damage of the sc isoform, and also because this is the only naturally intact form adapted to play an active role in eukaryotic cell physiology [1,25,26], the attainment of the isolated and purified sc plasmid isoform becomes essential.
Section III - Biotechnological process for pDNA manufacturing
Process development for pDNA manufacturing usually starts on a bench scale, and includes three stages: upstream processing, fermentation and downstream processing [27] (Fig. 1). Generally almost all processes, for the manufacture of pDNA in sufficient quantities to clinical applications, need to improve the productivity [18], mainly in the following operations: fermentation, cell lysis, isolation and purification [28, 29].
Figure 1 – Schematic representation of the three stages involved in process development for pDNA manufacturing. (Adapted from [20, 30])
4
In order to obtain pDNA is necessary the design of the vector to ensure safety, efficacy and cost-efficient production. After completing the vector construction, the transformation of a bacterial cell, typically Escherichia coli (E. coli), is performed with the plasmid encoding the gene of interest. Plasmid molecules are usually biosynthesized by autonomous replication in
E. coli host fermentation, intending to maintain high plasmid copy number per bacterium [1].
After selection and optimization of growth conditions (upstream processing), the production is then developed by fermentation of the host cells in a bioreactor to achieve high yields of pDNA [31]. Finally, the isolation and purification steps (downstream processing) (Fig. 1) consist on the disruption of E. coli cells to recover the pDNA, which is then purified using a suitable methodology [19].
There are several techniques that can be used to disrupt E. coli cells, and hence, release pDNA molecules, but the most widely used method is alkaline lysis [32] or its variations [33]. This is the first critical step in the downstream processing of pDNA, because all the intracellular components, including all plasmid DNA conformations, RNA, genomic DNA (gDNA), endotoxins and proteins, are released [27]. Moreover, this step can affect the ratio of supercoiled (sc) plasmid to other forms, the plasmid amount recovered, as well as the physicochemical characteristics of cellular impurities that must be removed during the downstream process.
The alkaline cell lysis relies on the disruption of cells at high pH with NaOH in the presence of SDS, followed by the release and denaturation of gDNA, cell wall material and most of the cellular proteins. After the lysis step, the solution is neutralized with potassium acetate, which precipitates SDS together with denatured gDNA and cellular debris. Different operations can remove this insoluble material, whereas the majority of pDNA remains in the supernatant. During these manipulations care should be taken to avoid shear-induced cleavage of gDNA, which may result in small fragments that will not aggregate. The resulting clarified alkaline lysate normally contains proteins, RNA, lipopolysaccharides (LPS), gDNA fragments and pDNA. Thus, it is generally performed the reduction of impurities content, like proteins and host nucleic acids, and the reduction of volume to increase the plasmid mass fraction by clarification and concentration operations, respectively [19,34,35] Throughout the process, the mechanical stress should be avoided (for example, by stirring or pumping) in order to minimize the risk for open circular (oc) pDNA formation [18].
The final step to obtain pDNA as a highly pure product for therapeutic applications is the recovery and purification of pDNA molecules from the clarified cell lysate, through of liquid chromatography, which stands as a central purification technique, both at laboratory and process-scale [19,28]. Several studies have been made to develop adsorbents based on different chromatographic principles that allow a fast and efficient separation of pDNA [19]. Different approaches exploit one or more of the following purification processes: size exclusion, anion-exchange, hydrophobic interaction and affinity chromatography [19]. Liquid
5 chromatography is crucial in process-scale manufacturing of therapeutic pDNA, since the quality specifications set or recommended by regulatory agencies, such as the Food and Drug Administration (FDA) and the European Agency for the Evaluation of Medical Products (EMEA) must be fulfilled [14]. The role of chromatography is then to remove those cellular host components (RNA, proteins, gDNA fragments, endotoxins) and non-sc pDNA variants (Fig. 1), in order to achieve the purification of sc pDNA [14]. Several chromatographic techniques have been integrated, individually or combined, into several processes for the manufacture of therapeutic pDNA [36].
The challenges in downstream processing are essentially related to eliminating host impurities that share common characteristics with pDNA, like negative charge (RNA, gDNA, and endotoxins), molecular mass (gDNA and endotoxins) and hydrophobicity (endotoxins) [18], as well as to isolate the sc pDNA from the other plasmid conformational variants. These facts render more evident the need to develop and implement efficient methods to quickly isolate and purify the sc plasmid isoform. Chromatographic processes can then explore some differences in properties, such as charge, molecular size and hydrophobicity [19].
Critical values for the acceptability of pharmaceutical-grade preparations are represented in table 1, showing all specifications that must be reliably reached in processes which are supposed to be used for production of therapeutic substances [18].
Table 1 – Specifications of bacterial cell lysates and accepted levels of impurities for the final product. (Adapted from [18])
Content of bacterial cell lysates Final product
Issue in focus: Range of acceptance: Determined by:
55% Proteins proteins <3 µg/mg pDNA BCA test
21% RNA RNA <0.2 µg/mg pDNA Analytical HPLC
3% gDNA gDNA <2 µg/mg pDNA TaqMan-PCR
3% LPS endotoxins <10 E.U./mg pDNA LAL test
3% Plasmid sc over oc form >97% CGE
15% Others
Plasmid DNA represents less than 3% of the global content in the cleared lysate preparation (Table 1), even in the case of high copy number plasmid [18]. The removal of endotoxins is particularly important, since these LPS components of the E. coli cell wall can cause symptoms of toxic shock syndrome [37]. Furthermore, endotoxins may dramatically reduce transfection efficiencies in various cell lines and display cytotoxic effects on mammalian cells [37].
Finally, the plasmid product is formulated and delivered to the eukaryotic cells to express the protein of interest [23]. In general, all the unit operations involved in the global process are
6
adjusted in a way that pDNA can accomplish the properties to express the encoded information, preferably at the right place, time, and level [38].
The global process selected has to be safe and productive as recommended by the regulatory agencies [19]. Considering the clinical application of pDNA, the pharmaceutical development of a functional, stable and sterile product for clinical trials depends heavily on the availability of an assay for the quantification and purity determination of active plasmid products [39]. Due to the particular interest in the bio-active plasmid conformation, it is crucial that this analytical methodology quantify only the sc isoform. Liquid chromatography is also very useful as an analytical tool to monitor and control pDNA quality during processing and in the final formulations. This type of analysis is essential to guarantee that the final product meets the desired specifications [19,40].
According to regulatory agencies, such as FDA, the product-quality is defined as a percentage of the sc isoform compared to the total pDNA, being that the purity of the sc pDNA must be 100% with the homogeneity degree higher than 97% of sc isoform from E. coli host to apply in gene therapy and DNA vaccination [18]. Thus, it is essential that both research and industry improve the effectiveness of sc pDNA production and purification methodologies [28].
Section IV - Analytical methods for pDNA quantification
Monitoring the performance of a pDNA manufacturing process, as well as assessing the final product quality considering the product specifications, are key issues in process development, validation and product approval [40,41]. Biopharmaceuticals based on pDNA are chemically highly defined and so can be analysed by chemical, biochemical and physical assays [41]. Assessing the quality of the final plasmid preparation in terms of its safety, potency and purity, in order to ensure that the product specifications are met, is a key issue for process validation [40,41]. The development and set-up of reliable analytical methods for the quantification of pDNA and assessment of its purity and homogeneity are especially important.
Since methods for producing and purifying plasmids in large quantities are being developed [42], it is also important that quick, reliable, accurate, and inexpensive analytical methods can be established in order to ensure that purity levels are constantly met in each unit operation (Figure 2).
7
Figure 2 – The role of analytical chromatography in process-scale manufacturing of therapeutic pDNA. (Adapted from [19])
Although quantification of total pDNA in pure solutions is relatively easy to accomplish (for example, by spectrophotometry at 260 nm or fluorescence), mass estimation in impure process streams requires the separation of impurities such as RNA, gDNA fragments and proteins from plasmid molecules before quantitative detection. This separation of plasmid from impurities can be accomplished by electrophoresis carried out either in the conventional [43] or capillary operation modes [44–46].
Gel electrophoresis is used routinely to identify the presence of the various forms of a given plasmid [47], with the sc form almost always having the fastest migration rate. Gel electrophoresis of DNA plasmids of modest size (<50 kbp) is performed with agarose concentrations of 0.5–1%, while larger DNA plasmids have been separated by pulsed gel electrophoresis [48]. However conventional agarose gel electrophoresis is not sufficiently reproducible or accurate for quantitative purposes and is time consuming. Furthermore, for purity analysis the method is only generally accepted for a qualitative assessment of RNA contamination [49]. Although many researchers have quantified DNA plasmids by the imaging of stained gels [47], more sensitive, linear and rapid quantification techniques continue to be pursued [45].
8
Capillary electrophoresis on the other hand combines a high degree of resolution with sensitivity, reproducibility and a fast analysis time. This technique is becoming more and more used to quantify pDNA and its topoisomers (sc and oc) [44–46]. Unfortunately, the superior performance of capillary electrophoresis when compared with conventional gel electrophoresis has a high cost associated and its routine use in research laboratories is not likely to occur in the near future [50]. Furthermore capillary electrophoresis does not adequately handle process solutions that contain significant amounts of impurities [50]. Although the electrochemical methods can also provide an alternative, they are also restricted to laboratories equipped with voltammetric and chronopotentiometric analysers [51]. For this reason, various chromatographic methods for determining the concentration of the sc pDNA and assess the purity started to emerge. The method is based on measuring the peak area of sc pDNA, the bio-active plasmid conformation, which is proportional to the concentration of this isoform.
High-performance liquid chromatography (HPLC) is a routine technique in many research and industrial laboratories, which has been used for the separation and quantitation of nucleic acids [52]. HPLC is a fast, reproducible and robust methodology mainly based on anion-exchange [29,49,53–55], hydrophobic interaction [20] or reversed-phase binding modes [55– 57]. Some HPLC columns can also selectively separate pDNA isoforms, thus providing a means to assess the heterogeneity of pDNA preparations [20,54,55].
Quantification of the plasmids eluting from the column is typically performed using UV detection at 260 nm. One recent study indicates that not only the concentration (i.e. amount), but also size (effective radius) and molecular mass of pDNA eluting from chromatography columns can be determined using light scattering [58].
With regard to the chromatographic methods, the hydrophobic interaction chromatography (HIC) allied to an HPLC system was already applied to quantify total pDNA in different samples [50] and to separate plasmid isoforms [20].
For the first time, Sousa and Queiroz (2011) have reported the assessment of the sc plasmid isoform using an analytical method based on arginine-affinity chromatography that allows the quantification and the quality control of sc plasmid biopharmaceuticals [23].
Anion-exchange (AEX) chromatography was also used by different authors to quantify or to determine the purity of plasmid samples [19,52]. In earlier experiments with anion exchangers, total pDNA analysis were described, using Poros HQ [59], Poros QE [29], Poros PI [53,60,61] and DMAE-LiChrospher [49]. An HPLC macroporous Nucleogen-DMA-4000 column (Macherey-Nagel) was reported to separate RNA and gDNA from pDNA, which eluted as a peak consisting of 95% of the sc isoform [62]. The separation and quantitation of oc and sc isoforms has also been achieved with DEAE-NPR and DEAE-5PW (Tosoh) columns [54]. The presence of nanograms of oc pDNA could be determined within 30 min [54]. One recent study documents
9 the validation of an AEX liquid chromatographic method with UV detection for the quantification and purity determination of the sc pDERMATT plasmid isoform (3.8 kbp). However, this method is time-consuming, since the total run time was 35 min [39]. Fast pDNA separations can be obtained by reducing the mass transfer resistance within the pores/channels of super-porous matrices [52]. High-performance monolithic columns [63] have been described as a good option to achieve this purpose. A much faster analysis of pDNA isoforms was obtained with a non-porous, micropellicular DEAE anion exchanger based on highly cross-linked PS-DVB particles [64].
Section V - Anion-exchange chromatography
AEX chromatography remains one of the most used techniques for capture, purification and quantitation of pDNA, both at preparative and analytical scale [18,19], as it offers the advantages of rapid separation, no solvent requirement, possibility to be sanitized with NaOH and a wide selection of process-grade stationary phases [65].
AEX chromatography takes advantage of the interaction between negatively charged phosphate groups in the DNA backbone and positively charged ligands on the stationary phase [29]. After binding, a salt gradient is used to displace the different nucleic acids that should elute in order of increasing charge density, a property, which in turn is a function of chain length and conformation [14]. The shape and size of the molecules clearly plays an important role in the separation of plasmid variants [52,66]. In this way, the more compact sc forms, which have higher charge density, elute later than the oc forms which have lower charge density [62,67,68]. The stronger binding of the more compact sc pDNA can be overall attributed to its higher charge density in comparison with the other isoforms [62,67,68] or to a better fit and interaction with ligands within the stationary phase pore curvatures [62]. Furthermore, the base sequence and composition also may affect the elution pattern of nucleic acids in anion exchangers [66].
When using AEX to separate pDNA, the clarified lysate feed should always be loaded at a sufficiently high salt concentration (typically >0.5 M NaCl) to avoid an unnecessary adsorption of low charge density impurities, such as low Mr RNA, oligonucleotides and proteins. Under these conditions, a significant amount of impurities elute in the flowthrough and capacity can be fully exploited for pDNA adsorption [62,65]. Molecules with a high charge density, such as pDNA isoforms, high Mr RNA and gDNA are retained and subsequently eluted by increasing the ionic strength of the mobile phase. Many AEX stationary phases display poor separation selectivity towards pDNA and impurities (high Mr RNA, pDNA concatamers, gDNA, non-sc pDNA
10
isoforms, endotoxins) due to their similar binding affinities. In the case of gDNA, separation will be even more difficult to accomplish if alkaline lysis generates fragments with sizes closer to pDNA size [15].
The use of pDNA chromatography has been reviewed by Diogo and co-workers (2005), being described that AEX, HIC and reversed phase ion-pair chromatography are the techniques commonly used for pDNA quantitation [19]. However AEX-HPLC is still most widely used [19,52]. Several groups have successfully separated the pDNA forms using AEX-HPLC [49,54,66,69,70].
Several authors have reported the use of weak anion-exchange ligands such as DEAE coupled to silica [62] or polymer-based matrices [68], and the use of strong ligands such as quaternary amines (Q) coupled to polymeric matrices [67] in analytical and/or preparative chromatography of plasmids. However none of these groups have validated monolithic columns for assessment of sc pDNA isoform.
Section VI - Monolithic columns
A typical monolith (BIA Separations) is a continuous bed constituted by a single piece of highly porous material, characterized by a highly interconnected network of channels [63], with large diameter (0.01 – 4 µm), whose pore size depends on the polymerization process [71,72]. In this way, all the mobile phase is forced to flow through the channels via convection [73], resulting in a very fast transfer between mobile and stationary phases [74]. This chromatographic support named as Convective Interaction Media (CIM) was developed with the aim of obtaining a short chromatographic layer, ensuring well-defined, narrow pore-size distributions, excellent separation power and exceptional chemical stability [71]. Thus, these innovative CIM disks present numerous advantages comparing to conventional supports applied on sc pDNA purification.
Monolithic supports exhibit very high binding capacity for pDNA [71,75] and excellent mass transfer properties, because present a huge quantity of accessible binding sites for large biomolecules as pDNA [76], due to their “superpores” which can easily accommodate large pDNA biomolecules. Moreover, these supports allow a fast and high-resolution separation of double stranded DNA molecules, making them attractive for pDNA chromatography [19]. In general, the plasmid purity, recovery and peak resolution are coherently influenced by chromatographic residence time, which consequently can be changed by manipulating buffer flow rate and column length [77]. In accordance, for the optimal purification of larger
11 biomolecules, the chromatographic column needs to be short, supporting higher flow rates [73,78] in order to reduce backpressure [63], unspecific binding, product degradation and minor changes in the structure of the biomolecule [79], without sacrificing resolution, due to short contact times with the chromatographic matrix [79].
The use of formats more adequate to handle large pDNA molecules, such as monoliths, will likely become more and more important in pDNA chromatography [19]. Monoliths are now being considered the material of choice for the purification and analysis of proteins, pDNA and viruses [76,80,81].
The purification of pDNA from an alkaline lysate without any addition of RNase using weak AEX chromatography on a CIM DEAE monolith (BIA Separations) has been described [63]. The pDNA quality was comparable to the quality of pDNA isolated with a commercial Qiagen kit. An additional advantage was the successful regeneration which allows a consecutive usage of the same CIM® DEAE monolithic column. The characteristic shortness of the monolith resulted in a fast separation (approximately 7 min) [63]. Furthermore, it was also shown that disk monolithic columns can be applied for fast analytical in-process control of the plasmid DNA purity [63].
Recently, it has been reported the application of monolithic innovative technology to purify sc pDNA suitable for pharmaceutical applications, at preparative scale, by exploiting affinity interactions [5,75]. Knowing that the monolithic columns have all these advantages, it will be interesting to validate an analytical methodology with this monolithic innovative technology.
Section VII - Aims
The present work aims to develop a new analytical method, efficient on sc pDNA quantification and purity evaluation, exploring the interaction with an anion exchange monolith. Since the separation and quantification of plasmid isoforms in final pDNA products is important, a method that can rapidly measure sc pDNA in impure solutions is very useful. A CIM® pDNA analytical column from BIA Separations will be explored. The monolithic support will be tested first with a pre-purified pDNA sample (oc + sc) to verify the separation of both plasmid isoforms (selectivity).
The validation of the analytical method must be performed according to international guidelines [28]. Basic analytical parameters like linearity of the method, lower limits of
12
detection and quantification, accuracy and precision (intra- and inter-day) will be determined. In fact, the establishment of a new analytical method, able to monitor a biotechnological process in terms of controlling the sc pDNA quality, purity and yield, must guarantee the simplicity, linearity, accuracy and precision of the results.
If the monolithic column is validated for pre-purified sample (oc + sc), it becomes interesting to test this support for the quantification of sc pDNA isoform directly from a clarified E. coli lysate. Thus, the sc pDNA amount can be determined for different samples, which are collected from various process steps (in-process control) as well as in the final control.
13
Chapter II - Materials and Methods
Section I - Materials
Subsection I - Chemicals
The host strain used for obtaining the 6.05-kbp plasmid pVAX1-LacZ (Invitrogen, Carlsband, CA, USA) and the several nucleic acids was E. coli DH5α obtained from Invitrogen (Carlsband, CA, USA). Kanamycin was purchased from Sigma (St. Louis, MO, USA). QIAGEN plasmid purification maxi kit was from QIAGEN (Hilden, Germany). Tris(hydroximethyl)methylamine and isopropanol were purchased from Fisher (Leicestershire, UK). Sodium chloride and sodium hydroxide were obtained from Panreac (Barcelona, Spain). All solutions were freshly prepared using deionized water ultra-pure grade, purified with a Milli-Q system from Millipore (Billerica, MA, USA) and analytical grade reagents. The elution buffers were filtered through a 0.20 µm pore size membrane (Schleicher Schuell, Dassel, Germany) and degassed ultrasonically. The samples to inject in monolith were filtered through 0.22 µm pore size filter (Millipore, Bedford, MA, USA). All salts used were of analytical grade.
Subsection II - Instrumentation
All analytical chromatography experiments were performed using ÄKTATM purifier system (GE Healthcare Biosciences, Uppsala, Sweden) controlled by UNICORN software, Version 5.11. This equipment consists of two pumps with various sample loop volumes and a UV detector. All DNA concentration determinations were made spectrophotometrically with Ultrospec 3000 UV/Visible Spectrophotometer (Pharmacia Biotech, Cambridge, England). One unit of OD 260 nm in a 10 mm cuvette is assumed to correspond to 50 µg/ml dsDNA.
Subsection III - Column
CIM® pDNA Analytical Column was kindly provided by BIA Separations (Ljubljana, Slovenia). CIM disk monolithic columns bearing weak anion exchanger (diethylamino) were used. CIM monolithic column consists of a disk-shaped poly(glycidyl methacrylate-co-ethylene dimethacrylate) highly porous polymer matrix with a defined morphology (pore size, and size distribution, porosity and shape). Their small volume (0.32 mL) and short column length (15.0 mm length and 5.2 mm diameter) allows operation at high flow rates (up to 10 column
14
volumes/min). The disk-shaped matrix is packed into a dedicated stainless steel housing (BIA Separations). Regeneration of CIM disk monolithic column was performed after approximately 50 chromatographic runs by washing it well with water followed by 10 column volumes of 0.5 M NaOH at a flow rate of 0.2 ml/min and finally washing with water.
Section II - Methods
Subsection I - Plasmid and bacterial growth conditions
The analytical method to quantify sc pDNA was developed using the 6.05-kbp plasmid
pVAX1-LacZ, chosen as model vector. The plasmid amplification was obtained by fermentation of E. coli DH5α after transformation, being obtained a high plasmid copy number enriched in sc
isoform. In pre-cultivation, a stride from a selective plate of Luria-Bertani (LB) agar supplemented with 30 µg/mL, was inoculated into a 250 mL shake flask with 62.5 mL of Terrific Broth (TB) medium (20 g/L tryptone, 24 g/L yeast extract, 4 mL/L glycerol, 0.017 M KH2PO4, 0.072 M K2HPO4) supplemented with 30 µg/mL kanamycin. E. coli DH5α harboring pVAX1-LacZ was grown in a rotary shaker at 250 rpm under aerobic conditions at 37 ºC. Cell growth was evaluated by measuring the optical density of the culture medium at a wavelength of 600 nm (OD600). Pre-culture was harvested in the exponential growth phase, i.e., after approximately 3 h of cultivation (OD600~2.6). Fresh TB medium was inoculated with the appropriate amount of pre-culture, in order to start all the cultures with an OD600 of approximately 0.2. Growth was carried out in 1 L shake flasks containing 250 mL of TB medium, under the same conditions for 14 h (overnight), i.e., the cell growth was suspended at late log phase (OD600~9). The culture medium was transferred to centrifuge bottles and the cells were recovered by centrifugation at 5445 x g for 30 min at 4 ºC. The supernatants were discarded and the bacterial pellets were stored at -20 ºC. E. coli DH5α cells without plasmid were also grown under the same conditions as described before, but with no antibiotic present.
Subsection II - Alkaline cell lysis and pre-purification of pVAX1-LacZ
In order to obtain plasmid samples for initial experiments, pDNA was purified using the Qiagen (Hilden, Germany) plasmid maxi kit, according to the manufacturer’s instructions. The protocol is based on a modified alkaline lysis procedure, being considered a critical unit operation, because this step can influence the final ratio of sc plasmid. Unfavorable environmental conditions, such as extreme pH and temperature, affect the helical repeat of
15 DNA promoting its unwinding, being generated other forms such as oc isoform. Bacterial pellets were thawed and resuspended in 20 mL of 50 mM Tris–HCl, 10 mM EDTA, pH 8.0 with 100 µg/mL RNase. Alkaline lysis was performed by adding very carefully 20 mL of a 200 mM NaOH, 1% (w/v) SDS solution. After 5 min of incubation at room temperature, cellular debris, gDNA and proteins were precipitated by gently adding 20 mL of prechilled 3 M potassium acetate solution, pH 5.5 followed by incubation on ice for 20 min. The precipitate was removed by centrifugation at 20 000 × g for 30 min at 4 ºC, using a Sigma 3–18 K centrifuge. A second centrifugation step was carried out for 15 min under the same conditions to separate the remaining suspended material. Following lysis, binding of pDNA to the Qiagen anion exchange resin is promoted under appropriate low-salt and pH conditions (750 mM NaCl, 50 mM MOPS, 15% isopropanol (v/v), 0.15% Triton® X-100 (v/v), pH 7.0). Impurities are removed by a medium-salt wash (1.0 M NaCl, 50 mM MOPS, 15% isopropanol (v/v), pH 7.0), and pDNA is eluted in a high-salt buffer (1.25 M NaCl, 50 mM Tris-HCl, 15% isopropanol (v/v), pH 8.5). Plasmid DNA is then concentrated through an isopropanol precipitation, by adding 0.7 volumes of ice-cold isopropanol, followed by centrifugation at 15 000 x g for 30 min at 4 ºC, using a Sigma 3–18 K centrifuge. Pellet was air-dried for 5-10 min at room temperature and redissolved in a suitable volume of buffer with adjusted ionic strength (approximately 3 mL of 10 mM Tris-HCl, 700 mM NaCl, pH 8.0). Finally, 260 and 280 nm absorbance of the samples was determined using spectrophotometer to assess pDNA quantity and purity. In general, the pDNA obtained at the end of these recovery and isolation steps contained around 90% of sc isoform, while the remaining 10% corresponded to the presence of oc isoform, as revealed by agarose electrophoresis. The pDNA samples were stored at -80 ºC until analytical chromatographic studies.
Subsection III – Isolation of plasmid DNA isoforms
1. Supercoiled isoform
In order to improve the quantity of sc isoform obtained in the plasmid sample, the fermentation was suspended at exponential phase (OD600~5), reducing the culture time to 5 h. The sc isoform was purified after alkaline lysis using the Qiagen (Hilden, Germany) plasmid maxi kit, according to the manufacturer’s instructions described above.
2. Open circular isoform
Open circular pDNA isoform was prepared by incubating a sc pDNA sample without NaCl at room temperature (20 - 25 ºC). The sample was monitored over the time by electrophoresis analysis until the total conversion of sc plasmid to oc isoform was observed (about 3 days). Samples were stored at -80 ºC until analysis. For the chromatographic analysis the ionic strength of the oc pDNA sample was adjusted, dissolving the required NaCl quantity to obtain a final concentration of 700 mM.
16
3. Linear isoform
The linear pVAX1-LacZ sample was prepared by enzymatic digestion with Hind III (Takara Bio, Shiga, Japan), a single-cutting restriction enzyme. The plasmid samples, without NaCl, were incubated at 37 ºC for 1 h, according to the protocol of the manufacturer. Successful linearization of the plasmid was confirmed by agarose gel electrophoresis, being obtained only one band at 6050 bp. Linear plasmid was stored at -80 ºC until analysis. For the chromatographic analysis the ionic strength of the ln pDNA sample was adjusted, dissolving the required NaCl quantity to obtain a final concentration of 700 mM.
Subsection IV – Isolation of host nucleic acids
Host nucleic acids (gDNA and RNA) were isolated from pDNA-free DH5α E. coli cells.
1. gDNA
Genomic DNA was isolated using the Wizard genomic DNA purification kit from Promega (Madison, WI, USA), according to the manufacturer’s instructions. Briefly, bacterial pellets (65 mL) were resuspended in 25 mL of nuclei lysis solution and incubated at 80 ºC for 5 min to lyse the cells. After cooling the solution to room temperature, 250 µL of 1 mg/mL RNase solution were added to the cell lysate, followed by incubation at 37 ºC for 45 min. Then, 5 mL of protein precipitation solution were added to the RNase-treated cell lysate. The pellet was removed by centrifugation at 16 000 x g for 10 min. After centrifugation, 12.5 mL of room temperature isopropanol were added to the supernatant and the solution was mixed by inversion until the thread-like strands of DNA form a visible mass. The solution was centrifuged at 16 000 x g for 6 min and the supernatant discarded. The pellet was air-dried for 5-10 min and 12.5 mL of 70% ethanol were added to wash the DNA pellet. The solution was centrifuged at 16 000 x g for 6 min and, after discarded the supernatant, the pellet was air-dried for 5-10 min. Finally, 2.5 mL of DNA rehydration solution were added, followed by incubation at 65 ºC for 1 h. The gDNA samples were stored at -20 ºC until used in chromatographic studies.
2. RNA
For RNA isolation, the cells were lysed by a modification of the alkaline method [43]. Thus, after cell lysis, clarification was performed by adding 1 volume of 5 M solution of a chaotropic salt (ammonium acetate). After 30 min-incubation at room temperature the mixture was centrifuged at 21 000 x g for 40 min at 4 ºC. Pellets were discarded and nucleic acids precipitated and concentrated by adding 1 volume of a solution of 15% poly(ethylene glycol) (PEG) 6000, 1.6 M NaCl. After 30 min on ice and centrifugation at 21 000 x g for 40 min, precipitates were resuspended in 3 mL of 700 mM NaCl solution in 10 mM Tris-HCl pH 8.0 [34].
17
Subsection V - Preparation of process samples
The evaluation of the applicability of the analytical method to quantify the sc pDNA isoform present in more complex samples required the preparation of E. coli lysates. Thus, E. coli cells were lysed using a modification of the alkaline method [43], as described by Diogo and co-workers (2000) [82]. Bacterial pellets (obtained from centrifugation of 250 mL cell broth at 5445 × g for 30 min, 4 ºC) were thawed and resuspended in 20 mL of 50 mM glucose, 25 mM Tris–HCl, 10 mM EDTA, pH 8.0. Alkaline lysis was performed by gently adding 20 mL of a 200 mM NaOH, 1% (w/v) SDS solution. After 5 min of incubation at room temperature, cellular debris, gDNA and proteins were precipitated with 16 mL of prechilled 3 M potassium acetate, pH 5.0 and incubating on ice for 20 min. The precipitate was removed by centrifuging twice at 20 000 × g for 30 min at 4 ºC with a Sigma 3–18 K centrifuge. Samples of this supernatant were then kept and stored at -80 ºC for further analysis. The concentration of the lysate was performed according to a previously published method [82]. The pDNA present in the supernatant was precipitated by adding 0.7 volumes of ice-cold isopropanol and incubating on ice for 30 min. The pDNA was recovered by centrifugation at 16 000 × g for 30 min at 4 ºC. After discarding the supernatant, the pellet was air-dried for 5–10 min and then redissolved in 6 mL of 10 mM Tris–HCl buffer, pH 8.0. Samples of this concentrated lysate were then kept and stored at -80 ºC for further analysis. The same procedure was used to perform the lysis of a pDNA-free cell culture. Samples were adequately diluted prior to analysis.
Subsection VI - Analytical chromatography
All experiments were performed using an ÄKTA Purifier system (GE Healthcare Biosciences, Uppsala, Sweden) with the Unicorn control system Version 5.11. Briefly, the system was prepared with a 500 mM NaCl in 10 mM Tris-HCl buffer pH 8.0 in the pump A (mobile phase A), and 1 M NaCl in 10 mM Tris–HCl buffer pH 8.0 in the pump B (mobile phase B). The monolithic column was equilibrated with 52% of buffer B. Afterward, 20 µL of a plasmid sample suitably diluted in the equilibration buffer with the adjusted ionic strength were injected in the monolith and eluted at a flow rate of 1 mL/min. After elution of unbound species, the ionic strength of the buffer was instantaneously changed to 100% of buffer B to elute bound species. Fractions were pooled according to the chromatograms obtained and used for further electrophoresis analysis after concentration and desalting with Vivaspin concentrators (Vivascience). Next, the column was re-equilibrated for 9 min with the equilibration buffer in order to prepare the column for the next run. In all separations and throughout the entire chromatographic run the absorbance of the eluate was monitored at 260 nm and the conductivity was continuously recorded, while 250 µL fractions were pooled according to the chromatograms obtained. All experiments were performed at room temperature (about 20 – 25 ºC). The experiments developed with the E. coli lysate or with the
18
isolated impurities, namely, oc and ln pDNA isoforms and host nucleic acids (gDNA and RNA), were performed using the same elution gradient described above.
Subsection VII - Agarose gel electrophoresis
The identification of the nucleic acids samples was performed by agarose gel electrophoresis. Briefly, the fractions recovered from each chromatographic experiment, after being efficiently desalinized, were analyzed by horizontal electrophoresis using 15 cm 1% agarose gels (Hoefer, San Francisco, CA, USA) stained with green safe (1 µg/mL) and visualized under UV light in a Vilber Lourmat system (ILC Lda, Lisbon, Portugal). Electrophoresis was carried out in Tris-acetic acid (TAE) buffer (40 mM Tris base, 20 mM acetic acid and 1 mM EDTA, pH 8.0) and run at 100 V for 40 min. Finally, the bands corresponding to nucleic acids were visualized under UV light. Hyper Ladder I (Bioline, London, UK) was used as a DNA molecular weight marker.
19
Chapter III – Results and Discussion
Section I – Establishment and validation of the analytical
procedure for assessment of purity and quantification of
supercoiled plasmid
According to the FDA guidelines, the quantification of pDNA and the analysis of its purity must be evaluated using suitable analytical methods [1], and the high performance chromatographic techniques are usually applied to ensure the plasmid quality considering the clinical application. The correct validation of an analytical procedure involves the control of several parameters. Thus, in this study, the specificity, the linearity, the accuracy, the reproducibility, the repeatability, and the lower quantification and detection limits were evaluated.
Subsection I - Specificity
The specificity of an analytical method is described as the ability to assess unequivocally the analyte in the presence of components which may be expected to be present [83], which in this case can be considered as the ability of the method to distinguish between both plasmid isoforms. To achieve the specificity of the method to assess sc pDNA it was necessary to define an appropriate strategy for the optimization of chromatographic conditions allowing the separation of pDNA isoforms. In this way, the two main plasmid isoforms, oc and sc, were first isolated by QIAGEN plasmid maxi kit. With this plasmid sample, some initial screenings were performed in order to achieve optimal resolution between sc and oc pDNA isoforms. These experiments were carried out in order to achieve the most appropriate binding/elution conditions to separate the isoforms within a short time. Thus, linear and stepwise gradients were tested.
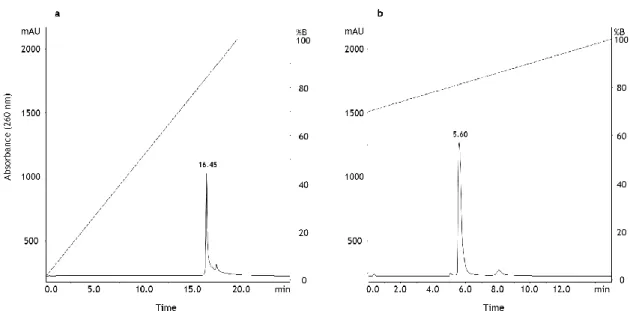
Initially, the linear gradient was evaluated by using a buffer A consisting in a Tris–HCl buffer at pH 8.0 and a buffer B containing 1 M NaCl in Tris–HCl buffer. Linear gradient, represented by the dashed line in Figure 3, was carried out in the range between 0 and 100% of buffer B, for 20 min (Figure 3a). After the equilibration of the column, the pDNA sample containing the oc and sc plasmid isoforms was applied to the analytic column. Figure 3a presents the chromatographic profile where it is observed only one peak with a retention time of 16.45 min. Since a unique peak was obtained, it was concluded that there was no separation of isoforms, and all pDNA was eluted at the same time, under these chromatographic conditions.
20
This result indicated that all biomolecules were retained at low NaCl concentrations and were eluted by increasing the ionic strength.
The next step was to evaluate the result of shortening the concentration range used in the linear gradient, to obtain a mild gradient. In order to choose the concentration range to be used in this second linear gradient strategy, it was considered that in the first assay the 16.45 min-peak corresponded to the elution of pDNA at about 84% of buffer B. Thus, the new gradient was initiated with 70% of buffer B (Figure 3b). In this way, the reduction of the gradient range (70-100%B) also allowed to decrease the length of the gradient to 15 min. Under these conditions, it was also obtained only a single peak and it was not possible to isolate sc isoform.
Figure 3 – Chromatographic analysis of native pDNA (oc+sc) using the monolithic column based on anion-exchange chromatography. (a) Chromatographic profile using a 20-min linear gradient in the range 0-100%B. (b) Chromatographic profile using a 15-min linear gradient in the range 70-100%B.
Thereby it was concluded that the NaCl linear gradients tested, led to the total pDNA elution with no separation of plasmid isoforms. So, further experiments were developed in order to find the exact NaCl concentration that allows the elution of each isoform, and a stepwise gradient was explored to facilitate the separation of sc and oc pDNA.
A stepwise gradient was tested and after some adjustments in the concentration of salt to be used for pDNA separation, it was possible to obtain two resolved peaks. The next step was to adjust the composition of the buffers and of the sample, to facilitate the complete separation of both isoforms. The NaCl concentration of buffer A was changed to 500 mM in the same Tris–HCl buffer and the concentration of buffer B was maintained at 1M of NaCl. As there was
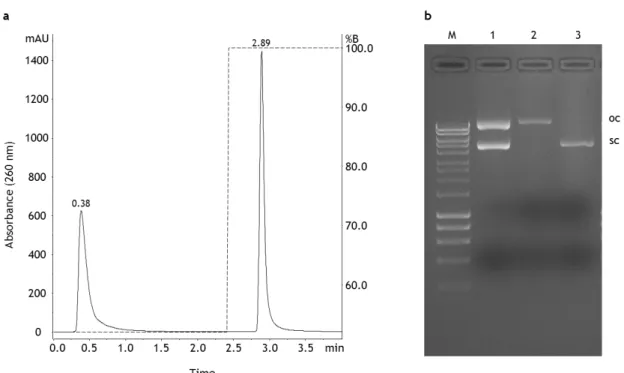
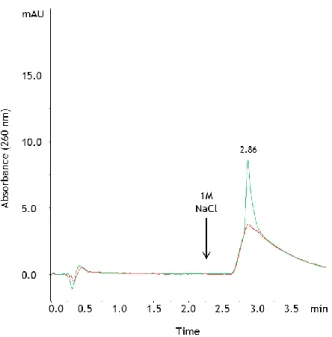
21 an abrupt change in conductivity when injecting the sample, the ionic strength of the sample was adjusted to 700 mM NaCl. Although it could be possible to optimize the linear gradient strategy, the stepwise gradient was finally chosen because it enabled faster separations. In this case, after establishing the concentration of salt that allowed the separation of isoforms, it was possible to develop a rapid assay (Figure 4a). Figure 4b presents an agarose electrophoresis where it is observed in lane 1 the pDNA sample containing the oc and sc plasmid isoforms. This sample was applied to the analytic column and two peaks were obtained when using the stepwise gradient represented by the dashed line (Figure 4a). The elution of the first plasmid component was verified at 0.38 min using a gradient condition corresponding to 52% of buffer B. After 2 min of the chromatographic run, a stepwise gradient was created, by adjusting the elution conditions to 100% of buffer B, and the elution of the second component was observed with a retention time of 2.89 min (Figure 4a).
Figure 4 – Analysis of pDNA using the analytical method based on anion-exchange chromatography. (a) Chromatographic profile of a pDNA sample containing the open circular and supercoiled isoforms. (b) Agarose gel electrophoresis analysis of each peak obtained in respective chromatogram. Lane M – molecular weight marker; lane 1 – pDNA sample (oc + sc) injected onto the monolithic column; lane 2 – oc pDNA recovered from the first peak of the chromatogram; lane 3 – sc pDNA recovered from the second peak of the chromatogram.
Figure 4b presents the isolated isoforms, the oc conformation in lane 2 and the sc conformation in lane 3, which were recovered from analytic column in the first and second peaks, respectively. In this way, these results show that an analytical method can be
22
developed using the AEX monolithic column to specifically analyze sc pDNA. Briefly, a NaCl concentration of approximately 760 mM (52%B) can be used to recover the oc isoform and by increasing the ionic strength to 1 M the bound sc isoform is recovered.
The total run time of the analytical experiment was of 4 min, which represents an advantage because the separation of pDNA isoforms and the elution of sc pDNA occurs faster than the described for other methods, for example in an AEX-based method that requires 35 min to complete the run [39] and an analytical method based on arginine-affinity chromatography that requires 12 min to complete the run [23]. Moreover, comparing this column with another monolithic column described by Branovic and co-workers (2004), both have the same run time, however this method offers the possibility to isolate only the sc isoform [63].
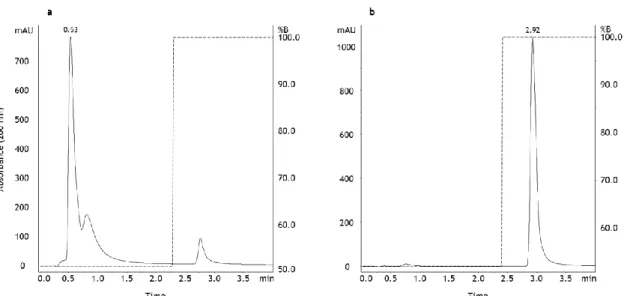
To confirm the identification of the plasmid components eluting in both differentiated peaks, two experiments were also performed by injecting each isolated plasmid isoform into the analytic column, under the same gradient conditions (Figure 5). Thus, the isolated isoforms, oc and sc pDNA conformations were used to compare their retention patterns with the elution profiles and retention times obtained with the sample of total plasmid (oc + sc) represented in Figure 4a.
Figure 5 - Analysis of isolated pDNA isoforms using the analytical method based on anion-exchange chromatography. (a) Chromatographic profile of open circular pDNA isoform. (b) Chromatographic profile of supercoiled pDNA isoform.
In Figure 5a it is possible to observe the chromatographic profile obtained by the injection of the oc plasmid conformation. As it is visible, one peak was obtained with a retention time of 0.53 min, being coincident with the elution of the first peak in Figure 4a. Furthermore, the
23 application of the isolated sc plasmid isoform (Figure 5b) onto the monolithic column resulted in the elution of a single peak with a retention time of 2.92 min, corresponding to the second peak obtained in the chromatographic analysis of total pDNA. Thus, with these experiments it was possible to verify the specificity of the analytical method to efficiently distinguish between both major plasmid conformations.
Once the predominant attractive forces involved in AEX chromatography are electrostatic forces between positively charged ligands on the stationary phase and negatively charged phosphate groups in the pDNA backbone [52], the more compact sc isoform, which has a higher charge density, elute later than the oc isoform. This fact was verified with the elution strategy used, because the first step allowed the immediate elution of the non-retained oc isoform and the second step, with higher ionic strength, was suitable for the total recovery of the sc isoform. In fact, the stronger binding of the more compact sc pDNA to diethylamino ligands (weak anion exchangers) can be due to its higher overall charge density, in comparison to other isoforms, or to a better fit and interaction with ligands within the stationary phase pore curvatures.
In this context, the specificity found for sc pDNA is extremely relevant as it is required for the implementation of a new analytical technology able to ensure the quality and purity criteria of a bioproduct, like pDNA. However, other parameters have to be established to validate an analytical method.
Subsection II - Linearity
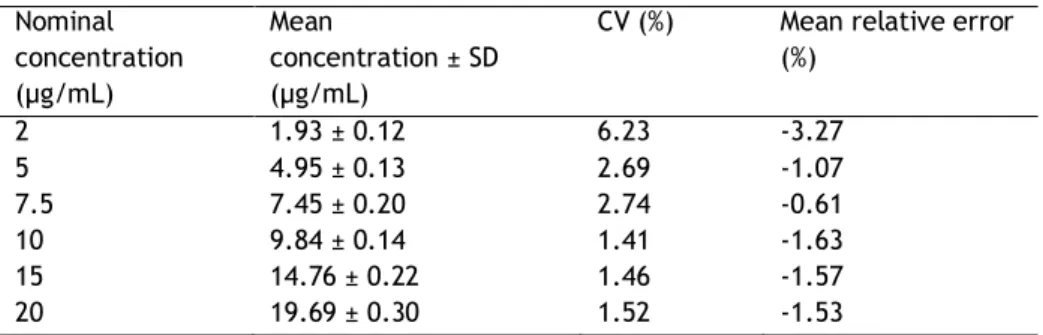
The linearity of this method was studied for two different concentration ranges. The first curve was performed with 5 sc pDNA standards in the range of 2 – 20 µg/mL (2, 5, 10, 15 and 20 µg/mL) using three replicates for each sc plasmid concentration. The second curve was performed with 6 sc pDNA standards in the range of 20 – 200 µg/mL (20, 50, 75, 100, 150 and 200 µg/mL) using four replicates for each sc plasmid concentration. The standards were prepared with the sc pDNA obtained from fermentation suspended at exponential phase (OD600~5) and purified with a Qiagen commercial kit. Considering that 1 unit of absorbance corresponds to a concentration of 50 µg/mL, the initial absorbance of the sc plasmid sample was measured in UV at 260nm. Each standard was obtained by dilution of the sc plasmid solution with the mobile phase used in the beginning of the chromatographic experiment. The pDNA standard samples were then injected into the analytic column using the procedure described above. The average plasmid peak area was determined and the standard deviation was calculated in order to construct each calibration curve.
24
Figure 6 - Calibration curves obtained from the correlation between the supercoiled pDNA peak area and the concentration (a) in the range of 2 - 20 µg/mL (n=3) and (b) in the range of 20 - 200 µg/mL (n=4).
Figure 7 - Chromatographic profiles obtained for three supercoiled pDNA standards in each calibration curve, with the concentration of (a) 2, 10 and 20 µg/mL; and (b) 20, 100, 200 µg/mL.
With this study it was verified that the method is linear within the concentration ranges studied (2 – 20 and 20 - 200 µg/mL). A linear correlation was found for the sc pDNA concentration range considering either the height or area of the sc pDNA peak. In fact, the correlation coefficients for the first curve were of about 0.9984 and 0.9997, respectively and for the second curve were of about 0.9986 and 0.9994, respectively. The correlation found for the calibration curves relating the sc pDNA concentration range with the peak area is presented in Figure 6. In Figure 7 it is possible to observe an example of the chromatographic profiles obtained for three sc pDNA standards of each curve, where it is verified the elution of