ALEXANDRA FERREIRA DA COSTA
FOOD NEOPHOBIA AND ITS ASSOCIATION WITH FOOD PREFERENCES AND DIETARY INTAKE OF ADULTS
[NEOFOBIA ALIMENTAR E A SUA ASSOCIAÇÃO COM AS PREFERÊNCIAS E INGESTÃO ALIMENTAR DE ADULTOS]
Universidade Fernando Pessoa Faculdade Ciências da Saúde
3
ALEXANDRA FERREIRA DA COSTA
FOOD NEOPHOBIA AND ITS ASSOCIATION WITH FOOD PREFERENCES AND DIETARY INTAKE OF ADULTS
[NEOFOBIA ALIMENTAR E A SUA ASSOCIAÇÃO COM AS PREFERÊNCIAS E INGESTÃO ALIMENTAR DE ADULTOS]
Universidade Fernando Pessoa Faculdade Ciências da Saúde
4
Alexandra Ferreira da Costa
FOOD NEOPHOBIA AND ITS ASSOCIATION WITH FOOD PREFERENCES AND DIETARY INTAKE OF ADULTS
[NEOFOBIA ALIMENTAR E A SUA ASSOCIAÇÃO COM AS PREFERÊNCIAS E INGESTÃO ALIMENTAR DE ADULTOS]
______________________________________ (Alexandra Ferreira da Costa)
Orientador: Professora Andreia Oliveira Trabalho Complementar apresentado à Universidade Fernando Pessoa como parte dos requisitos para obtenção do grau de licenciado em Ciências da Nutrição
Food neophobia and its association with food preferences and dietary intake of adults
Alexandra Costa1, Cláudia Silva 1, Andreia Oliveira1,2
1 Faculty of Health Sciences, University Fernando Pessoa, Portugal 2 EPIUnit - Institute of Public Health, University of Porto, Portugal
Corresponding Author:
Alexandra Costa
University Fernando Pessoa Faculty of Health Sciences
Rua Carlos da Maia, 296 | 4200 – 150 Porto Tel. +351 225074630; E-mail: 29826@ufp.edu.pt
Acknowledgments: The authors thank all colleagues from the University Fernando Pessoa, involved in the collection and editing of data.
6
Neofobia alimentar e sua associação com as preferências e ingestão alimentar de adultos
Alexandra Costa1, Claúdia Silva 1, Andreia Oliveira1,2
1Faculdade de Ciências da Saúde, Universidade Fernando Pessoa, Portugal 2EPIUnit – Instituto de Saúde Pública da Universidade do Porto, Portugal
Autor para correspondência:
Alexandra Costa
Universidade Fernando Pessoa Faculdade de Ciências da Saúde
Rua Carlos da Maia, 296 | 4200 – 150 Porto Tel. +351 225074630; E-mail: 29826@ufp.edu.pt
Agradecimentos: Os autores agradecem a todos os colegas da Universidade Fernando Pessoa, envolvidos na colheita e edição da informação.
7 Abstract
Background: Food neophobia has been associated with less healthy food choices and with poorer overall dietary quality, but it may also affect food preferences. The objective of this study was to assess the association of both food preferences and dietary intake with food neophobia in a sample of Portuguese adults. Methods: A cross-sectional study was conducted in a non-probabilistic sample of 229 adults, aged 18 to 84 years. Food Neophobia was measured with the Pliner’s and Hobden’s Food Neophobia Scale, previously validated. To assess the dietary intake over the previous 12 months, a validated semi-quantitative food frequency questionnaire was applied. We defined a dietary pattern - the Healthy Diet Indicator (measuring adherence to dietary guidelines) to summarise the effects of overall dietary intake. Generalised linear models were performed to test those associations in multivariate analyses (β̂ and the respective 95% confidence intervals (95%CI), controlled for sex, age and education). Results: Food neophobia was negatively associated with a general liking for the act of eating (β̂=-2.976, 95%CI:-5.324;-0.993) and with reduced preferences for specific foods, such as fruit and vegetables, game meat, oily fish, seafood, fish soup, and traditional Portuguese dishes with blood. Those with higher food neophobia showed a lower consumption of fruits and vegetables, but a higher consumption of milk and codfish, a very popular Portuguese dish. However, food neophobia did not affect the macronutrients and energy intake, as well as sodium, added sugars and fibre intake. Adherence to a healthy dietary pattern was not significantly associated with food neophobia. Conclusions: Our data indicate that the food neophobia level decreases the consumption and the preference for specific foods, but has no impact on a healthy dietary pattern.
Key words: Food neophobia; food preferences; diet; dietary intake; diet quality; dietary pattern; epidemiologic study, adults.
8 Resumo:
Introdução: A neofobia alimentar tem sido associada com escolhas alimentares menos saudáveis e com uma menor qualidade da alimentação no geral, mas pode também influenciar as preferências alimentares. O objetivo deste estudo foi avaliar a associação entre as preferências e a ingestão alimentar e a neofobia alimentar numa amostra de adultos portugueses. Métodos: Foi realizado um estudo transversal numa amostra não probabilística de 229 adultos, com idades entre os 18 e os 84 anos. A Neofobia Alimentar foi avaliada através da Escala de Neofobia de Pliner e Hobden, previamente validada. Para avaliar a ingestão alimentar nos últimos 12 meses, foi aplicado um questionário semi-quantitativo de frequência alimentar anteriormente validado. Foi também definido um padrão alimentar de Alimentação Saudável (que mede a adesão a recomendações dietéticas) para resumir o efeito da ingestão alimentar global. Foram realizados modelos lineares generalizados para testar as associações em análise multivariada (β’ e os respetivos intervalos de confiança a 95% (IC95%), ajustados para sexo, idade e escolaridade). Resultados: A neofobia alimentar associou-se a um menor gosto em geral pelo ato de comer (β̂= -2,976, 95%IC: -5,324; -0,993) e a uma menor preferência por alimentos específicos, como fruta e produtos hortícolas, carne de caça, peixe gordo, marisco, sopa de peixe e alguns pratos tradicionais portugueses. Indivíduos com maior neofobia alimentar apresentaram um menor consumo de hortofrutícolas, mas um maior consumo de leite e bacalhau, um prato popular Português. No entanto, a neofobia alimentar não afetou a ingestão de macronutrientes e de energia, assim como a de sódio, açúcares adicionados e fibras. A adesão a um padrão alimentar saudável não se mostrou significativamente associada à neofobia alimentar. Conclusão: Os nossos resultados indicam que o nível de neofobia alimentar afeta o consumo e a preferência por alimentos específicos, mas não parece ter influência num padrão alimentar saudável.
Palavras-chave: neofobia alimentar, preferência alimentares, alimentação, consumo alimentar, qualidade da dieta; padrão alimentar; estudo epidemiológico; adultos
9 1. Introduction
In day-to-day life, individuals are faced with numerous food choices. The decision of what food to eat is a highly complex process involving several factors, such as sensory perceptions and experiences, food habits and beliefs, health-related factors, price, convenience, mood, and behaviours, like food neophobia (1-3). Food neophobia is defined as a reluctance to eat novel foods, and it is a characteristic of omnivorous animals, including humans (4). Food neophobia has its origins early in evolutionary development, and has been hypothesized to occur due to the “Omnivore’s Dilemma’’, i.e. due to the conflict that we face when we need to seek new foods to meet our nutritional needs and the fear that what we are about to eat can be toxic or poisoned food, and therefore harmful (5).In fact, the food rejection can be explained by fear of its adverse consequences, but also by the dislike of its sensory characteristics, or disgust, due to the idea of the food’s nature or origin (6).
Food neophobia is a very complex attitude that varies widely throughout life. The literature suggests that neophobia tends to decrease over the years, and in general, reaches a peak between two and six years-old and stabilise in the adult life (7). The intensity of food neophobia varies widely between individuals and can be affected by cultural and economic aspects beyond age, such as gender, and also by the genetics (8-11). Although it may have a strong genetic influence, food neophobia can be changed throughout life, especially in the first years of life (12). Several studies suggest that regular and repeated exposure to taste unfamiliar foods increases children's liking and consumption of those foods (12-14).
Throughout evolution, food neophobia may have given a selective advantage by preventing the ingestion of toxic or poisoned food, but nowadays that the food safety is, generally, guaranteed, may also have adverse impacts in food choices affecting the quality and variety of the diet (6, 15). Some previous studies suggest that food neophobia is associated with less healthy food choices, a fewer consumption of fruit vegetables and fish and with poorer overall dietary quality (8, 15-22). In some studies, it was also observed that individuals with a high level of neophobia had a lower intake of protein (15, 18, 23, 24) mono- unsaturated fats, and magnesium (23). The association with the
10
total energy intake seems to be controversial; while some studies report a positive association (24), others report a negative or null association (8, 18, 23).
Although some previous studies have described some food groups less frequently consumed by more neophobic individuals (11, 17, 22, 25), it is not clear from the literature the association with food preferences, that has been more scarcely discussed in both adults (26) and children (22) It would be interesting to see is the association of food neophobia is the same with both food intake and preferences in the same population.
Therefore, the aim of the present study was to assess the association of food neophobia with food preferences and dietary intake in a sample of Portuguese adults.
Therefore, the aim of the present study was to assess the association of food neophobia with food preferences and dietary intake in a sample of Portuguese adults.
2. Methods 2.1. Participants
A cross-sectional study was conducted in a non-probabilistic sample of 229 adults, aged 18 to 84 years. The inclusion criteria were being 18 years or older, Portuguese and able to read, interpret and provide written answers. Out of the 229 invited participants, seven were excluded because they did not present information for the main variables of interest. The final sample included 223 participants (133 women and 90 men).
The participants’ characteristics are described in Table 1. Of the 223 individuals, 40% were male and 57% female, their mean age was 37.6 years (standard deviation=17.3), with the most prevalent ages (60%) being 18-39 years.
The study protocol was approved by the Ethics Committee of the University Fernando Pessoa. The present study was performed according to the principles established by the Declaration of Helsinki. All participants signed an informed consent form to participate in the study. Data confidentiality was assured.
2.2.Data collection
Data were collected between October and November 2016. Two self-administered questionnaires were used. The first one gathered information about sociodemographic characteristics, drinking habits, food preferences, food neophobia and self-reported body
11
weight and height. The other was a semi-quantitative food frequency questionnaire used to assess dietary intake) over the previous 12 months.
2.2.1. The Food Neophobia Scale
The most widely used tool to measure the neophobia level is the Food Neophobia Scale (FNS) developed by Pliner and Hobden (4). The FNS is an auto-assessment questionnaire, in which the participants must indicate their agreement to ten statements about their willingness to try novel foods on a 7-point Likert scale. Five of the statements indicate a low food neophobia, in that questions the coding was reversed. The final score was obtained by summing up the individual scores for each statement, being the possible range from 10 to 70. A high score represents less willingness to try new or unfamiliar foods (neophobia), while a lower score indicates more willingness to try novel foods (neophiliac) (4, 6). For missing values of a single statement in the questionnaire, the respective median of the total answers was imputed.
This scale was originally developed and validated in Canada (4) and has been applied in several different samples, including the Portuguese population (27-30). In this study, we used the Portuguese translation of the FNS, already tested in a Portuguese sample (30). Internal consistency of the FNS in the current data, as measured by Cronbach's α, was 0.80, indicating a good internal consistency. No, standardise cut-off values exist for classifying individuals as ’food neophobics’ or ‘food neophilics’ according to their FNS score, a thus the final score was used as continuous variable.
2.2.2. Food Preferences
To assess food preferences, a self-administered questionnaire was developed. The questionnaire had 32 items divided into ten different groups (meat; fish; seafood; eggs; vegetables; fruits; junk food; soup; Traditional Portuguese food and Spicy Food). Foods were chosen to represent major food groups and foods frequently consumed by the Portuguese. Responses of preference against each food were evaluated using a 5-point Likert scale: ‘’dislikes’’ to ‘’ likes a lot'’. Responses were scored from 1 to 5, with a higher score indicative of greater liking of a given food or food group. The internal consistency of the questionnaire, assessed by the Cronbach's α, was 0.79, indicating a good internal consistency.
12
2.2.3. The Food Frequency Questionnaire (FFQ)
Dietary intake over the previous 12 months was assessed with a semi-quantitative food frequency questionnaire. The questionnaire comprises a list of 86 foods or food groups and a closed section with nine categories of frequency of consumption ranging from “never or less than once a month” to “six or more times a day”; it also includes two other closed sections for the average portion consumed (lower, equal or higher than the mean portion size) and the seasonal variation of consumption. Detailed information on the development, structure, validity and reproducibility of the food frequency questionnaire is reported elsewhere (31, 32). Food consumption was converted into total energy and nutritional intake with the software Food Processor Plus® (ESHA Research, Salem-Oregon, 1997), which has been adapted to the traditional Portuguese foods.
Participants with an energy intake greater than 5,000kcal/day or smaller than 500kcal/day (33) were excluded for the dietary intake analysis (n=5).
2.2.4. The Healthy Diet Indicator
To summarise the effects of overall dietary intake, a dietary pattern was defined, by using a hypothesis-oriented approach. The Healthy Diet Indicator (HDI) was calculated by using the dietary guidelines for the prevention of chronic diseases, defined by the World Health Organization (WHO) (34). From the 15 dietary items listed in the WHO guideline, eight were included in the score, as originally suggested. Alcohol intake was added, using as cut point the recommendations of the American Heart Association (15g/day of alcohol intake for females and 30 g/day for males) (35).We applied a dichotomized scoring method used in the original HDI study (36), i.e. if a person’s intake was within the recommended range according to WHO guidelines this variable was coded as 1; otherwise, it was coded as 0. The HDI was the sum of all these dichotomous variables and had a range of 0–9 points, with 9 points indicating full agreement with the dietary guidelines.
2.2.5. Other data
Sociodemographic characteristics, such as sex, age and education level were used as confounders of the tested associations. Complete number of age and schooling years were reported; age as a continuous variable and education in a closed question with 8 categories, grouped into four: Elementary school (≤4 years), Middle school (5-6 years),
13
High school (7-11 years), and College (> 12 years). Income was also reported, by selecting one out of x options.
Self-reported weight and height were reported and used to calculate body mass index (BMI) as weight over the squared height (37). Obesity status was defined according to the World Health Organization criteria (34).
Physical exercise practice was gathered as a dichotomy question. 2.3.Statistical Analysis
Descriptive and inferential statistics were calculated. The baseline characteristics of the participants were expressed as the mean ± standard deviation (SD) for continuous variables and number and percentages for categorical variables.
To examine differences in neophobia level according to dietary intake and food preferences, generalised linear models were used, with the calculation of beta coefficients and the respective 95% confidence intervals (β̂, 95% CI). Three models were tested: 1) crude; 2) adjusted for sociodemographic data, such as sex, age and educational level and a third model with further adjustment for body mass index. The latter adjustment did not modify the associations (results not showed) and thus model 2 was assumed as the final model. An interaction effect of sex was tested in the study associations, but no effect was found (results were not stratified by sex).
Statistical significance was considered with a significance level of 5% (P < 0,05). Data were analysed using IBM SPSS (Statistical Package for Social Sciences), Statistics 23.0(SPSS Inc., Chicago, IL, USA).
3. Results
In the study sample, the food neophobia score ranged from 10 to 68 (from a possible range of 10-70). The sample mean score was 37.5 (SD 11.2). Men scored (38.1, SD 11.3) slightly higher than women (37.1, SD 11.1), but this difference was not statistically significant.
The association between liking of various foods and food neophobia is shown in Table 2. In multivariate analysis, a general liking for the act of eating was associated with lower scores of food neophobia (β̂= -2.976, 95%CI: -5.324; -0.993). Food neophobia was
14
also inversely associated with the liking of fruit and vegetables, game meat, oily fish, seafood, fish soup, and some traditional Portuguese dishes.
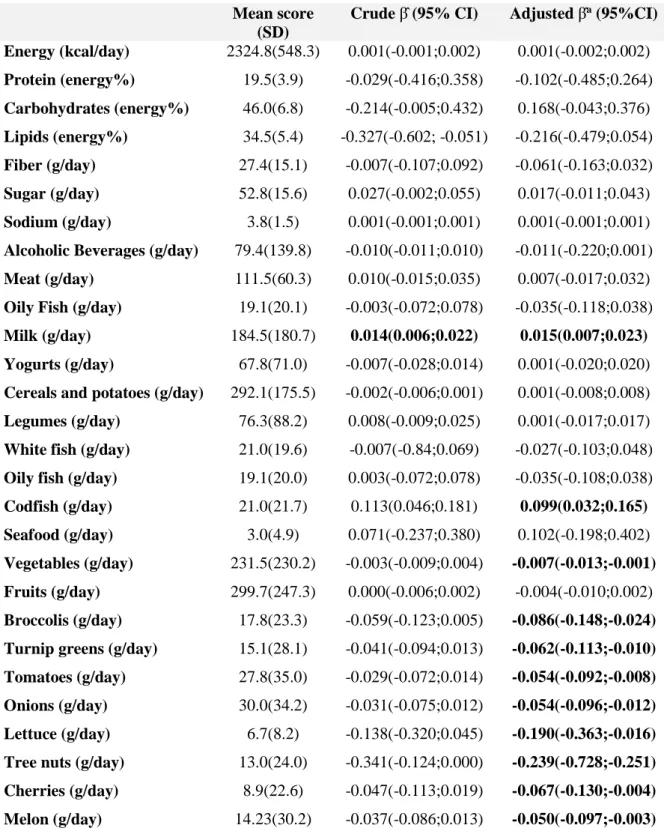
Results of the association between dietary and nutritional intake and food neophobia are presented in Table 3. No associations were found between the macronutrients and energy intake as well as sodium, added sugars and fibre with food neophobia. Nonetheless, individuals who consume specific food items seem to have significantly different food neophobia levels. Individuals with higher food neophobia scores consume fewer fruits and vegetables, specifically some types, like broccolis, turnip greens, onions, lettuce, tomatoes, tree nuts, cherries and melon. No associations with the intake of meat and fish were found, except for codfish, a traditional product of Portuguese cuisine. The consumption of this fish increases with increasing food neophobia score. The same positive association was found with milk.
We used the HDI to measure overall dietary quality and access the influence of a particular dietary pattern in food neophobia. The median of the HDI was 5 points (from a possible range of 0-9). Adherence to the HDI was not significantly associated with food neophobia (β’= -0.691; 95%CI: -1.832; 0.499).
4. Discussion
In the present study, we aimed to evaluate the association of food preferences and dietary intake with food neophobia. We found that food neophobia was negatively associated with food preferences of certain foods as well as the general liking for the act of eating and seems to influence the consumption of specific food items.
For almost half of the listed food items, we found a negative association of food neophobia with the ratings of liking, including for fruit, vegetables, animal protein-foods and traditional dishes with blood.
These findings are in concordance with the results of previous studies in children and adults (17, 22, 25,26). A study that evaluated the association of food neophobia with food preferences in preschoolers kids found significant effects on preferences for all food groups especially for fruit, vegetables and meats. More neophobic children liked a narrower range of food and disliked more food items (22). Similar results were observed in adults; individuals with high levels of food neophobia presented a lower level of
15
preferences for a large selection of foods (26) and liked less some types of foods, like vegetables (17, 22).
These results suggest that food neophobia that is defined as the reluctance of unknown food products (4) may negatively affect the general liking of eating, but it is more evident for specific foods. In Portugal, several traditional dishes, such as “Arroz de Cabidela” are prepared with animal’s blood, which is more able to trigger disgust or aversion. This is interesting to show because in one hand they are part of our traditional food habits, and thus they are not unknown foods, but the disgust (of fruit and vegetables) or aversion (for certain types of meat and blood) have overcome this.
Regarding the association with dietary habits, we did not find any significant association between the intake of total energy and macronutrients and food neophobia, which is supported by some previous studies (21, 38). Still, only a few studies and most of them focused on children, analysed the effects of food neophobia with these dietary components, and the results are controversial (18, 21, 23, 24). We also did not find any association with the intake of fibre, sodium and added sugars.
However, the food neophobia level seems to affect the consumption of specific food items from various food groups. Most of the significant associations were negative, i.e. more intake precludes less food neophobia. Our findings parallel the results of other studies that associated food neophobia with lower intake of vegetables (17-19, 39). In contrast, a positive association was observed between the consumption of codfish and food neophobia. This fish is a much liked traditional and typical food in Portugal (in the current study, the mean liking score was among the highest). The intake of milk was also positively associated with food neophobia.
The selective preferences and consumption of more neophobic individuals may be linked with the concept of ‘picky eating’. Picky eating is characterised by eating from a narrow range of accepted foods, firmness about the preparation and presentation of preferred foods, and unwillingness to try new foods (40). Increased levels of pickiness were also associated with higher levels of neophobia. The tendency to reject novel foods is closely related to the tendency to reject less tasty and less familiar foods (18, 41). This may help to explain why more neophobic subjects consume more traditional dishes, like codfish and very familiar foods (since birth), such as milk.
16
Furthermore, to discard the possibility of nil associations due to minimal effects of single foods or nutrients, we tested the effect of a dietary pattern in food neophobia, but no significant association was found. Dietary pattern analysis offers an advantage over examining of consumption of foods or nutrients alone, as it considers overall food intake, and allows for the identification of patterns rather than single foods or nutrients in isolation. This observation suggests that food neophobia seems to have a little impact on dietary quality, which contrasts with previous literature (15, 21), but it is not possible to directly compare the results because these studies did not use a dietary pattern to estimate the dietary quality. In addition, we cannot discard the possibility of lack of power to detect such associations.
Some limitations of the present study should be discussed. The relatively small sample size and the cross-sectional design may have hampered the detection of some of the associations. Nonetheless, we had power to detect some of them, and we have tested the association with a global dietary pattern, which has the advantage of detecting associations if the isolate effects are too small. Moreover, the cross-sectional nature of the present study is not so questionable, because there is plausibility for the neophobia trait appears before food preferences and intake take place. It is, however, important to highlight that this is a convenience sample and most of the individuals had between 18-39 years. Therefore the generalisation to the population (external validity) should be done with care. Nevertheless, internal validity was assured as we have used measures that have been previously validated and used with Portuguese adult samples, such as the FNS (4) and the FFQ (31, 32). Furthermore, the FFQ has the advantage of assessing the usual intake, minimising the effect of the day-to-day variation in food choices.
5. Conclusion
The findings of this study provide further understandings of the influence of food neophobia on dietary habits of adults. Higher food neophobia was associated with a lower general liking for the act of eating and lower preferences for fruit and vegetables, animal protein-foods, and some traditional dishes. We also found that the food neophobia level decreases the consumption of specific foods, particularly some types of fruit and vegetables. However, has no impact on a healthy dietary pattern.
17 6. References
1. Vabø M, Hansen H. The relationship between Food Preferences and Food Choice.pdf. International Journal of Business and Social Science. 2014;5(7).
2. Eertmans A, Victoir A, Vansant G, Van den Bergh O. Food-related personality traits, food choice motives and food intake: Mediator and moderator relationships. Food Quality and Preference. 2005;16(8):714-26.
3. Köster EP. Diversity in the determinants of food choice: A psychological perspective. Food Quality and Preference. 2009;20(2):70-82.
4. Pliner P, Hobden K. Development of a scale to measure the trait of food neophobia in humans. Appetite. 1992;19:105–120.
5. Armelagos GJ. Brain evolution, the determinates of food choice, and the omnivore's dilemma. Crit Rev Food Sci Nutr. 2014;54(10):1330-41.
6. Pliner P, Salvy SJ. Food neophobia in humans. In: Shepherd R, Raats M, editors. The Psychology of Food Choice. Wallingford: CABI; 2006. pp. 75–92.
7. Dovey TM, Staples PA, Gibson EL, Halford JC. Food neophobia and 'picky/fussy' eating in children: a review. Appetite. 2008;50(2-3):181-93.
8. Knaapila A, Tuorila H, Silventoinen K, Keskitalo K, Kallela M, Wessman M, et al. Food neophobia shows heritable variation in humans. Physiol Behav. 2007;91(5):573-8.
9. Flight I, Leppard P, Cox DN. Food neophobia and associations with cultural diversity and socio-economic status amongst rural and urban Australian adolescents. Appetite. 2003;41(1):51-9.
10. Edwards JS, Hartwell HL, Brown L. Changes in food neophobia and dietary habits of international students. J Hum Nutr Diet. 2010;23(3):301-11.
11. Olabi A, Najm NEO, Baghdadi OK, Morton JM. Food neophobia levels of Lebanese and American college students. Food Quality and Preference. 2009;20(5):353-62. 12. Wardle J, Herrera M-L, Cooke L, Gibson E. Modifying children’s food preferences:
the effects of exposure and reward on acceptance of an unfamiliar vegetable. European Journal of Clinical Nutrition. 2003;(57):341-8.
13. Laureati M, Bergamaschi V, Pagliarini E. School-based intervention with children. Peer-modeling, reward and repeated exposure reduce food neophobia and increase liking of fruits and vegetables. Appetite. 2014;83:26-32.
18
14. De Cosmi V, Scaglioni S, Agostoni C. Early Taste Experiences and Later Food Choices. Nutrients. 2017;9(2).
15. Knaapila AJ, Sandell MA, Vaarno J, Hoppu U, Puolimatka T, Kaljonen A, et al. Food neophobia associates with lower dietary quality and higher BMI in Finnish adults. Public Health Nutr. 2015;18(12):2161-71.
16. MacNicol SAM, Murray SM, Austin EJ. Relationships between personality, attitudes and dietary behaviour in a group of Scottish adolescents. Personality and Individual Differences. 2003;35(8):1753-64.
17. Siegrist M, Hartmann C, Keller C. Antecedents of food neophobia and its association with eating behavior and food choices. Food Quality and Preference. 2013;30(2):293-298.
18. Cooke L, Wardle J, Gibson EL, Sapochnik M, Sheiham A, Lawson M. Demographic, familial and trait predictors of fruit and vegetable consumption by preschool children. Public Health Nutr [Internet]. 2004;7. Available from: https://doi.org/10.1079/PHN2003527
19. Knaapila A., Silventoinen K., Broms U., Rose R.J., Perola M., Kaprio J., & Tuorila H. Food neophobia in young adults: Genetic architecture and relation to personality, pleasantness and use frequency of foods, and body mass index–a twin study. Behavior Genetics.2011. 41: 512–521.
20. Guzek D, Glabska D, Lange E, Jezewska-Zychowicz M. A Polish Study on the Influence of Food Neophobia in Children (10-12 Years Old) on the Intake of Vegetables and Fruits. Nutrients. 2017;9(6).
21. Falciglia GA, Couch SC, Gribble LS, Pabst SM, Frank R. Food Neophobia in Childhood Affects Dietary Variety. Journal of the American Dietetic Association. 2000;100(12):1474-81.
22. Russell CG, Worsley A. A population-based study of preschoolers' food neophobia and its associations with food preferences. J Nutr Educ Behav. 2008;40(1):11-9. 23. Capiola A, Raudenbush B. The Effects of Food Neophobia and Food Neophilia on
Diet and Metabolic Processing. Food and Nutrition Sciences. 2012;03(10):1397-403. 24. Rossbach S, Foterek K, Schmidt I, Hilbig A, Alexy U. Food neophobia in German adolescents: Determinants and association with dietary habits. Appetite. 2016;101:184-91.
19
25. Tuorila, H., Lähteenmäki, L., Pohjalainen, L., and Lotti, L. (2001). Food neophobia among the Finns and related responses to familiar and unfamiliar foods. Food Quality and Preference.2001;12:29-37.
26. Jaeger SR, Rasmussen MA, Prescott J. Relationships between food neophobia and food intake and preferences: Findings from a sample of New Zealand adults. Appetite. 2017;116:410-22.
27. Damsbo-Svendsen M, Frost MB, Olsen A. A review of instruments developed to measure food neophobia. Appetite. 2017;113:358-67.
28. Fernández-Ruiz V, Claret A, Chaya C. Testing a Spanish-version of the Food Neophobia Scale. Food Quality and Preference. 2013;28(1):222-5.
29. Ritchey PN, Frank RA, Hursti UK, Tuorila H. Validation and cross-national comparison of the food neophobia scale (FNS) using confirmatory factor analysis. Appetite. 2003;40(2):163-73.
30. Pauperio A, Severo M, Lopes C, Moreira P, Cooke L, Oliveira A. Could the Food Neophobia Scale be adapted to pregnant women? A confirmatory factor analysis in a Portuguese sample. Appetite. 2014;75:110-6.
31. Lopes C. Reproducibility and validity of a semi-quantitative food-frequency questionnaire. In: Diet and acute myocardial infarction: a population-based case-control study [In Portuguese]. University of Porto 2000. p.79-115.
32. Lopes C, Aro A, Azevedo A, Ramos E, Barros H. Intake and adipose tissue composition of fatty acids and risk of myocardial infarction in a male Portuguese community sample. J Am Diet Assoc 2007; 107:276-286.
33. Willett WC, Lenart E. Reproducibility and validity of food-frequency questionnaires. In: Willett WC, editor. Nutritional Epidemiology. 2. Chapter 6. Oxford University Press. 1998. pp. 101–147.
34. World Health Organization. Diet, nutrition and the prevention of chronic diseases. Report of a Joint WHO/FAO Expert Consultation. Geneva: World Health Organization. 2003.
35. Lichtenstein AH, Appel LJ, Brands M, Carnethon M, Daniels S, Franch HA et al. Diet and lifestyle recommendations revision 2006: a scientific statement from the American Heart Association Nutrition Committee. Circulation 2006; 114: 82-96.
20
36. Huijbregts P, Feskens E, Räsänen L, Fidanza F, Nissinen A, Menotti A, Kromhout D. Dietary pattern and 20 year mortality in elderly men in Finland, Italy, and The Netherlands: longitudinal cohort study. BMJ. 1997 Jul 5;315(7099):13–17.
37. Clinical guidelines on the identification, evaluation, and treatment of overweight and obesity in adults: executive summary. Expert Panel on the Identification, Evaluation, and Treatment of Overweight in Adults. Am J Clin Nutr 1998; 68: 899-917.
38. K. Maslin, K. Grimshaw, E. Oliver, G. Roberts, S. H. Arshad, T. Dean, et al. Taste preference, food neophobia and nutritional intake in children consuming a cows’ milk exclusion diet: a prospective study. Journal of Human Nutrition and Dietetics. 2016;26(6):786-96.
39. Helland SH, Bere E, Bjornara HB, Overby NC. Food neophobia and its association with intake of fish and other selected foods in a Norwegian sample of toddlers: A cross-sectional study. Appetite. 2017;114:110-7.
40. Taylor CM, Wernimont SM, Northstone K, Emmett PM. Picky/fussy eating in children: Review of definitions, assessment, prevalence and dietary intakes. Appetite. 2015;95:349-59.
41. Galloway AT, Lee Y, Birch LL. Predictors and consequences of food neophobia and pickiness in young girls. J Am Diet Assoc. 2003;103(6):692-8.
21
Table 1 Study sample characteristics
Sex n a (%) Female 133(59.6) Male 90(40.4) Education level Elementary school 29(13.0) Middle school 50(22,4) High school 81(36.3) College 63(28.3)
Household Monthly Income
<530€ 19(8.5) 530€-1060€ 80(65.9) 1061€-2000€ 70(31.4) >2000€ 50(22.4) Self-reported BMI b Underweight 8(3.6) Normal weight 131(58.7) Overweight 55(24.7) Obese 18(8.1) Physical Exercise Yes 109(51.1) No 114(48.9)
a N varies between 219 and 223, differences due to missing values.
b Body mass index (BMI) was calculated as the body weight (kg) divided by the square of the body height
22
Table 2 Mean food preferences of the study sample and association with food neophobia in crude
and multivariate analyses.
Mean (SD)
Crude β̂ (95% CI) Adjusted β̂ a (95%CI)
General liking for the act of eating 4.4(0.7) -4.065(-6.266;-1.842) -2.976(-5.324;-0.993)
Vegetables 4.0(1.0) -2.367(-3.758;-0.975) -3.139(-4.490;-0.788) Fruit 4.3(0.8) -2.233(-4.075;-0.390) -2.550(-4.282;-0.818) Beef 3.9(1.0) 0.086(-0.568;2.324) 1.063(-0.367;2.494) Pork 3.6(1.2) 0.996(-0.295;2.287) 0.739(-0.549;2.028) Poultry meat 4.1(0.9) -1.393(-3.052;0.266) -0.913(-2.501;0.676) Game meat 3.1(1.4) -1.864(-2.943;-0.784) -2.158(-3.20;-1.114) Oily fish 3.9(1.1) -2.086(-3.393;-0.778) -1.947(-3.190; -0.703) White fish 3.9(1.1) -0.144(-1.527;1.239) -0.530(-1.890;0.831) Seafood 4.0(1.2) -2.036(-3.274;-0.798) -1.661(-2.844; -0.478) Eggs 4.3(0.7) -1.444(-3.440;0.552) 0.495(-2.410;1.420) ‘’Junk’’ Food 3.5(1.4) -1.441(-2.506;-0.376) -0.222(-1.389;0.944) Vegetable soup 4.2(1.0) -0.498(-2.041;1.045) -0.877(-2.362;0.608) Fish soup 2.6(1.5) -1.912(-2.872;-0.952) -1.720(-2.665;-0.775) Chicken broth 3.8(1.3) -0.026(-1.175;1.124) -0.157(-1.242;0.927) Tomato soup 2.5(1.4) -1.274(-2.308;-0.241) -1.021(-2.013;-0.300) ‘’Caldo Verde’’ 4.1(1.1) -0.043(-1.388;0.481) -0.827(-1.388;1.303)
Seafood cream soup 3.0(1.4) -1.691(-2.707;-0.675) -1.649(-2.683;-0.696)
‘’Tripas à moda do Porto’’ 3.2(1.6) -0.048(-1.175;1.124) -0.756(-1.664;0.195)
‘’Papas de Sarrabulho’’ 2.9(1.6) 0.086(-0.829;1.001) -0.696(-1.611;0.220) ‘’Rojões à minhota’’ 3.8(1.1) -0.354(-1.671;0.932) -0.756(-2.006;0.494) ‘’Cozido à portuguesa’’ 3.8(1.2) 0.234(-1.033;1.502) -0.804(-2.045;0.438) ‘’Arroz de cabidela’’ 3.3(1.6) -0.534(-1.459;0.392) -1.099(-1.928;-0.216) Codfish 4.1(1.1) 0.197(-1.191;1.585) -0.513(-1.840;0.221) ‘’Arroz à valenciana’’ 3.5(1.2) -1.274(-2.36;0.239) -1.023(-2.244;0.198) Roasted lamb 3.4(1.6) -0.132(-1.086;0.822) -0.383 (-1.300; 0.534) ‘’Coelho à caçador’’ 3.0(1.3) -0.776(-1.782;0.231) -1.095(-2.063; -0.126) ‘’Francesinha’’ 4.0(1.3) -2.164(-3.317;-1.011) -1.071(-2.345;0.203) Spicy Food 3.4(0.7) -1.590(-2.605;-0.575) -0.876(-1.932;0.179)
Abbreviations: SD: standard deviation; 95% CI = 95% Confidence interval. Significant associations are in bold-type.
a Model adjusted for sex, age and educational level.
23
Table 3 Mean daily intake of nutrients and foods from the food frequency questionnaire (FFQ)
and their association with food neophobia in crude and multivariate analyses.
Mean score (SD)
Crude β̂ (95% CI) Adjusted β̂a (95%CI)
Energy (kcal/day) 2324.8(548.3) 0.001(-0.001;0.002) 0.001(-0.002;0.002) Protein (energy%) 19.5(3.9) -0.029(-0.416;0.358) -0.102(-0.485;0.264) Carbohydrates (energy%) 46.0(6.8) -0.214(-0.005;0.432) 0.168(-0.043;0.376) Lipids (energy%) 34.5(5.4) -0.327(-0.602; -0.051) -0.216(-0.479;0.054) Fiber (g/day) 27.4(15.1) -0.007(-0.107;0.092) -0.061(-0.163;0.032) Sugar (g/day) 52.8(15.6) 0.027(-0.002;0.055) 0.017(-0.011;0.043) Sodium (g/day) 3.8(1.5) 0.001(-0.001;0.001) 0.001(-0.001;0.001)
Alcoholic Beverages (g/day) 79.4(139.8) -0.010(-0.011;0.010) -0.011(-0.220;0.001)
Meat (g/day) 111.5(60.3) 0.010(-0.015;0.035) 0.007(-0.017;0.032)
Oily Fish (g/day) 19.1(20.1) -0.003(-0.072;0.078) -0.035(-0.118;0.038)
Milk (g/day) 184.5(180.7) 0.014(0.006;0.022) 0.015(0.007;0.023)
Yogurts (g/day) 67.8(71.0) -0.007(-0.028;0.014) 0.001(-0.020;0.020)
Cereals and potatoes (g/day) 292.1(175.5) -0.002(-0.006;0.001) 0.001(-0.008;0.008)
Legumes (g/day) 76.3(88.2) 0.008(-0.009;0.025) 0.001(-0.017;0.017)
White fish (g/day) 21.0(19.6) -0.007(-0.84;0.069) -0.027(-0.103;0.048)
Oily fish (g/day) 19.1(20.0) 0.003(-0.072;0.078) -0.035(-0.108;0.038)
Codfish (g/day) 21.0(21.7) 0.113(0.046;0.181) 0.099(0.032;0.165)
Seafood (g/day) 3.0(4.9) 0.071(-0.237;0.380) 0.102(-0.198;0.402)
Vegetables (g/day) 231.5(230.2) -0.003(-0.009;0.004) -0.007(-0.013;-0.001)
Fruits (g/day) 299.7(247.3) 0.000(-0.006;0.002) -0.004(-0.010;0.002)
Broccolis (g/day) 17.8(23.3) -0.059(-0.123;0.005) -0.086(-0.148;-0.024)
Turnip greens (g/day) 15.1(28.1) -0.041(-0.094;0.013) -0.062(-0.113;-0.010)
Tomatoes (g/day) 27.8(35.0) -0.029(-0.072;0.014) -0.054(-0.092;-0.008)
Onions (g/day) 30.0(34.2) -0.031(-0.075;0.012) -0.054(-0.096;-0.012)
Lettuce (g/day) 6.7(8.2) -0.138(-0.320;0.045) -0.190(-0.363;-0.016)
Tree nuts (g/day) 13.0(24.0) -0.341(-0.124;0.000) -0.239(-0.728;-0.251)
Cherries (g/day) 8.9(22.6) -0.047(-0.113;0.019) -0.067(-0.130;-0.004)
Melon (g/day) 14.23(30.2) -0.037(-0.086;0.013) -0.050(-0.097;-0.003)
Abbreviations: SD: standard deviation; 95% CI = 95% Confidence interval. Significant associations are in bold-type.