Geneic parameters, adaptability and stability to
selecion of yellow passion fruit hybrids
Alírio José da Cruz Neto
1, Raul Castro Carriello Rosa
2, Eder
Jorge de Oliveira
2, Sidnara Ribeiro Sampaio
3, Idália Souza dos
Santos
3, Plácido Ulisses Souza
3, Adriana Rodrigues Passos
1and
Onildo Nunes de Jesus
2*Abstract: The objecive of this study was to evaluate the stability and adapt -ability, using the method of harmonic means of the relaive performance of geneic values and to esimate the geneic components of variance and average via mixed models of 14 genotypes of passion fruit in three environments. Data were obtained in a random block design with three replicates and nine plants per plot. For the hybrids in the inal validaion phase, the esimates of heritability and geneic gains in the evaluated environments showed good prospects for selecion of superior genotypes. There was a pronounced efect of genotype-environment interacion (GxE) for all traits invesigated except fruit length, percentage of pulp, soluble solids, itratable acidity and SS/TA raio. The most stable and adaptable hybrids in the evaluated environments were BRS Gigante Amarelo, HFOP-09, H09-09, GP09-02, GP09-03 and BRS Sol do Cerrado.
Key words: P. edulis Sims, GxE interacion, breeding, mixed models.
Crop Breeding and Applied Biotechnology 16: 321-329, 2016 Brazilian Society of Plant Breeding. Printed in Brazil htp://dx.doi.org/10.1590/1984-70332016v16n4a48
ARTICLE
*Corresponding author: E-mail: onildo.nunes@embrapa.br
Received: 22 July 2016 Accepted: 15 September 2016
1 Universidade Estadual de Feira de Santana, 44.036-900, Feira de Santana, BA, Brazil
2 Embrapa Mandioca e Fruicultura,
44.380-000, Cruz das Almas, BA, Brazil
3 Universidade Federal do Recôncavo da
Bahia, Centro de Ciências Agrárias, Ambien-tais e Biológicas, 44.380-000, Cruz das Almas,
BA, Brazil
INTRODUCTION
Brazil is highlighted as a large producer of yellow passion fruit (Passilora edulis Sims), and the demand for it has grown both in the markets for processed juice and natural fruits (Gonçalves et al. 2007). The latest oicial igures show Brazilian producion of 694,539 tons in an area of 50,837 hectares (IBGE 2015), with the Northeast region standing out, accouning for 64.90% of the producion. Considering the Northeast Region, Bahia State is responsible for approximately 65.96% and 42.81% of the naional producion (IBGE 2015). Despite such numbers, producivity in Bahia is considered low (12.21 t ha-1) compared to the
culture’s potenial, which is esimated to be 40 to 50 t ha-1 (Freitas et al. 2011).
it is important for genotypes to be more stable and adapted to the adverse environmental condiions of the region for which they are being bred (Cruz et al. 2004, Silva et al. 2014).
Phenotypic stability is related to choosing the genotypes that are least afected by environmental variaions, whereas adaptability is based on the ideniicaion of genotypes with predictable behaviors that can adjust to the environmental variaions (Cruz et al. 2004). Currently there are several models to evaluate stability and adaptability of genotypes (Oliveira et al. 2014). The REML/BLUP method has been widely used in this type of study, as the geneic evaluaion is conducted by predicing the genotypic values of selecion candidates. This method provides beter experimental accuracy, and it is more eicient than analysis of variance, especially in cases with unbalanced data (Resende 2004). The predicted geneic values can be used to esimate the adaptability and stability of genotypes using the harmonic mean of the relaive performance of geneic values (HMRPGV), allowing esimaing adaptability and stability simultaneously in a single parameter (Resende 2004). These methods have been successfully used on soybean, cofee, sugarcane and cashew crops, and their results have been found to be superior to convenional methods (Carvalho et al. 2008, Maia et al. 2009, Borges et al. 2010, Silva et al. 2015).
The objecive of this study was to evaluate the stability and adaptability using the MHPRVG method and to esimate the geneic components of variance and average via mixed models (REML/BLUP) of 14 genotypes of passion fruit in three environments.
MATERIAL AND METHODS
Fourteen genotypes were evaluated - nine (GP09-02, GP09-03, H09-02, H09-07, H09-09, H09-14, and H09-30) of which from crosses between selected parents, through the Passion Fruit Plant Geneic Improvement Program of the Embrapa Cassava and Fruits (Embrapa Mandioca e Fruicultura), and ive commercial hybrids (BRS Sol do Cerrado, BRS Rubi do Cerrado, BRS Gigante Amarelo, FB200, and FB300). The study was conducted in three producing centers in Bahia State: Dom Basílio (lat 13° 45′ S, long 41°46′ W and alt 200m asl), Rio de Contas (lat 3° 34′ S, long 41° 48′ W and alt 1300m asl), and Lençóis (lat 12° 36’ S, long 41° 20’ W and alt 402m asl).
Each plant was spaced at 2.0 m in the row. The rows were spaced 2.5 m apart. The training system consisted of verical espaliers with 12 wire, 2.0 m above the ground. The agricultural traits, the number of fruits per plot, and the producivity (TCP) – expressed in t ha-1, – were evaluated. Regarding the physical and chemical characterisics of fruits,
ive fruits were considered per plot, and the following traits measured: fruit length (FL) in cm; fruit diameter (FD) in cm; peel thickness (PT) in mm; fruit mass (FM) in g; peel mass (PM) in g; pulp mass (PUM) in g; soluble solids (SS) in ºBrix, as measured with a digital refractometer; total itratable acidity (TA), expressed in mg citric acid per 100 mL juice, as determined through itraion with NaOH at 0.1mol L-1; percentage of pulp (PP), measured through the PUM/FM raio
in %; and the SS/TA raio. The measurements were performed at the peak of producion, once in the areas studied, produced plants are kept in the ield for a maximum of one year due to the incidence of foliar diseases.
A randomized block design was chosen, composed of 14 treatments distributed in three replicates with nine plants per plot. The following staisical model was adopted for the evaluaion of genotypes with one observaion per plot in three environments: y = X
r + Zg + Wi + e, where: y: is the data vector, r: is the vector of block means (ixed), g: genotypic efects (random), i: efects of the genotype x environment interacion (random), and e: is the vector of error (random). X, Z and W: are the matrixes of incidence of r, g and i, respecively. The esimates for variance components were produced based on the restricted maximum likelihood method (REML) where the following components of variance and geneic parameters were esimated: σ 2
g: genotypic variance. σ 2int: variance of the genotype x environment interacion.
σ 2
r: residual variance. σ 2p: individual phenotypic variance. h 2g: broad-sense heritability of individual plots; that is, of the total genotypic efects. h 2
mg: genotype average heritability, assuming full survival. Acgen: accuracy of the genotype selecion, assuming full survival. c 2
and the geneic gain resulted in the new average for the improved populaion. The esimates of geneic parameters and the adaptability and stability (HMRPGV - harmonic mean of the relaive performance of geneic values) were obtained by mixed models (REML/BLUP), through the use of the SELEGEN geneic and staisical sotware, model 54 (Resende 2007).
RESULTS AND DISCUSSION
The esimaion of geneic parameters is important to guide geneic breeding programs, as these predict geneic values and maximize selecion, thus helping the selecive process for recommendaion of new commercial materials (Farias Neto and Rezende 2001, Maia et al. 2009). The esimates for variance components are shown in Table 1. In general, the contribuion of the genotypic variance (σ 2
g) for the phenotypic variance (σ 2p) was 11.44 to 35.05% for producivity traits (TCP) and peel mass (PM), respecively. The variances of residual efects (σ 2
r) were the ones that most contributed to
σ 2
p, with variaions from 45.71 to 75.90% for fruit length and soluble solids, respecively. Since the evaluated traits are quanitaive and therefore highly inluenced by the environment, residual variance tends to be high (Atroch et al. 2013). Studies conducted with eucalyptus (Rosado et al. 2012) and clones of guarana plants (Atroch et al. 2013), were also found to have higher contribuions from the residual variance than the phenotypic variance. Studying passion fruit, Santos et al. (2015) reported higher values of environmental variance for fruit mass. In yellow passion fruit plant populaions, Viana et al. (2003) reported contribuions of 64% and 48% (fruit length and diameter) for the environmental variance.
The variance from the GxE interacion (σ 2
int) had the smallest contribuion to σ 2p, ranging from 10.00 to 23.12% for traits itratable acidity and total cumulaive producivity, respecively (Table 1). A low magnitude of GxE interacion (σ 2
int) indicates uniformity in the performance of genotypes according to environmental variaions and thereby greater adaptability and geneic stability of individuals (Maia et al. 2009, Rosado et al. 2012). The σ 2
int is associated with the coeicient determinaion of the efects of GxE interacion (c 2
int), since it represents the percentage of σ 2int present in σ 2p and therefore exhibits the same value (Table 1). Due to the lower σ 2
int/ c 2int, the genotypic correlaion between performances in the various environments (rgloc) showed values of 0.51 to 0.74 for most characterisics, except for total cumulaive producivity and pulp mass with 0.33 and 0.49, respecively (Table 1). However, the values are not yet high enough for all the characterisics, which reinforces the need to further study the adaptability and stability.
The residual coeicients’ variaion (CVr) ranged from 4.73% to 24.88% for FD and TCP, respecively (Table 1). In other fruit plants, such as the cashew tree, values of CVrclose to 34% were reported (Maia et al. 2009). Besides that, in passion fruit plants, Oliveira et al. (2008) reported CVr ranging from 4.76% for fruit length to 20.48% for number of
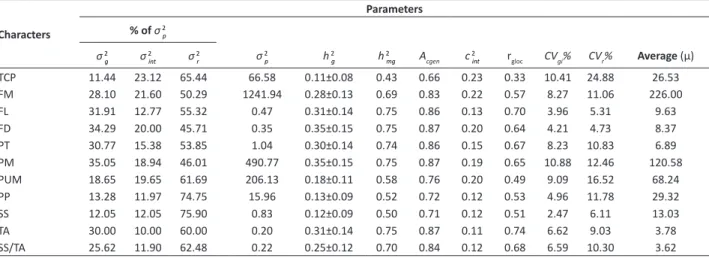
Table 1. Esimates of variance components (REML) in 14 yellow passion fruit hybrids evaluated in three locaions in the State of Bahia
for traits: total cumulaive producivity (TCP), fruit mass (FM), fruit length (FL), fruit diameter (FD), peel thickness (PT), peel mass (PM), pulp mass (PUM), percentage of pulp (PP), soluble solids (SS), itratable acidity (TA), and SS/TA raio
Characters
Parameters
% of σ 2
p
σ 2
g σ 2int σ 2r σ 2p h 2g h 2mg Acgen c 2int rgloc CVgi% CVr% Average (µ)
TCP 11.44 23.12 65.44 66.58 0.11±0.08 0.43 0.66 0.23 0.33 10.41 24.88 26.53 FM 28.10 21.60 50.29 1241.94 0.28±0.13 0.69 0.83 0.22 0.57 8.27 11.06 226.00 FL 31.91 12.77 55.32 0.47 0.31±0.14 0.75 0.86 0.13 0.70 3.96 5.31 9.63 FD 34.29 20.00 45.71 0.35 0.35±0.15 0.75 0.87 0.20 0.64 4.21 4.73 8.37 PT 30.77 15.38 53.85 1.04 0.30±0.14 0.74 0.86 0.15 0.67 8.23 10.83 6.89 PM 35.05 18.94 46.01 490.77 0.35±0.15 0.75 0.87 0.19 0.65 10.88 12.46 120.58 PUM 18.65 19.65 61.69 206.13 0.18±0.11 0.58 0.76 0.20 0.49 9.09 16.52 68.24 PP 13.28 11.97 74.75 15.96 0.13±0.09 0.52 0.72 0.12 0.53 4.96 11.78 29.32
SS 12.05 12.05 75.90 0.83 0.12±0.09 0.50 0.71 0.12 0.51 2.47 6.11 13.03
TA 30.00 10.00 60.00 0.20 0.31±0.14 0.75 0.87 0.11 0.74 6.62 9.03 3.78 SS/TA 25.62 11.90 62.48 0.22 0.25±0.12 0.70 0.84 0.12 0.68 6.59 10.30 3.62
σ 2
g: genotypic variance. σ 2int: variance of the genotype x environment interacion. σ 2r: residual variance. σ 2p: individual phenotypic variance. h 2g: broad-sense heritability of individual plots; that is, of the total genotypic efects. h 2
mg: genotype average heritability, assuming full survival. Acgen: accuracy of the genotype selecion, assuming full
survival. c 2
int: coeicient of determinaion of the genotype x environment interacion efects. rgloc: genotypic correlaion between performances in the various environments.
fruits. Although the adopion of a higher number of repeiions can contribute to environmental control and reduced residual coeicient variaion (CVr), the values are considered low for quanitaive a characterisic, which indicates good experimental quality (Rosado et al. 2012).
The genotypic coeicient of variaion (CVgi), ranged from 2.47% for the variable soluble solids (SS) to 10.88% of peel mass (PM) (Table 1) that indicates there was geneic variability among the analyzed hybrids. In another study of passion fruit, Viana et al. (2003) found variaions of 0.00 to 52.78% for the CVgi for the characterisics percentage of pulp and number of fruits. The values of CVr and CVgi inluence the accuracy staisics (Resende and Duarte 2007). The accuracy of the genotype selecion (Acgen), which is the square root of h 2
mg, relects the correlaion between the true genotypic value and the esimated values (Resende et al. 2002, Cargnelui-Filho and Storck 2009) and shows a good experimental quality and security in the selecion of superior genotypes (Carvalho et al. 2016). High accuracy values (0.71 to 0.87) were observed for most evaluated traits, except for total cumulaive producivity (0.66), which presented moderate accuracy in accordance with the classiicaion proposed by Resende and Duarte (2007) (Table 1). Furthermore, high values of this parameter indicate the existence of geneic variance among the genotypes (Maia et al. 2009).
Broad-sense heritability of individual plots (h 2
g) expresses the geneic variaion between genotypes, and it also supports the deiniion of the most suitable improvement methods to be used in breeding programs (Resende 2002). The values of h 2
g ranged from 0.11 for total cumulaive producivity to 0.35 for fruit diameter and peel mass, and were associated with high values of deviaions (Table 1), which indicates individual selecion may not be efecive. Santos et al. (2015), evaluated interspeciic progenies of passion fruit, and found similar results to this study, except for the traits PUM and SS, which were found to be 0.61 and 0.62, respecively, indicaing the possibility of successful individual selecion for those two traits. The esimated average heritability (h 2
mg) values were higher, varying from 0.43 to 0.75 (Table 1). The traits that were found to have the highest h 2
mg values (0.69 to 0.75) were fruit mass, peel thickness, fruit length, fruit diameter, itratable acidity, and peel mass. With the excepion of fruit mass, which obtained a similar value of 0.68, the remaining traits were higher than those observed by Viana et al. (2003) evaluaing yellow passion fruit plant populaions in two disinct environments. Oliveira et al. (2008) evaluaing in half-siblingprogenies of yellow passion fruit observed values lower of h 2
mg of 0.28, 0.30, 0.51, and 0.57 for variables percentage of pulp, fruit diameter, fruit length, and fruit mass, respecively. Moraes et al. (2005) found a larger value of h 2
mgfor fruit length and soluble solids, and a lower for fruit mass and fruit diameter, while evaluaing an F1 populaion of yellow passion fruit. High h
2
mg esimates demonstrate good geneic control of a trait, and high potenial for selecing superior genotypes. Thus, most of the observed variaion in the yellow passion fruit plants was geneic, allowing high selecive accuracy rates for most agricultural traits. However, the traits total cumulaive producivity, soluble solids, percentage of pulp, and pulp mass were found to have moderate values of 0.43, 0.50, 0.52, and 0.58, respecively (Table 1). These values relect the low geneic variance (11.44 to 18.65% of σ 2
p) and the high residual variance of 61.69 to 75.90% of σ 2p (Table 1). Thus, they tended to have low h 2
g, h 2mg and Acgen, and therefore smaller geneic gains for those traits (Table 1).
The diferences observed in the heritability esimate values is acceptable, as that is an esimate that can luctuate due to several factors, among them the geneic structure of the evaluated populaion (Santos et al. 2015), the changes in geneic and phenotypic parameters linked to the studied trait, the esimaion method, the diversity of the populaion, the evaluated environment, the sample size, and the experimental accuracy (Hallauer and Miranda Filho 1988). It is important to point out that the inferences from the geneic parameters that are deined in this study originate from the evaluaion of genotypes in three disinct environments. This makes the esimates more reliable (Resende and Dias 2000) and maximizes the geneic gains in the presence of the genotype x environment interacion (Costa et al. 2002). The studied populaion comprised genotypes in the inal evaluaion stage, from which geneic material was selected. However, even under these condiions, the genotypes sill exhibited geneic variability that can be used for selecion, through crosses aiming at increasing the frequency of favorable alleles.
environment, which is not desirable for development of new varieies (Maia et al. 2009). For the total cumulaive producivity trait (TCP), 57% of the hybrids were found to be superior to the general average (µ), which was 26.53 t ha-1
(Table 2). Genotypes BRS Gigante Amarelo, H09-09, GP09-03, BRS Rubi do Cerrado, and BRS Sol do Cerrado were, in that order, the ive best for that trait. The new average for this trait varied from 28.92 to 28.17 t ha-1 and gains ranged from
2.39 to 1.65 t ha-1 (Table 2). Those gains are promising for the passion fruit producive sector, as the observed values
for total cumulaive producivity exceed the naional average and the one for the State of Bahia, which are 13.66 t ha-1
and 12.21 t ha-1, respecively (IBGE 2015).
Fruit mass (FM) is an important characterisic for the in natura consumpion market, once larger fruits are preferred by consumers (Negreiros et al. 2007). Therefore, taking this informaion into consideraion, the ive best genotypes were BRS Gigante Amarelo, H09-30, HFOP-09, GP09-02, and H09-09, with gains from 38.97 to 14.60 g, respecively (Table
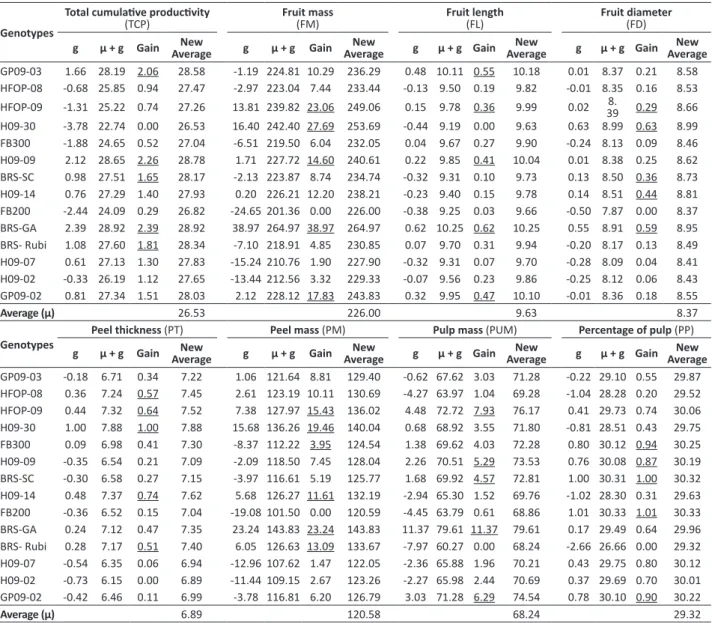
Table 2. Esimates of the genotypic efect; average predicted value in the environments, gain and new average in 14 yellow passion
fruit hybrids evaluated in three locaions in the State of Bahia for physical traits of fruits: total cumulaive producivity (TCP), fruit mass (FM), fruit length (FL), fruit diameter (FD), peel thickness (PT), peel mass (PM), pulp mass (PUM), and percentage of pulp (PP)
Genotypes
Total cumulaive producivity
(TCP) Fruit mass(FM) Fruit length(FL) Fruit diameter(FD)
g µ + g Gain AverageNew g µ + g Gain AverageNew g µ + g Gain AverageNew g µ + g Gain AverageNew
GP09-03 1.66 28.19 2.06 28.58 -1.19 224.81 10.29 236.29 0.48 10.11 0.55 10.18 0.01 8.37 0.21 8.58 HFOP-08 -0.68 25.85 0.94 27.47 -2.97 223.04 7.44 233.44 -0.13 9.50 0.19 9.82 -0.01 8.35 0.16 8.53 HFOP-09 -1.31 25.22 0.74 27.26 13.81 239.82 23.06 249.06 0.15 9.78 0.36 9.99 0.02 398. 0.29 8.66 H09-30 -3.78 22.74 0.00 26.53 16.40 242.40 27.69 253.69 -0.44 9.19 0.00 9.63 0.63 8.99 0.63 8.99 FB300 -1.88 24.65 0.52 27.04 -6.51 219.50 6.04 232.05 0.04 9.67 0.27 9.90 -0.24 8.13 0.09 8.46 H09-09 2.12 28.65 2.26 28.78 1.71 227.72 14.60 240.61 0.22 9.85 0.41 10.04 0.01 8.38 0.25 8.62 BRS-SC 0.98 27.51 1.65 28.17 -2.13 223.87 8.74 234.74 -0.32 9.31 0.10 9.73 0.13 8.50 0.36 8.73 H09-14 0.76 27.29 1.40 27.93 0.20 226.21 12.20 238.21 -0.23 9.40 0.15 9.78 0.14 8.51 0.44 8.81 FB200 -2.44 24.09 0.29 26.82 -24.65 201.36 0.00 226.00 -0.38 9.25 0.03 9.66 -0.50 7.87 0.00 8.37 BRS-GA 2.39 28.92 2.39 28.92 38.97 264.97 38.97 264.97 0.62 10.25 0.62 10.25 0.55 8.91 0.59 8.95 BRS- Rubi 1.08 27.60 1.81 28.34 -7.10 218.91 4.85 230.85 0.07 9.70 0.31 9.94 -0.20 8.17 0.13 8.49 H09-07 0.61 27.13 1.30 27.83 -15.24 210.76 1.90 227.90 -0.32 9.31 0.07 9.70 -0.28 8.09 0.04 8.41 H09-02 -0.33 26.19 1.12 27.65 -13.44 212.56 3.32 229.33 -0.07 9.56 0.23 9.86 -0.25 8.12 0.06 8.43 GP09-02 0.81 27.34 1.51 28.03 2.12 228.12 17.83 243.83 0.32 9.95 0.47 10.10 -0.01 8.36 0.18 8.55
Average (µ) 26.53 226.00 9.63 8.37
Genotypes
Peel thickness (PT) Peel mass (PM) Pulp mass (PUM) Percentage of pulp (PP)
g µ + g Gain AverageNew g µ + g Gain AverageNew g µ + g Gain AverageNew g µ + g Gain AverageNew
GP09-03 -0.18 6.71 0.34 7.22 1.06 121.64 8.81 129.40 -0.62 67.62 3.03 71.28 -0.22 29.10 0.55 29.87 HFOP-08 0.36 7.24 0.57 7.45 2.61 123.19 10.11 130.69 -4.27 63.97 1.04 69.28 -1.04 28.28 0.20 29.52 HFOP-09 0.44 7.32 0.64 7.52 7.38 127.97 15.43 136.02 4.48 72.72 7.93 76.17 0.41 29.73 0.74 30.06 H09-30 1.00 7.88 1.00 7.88 15.68 136.26 19.46 140.04 0.68 68.92 3.55 71.80 -0.81 28.51 0.43 29.75 FB300 0.09 6.98 0.41 7.30 -8.37 112.22 3.95 124.54 1.38 69.62 4.03 72.28 0.80 30.12 0.94 30.25 H09-09 -0.35 6.54 0.21 7.09 -2.09 118.50 7.45 128.04 2.26 70.51 5.29 73.53 0.76 30.08 0.87 30.19 BRS-SC -0.30 6.58 0.27 7.15 -3.97 116.61 5.19 125.77 1.68 69.92 4.57 72.81 1.00 30.31 1.00 30.32 H09-14 0.48 7.37 0.74 7.62 5.68 126.27 11.61 132.19 -2.94 65.30 1.52 69.76 -1.02 28.30 0.31 29.63 FB200 -0.36 6.52 0.15 7.04 -19.08 101.50 0.00 120.59 -4.45 63.79 0.61 68.86 1.01 30.33 1.01 30.33 BRS-GA 0.24 7.12 0.47 7.35 23.24 143.83 23.24 143.83 11.37 79.61 11.37 79.61 0.17 29.49 0.64 29.96 BRS- Rubi 0.28 7.17 0.51 7.40 6.05 126.63 13.09 133.67 -7.97 60.27 0.00 68.24 -2.66 26.66 0.00 29.32 H09-07 -0.54 6.35 0.06 6.94 -12.96 107.62 1.47 122.05 -2.36 65.88 1.96 70.21 0.43 29.75 0.80 30.12 H09-02 -0.73 6.15 0.00 6.89 -11.44 109.15 2.67 123.26 -2.27 65.98 2.44 70.69 0.37 29.69 0.70 30.01 GP09-02 -0.42 6.46 0.11 6.99 -3.78 116.81 6.20 126.79 3.03 71.28 6.29 74.54 0.78 30.10 0.90 30.22
Average (µ) 6.89 120.58 68.24 29.32
2). In this case, the new average predicion for the above genotypes regarding fruit mass are 264.97 to 240.61 g and producivity of 28.92 to 28.78 t ha-1 (Table 2), therefore with esimates of higher values in comparison to the ones
obtained for the UENF Rio Dourado culivar (Pio Viana et al. 2016).
The characterisics for fruits length and diameter are also appreciated by consumers, because this means greater number of seeds and thus higher percentage of pulp (Negreiros et al. 2007). However, it is desirable for these traits to be accompanied by smaller peel thickness at the moment of selecing new varieies (Neves et al. 2013). Among the ive best for fruit length and diameter, hybrids HFOP-09 and BRS Gigante Amarelo stood out, with respecive gains of 0.36 and 0.62 for fruit length, and 0.29 and 0.59 for fruit diameter (Table 2). There were respecive gains of 0.51 to 1.0, and 11.61 to 23.24 for the traits peel thickness and peel mass, with special menion to genotypes 30, HFOP-09, H09-14, and BRS Rubi do Cerrado, which were best for those traits. BRS Gigante Amarelo stood out with the highest gain for peel mass, with 23.24 (Table 2). High peel mass and peel thickness values are undesirable, as they do not contribute to percentage of pulp, especially in fruits for industrial processing (Medeiros et al. 2009).
Seed-free pulp mass and percentage of pulp are atracive traits to the juice industry, which establishes a minimum acceptable yield of 33% (Nascimento et al. 1999). For the PUM trait, the hybrids found to have the highest geneic gains were BRS Gigante Amarelo, HFOP-09, GP09-02, H09-09, and BRS Sol do Cerrado, with results ranging from 11.34 to 4.57 (Table 2). Those materials exceeded the general experimental average (68.24 g), ranging from 72.81 to 79.61 for the new predicted average. Regarding percentage of pulp, the best genotypes were FB200, BRS Sol do Cerrado, FB300, GP09-02, and H09-09, varying from 30.33 to 30.19 (Table 2). Genotypes H09-09, BRS Sol do Cerrado, and GP09-02 also showed large gains for pulp mass and percentage of pulp.
For the soluble solids, the genotypic average was similar to the new predicted average. This is possibly related to the lower gains, from 0.0 to 0.39 (Table 3). Sill, genotypes H09-30, FB200, H09-07, BRS Sol do Cerrado and HFOP-09 had a certain level gain for this trait (Table 3). Fruit pulp acidity is desirable for the agroindustry since higher acidity avoids microbiological deterioraion, allowing beter product conservaion as well as reducing the need for ariicial acid addiion (Freitas et al. 2011). For itratable acidity, the genotypes with best geneic gain were H09-30, BRS Gigante Amarelo, HFOP-09, HFOP-08, and H09-14 (Table 3). The values observed for TA were above the limit established by the Ministry of Agriculture, of 2.5% (Brasil 2003). From the SS/TA raio, it is possible to evaluate fruit lavors, since it expresses the raio between sugars and acids (Freitas et al. 2011). The ive best hybrids were H09-07, BRS Rubi do Cerrado, FB200,
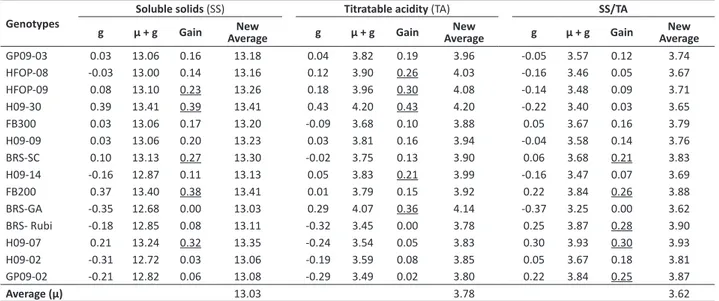
Table 3. Esimates of the genotypic efect, average predicted value in the environments, gain and new average in 14 yellow passion
fruit hybrids evaluated in three locaions in the State of Bahia for chemical traits of fruits: soluble solids (SS), itratable acidity (TA), SS/TA raio
Genotypes
Soluble solids (SS) Titratable acidity (TA) SS/TA
g µ + g Gain AverageNew g µ + g Gain AverageNew g µ + g Gain AverageNew
GP09-03 0.03 13.06 0.16 13.18 0.04 3.82 0.19 3.96 -0.05 3.57 0.12 3.74 HFOP-08 -0.03 13.00 0.14 13.16 0.12 3.90 0.26 4.03 -0.16 3.46 0.05 3.67 HFOP-09 0.08 13.10 0.23 13.26 0.18 3.96 0.30 4.08 -0.14 3.48 0.09 3.71 H09-30 0.39 13.41 0.39 13.41 0.43 4.20 0.43 4.20 -0.22 3.40 0.03 3.65 FB300 0.03 13.06 0.17 13.20 -0.09 3.68 0.10 3.88 0.05 3.67 0.16 3.79 H09-09 0.03 13.06 0.20 13.23 0.03 3.81 0.16 3.94 -0.04 3.58 0.14 3.76 BRS-SC 0.10 13.13 0.27 13.30 -0.02 3.75 0.13 3.90 0.06 3.68 0.21 3.83 H09-14 -0.16 12.87 0.11 13.13 0.05 3.83 0.21 3.99 -0.16 3.47 0.07 3.69 FB200 0.37 13.40 0.38 13.41 0.01 3.79 0.15 3.92 0.22 3.84 0.26 3.88 BRS-GA -0.35 12.68 0.00 13.03 0.29 4.07 0.36 4.14 -0.37 3.25 0.00 3.62 BRS- Rubi -0.18 12.85 0.08 13.11 -0.32 3.45 0.00 3.78 0.25 3.87 0.28 3.90 H09-07 0.21 13.24 0.32 13.35 -0.24 3.54 0.05 3.83 0.30 3.93 0.30 3.93 H09-02 -0.31 12.72 0.03 13.06 -0.19 3.59 0.08 3.85 0.05 3.67 0.18 3.81 GP09-02 -0.21 12.82 0.06 13.08 -0.29 3.49 0.02 3.80 0.22 3.84 0.25 3.87
Average (µ) 13.03 3.78 3.62
GP09-02, BRS Sol do Cerrado, with a new predicted average ranging from 3.93 to 3.83 (Table 3).
Signiicant diferences at the levels of 1 and 5% were observed in the deviance analysis among genotypes for traits fruit length and diameter, peel thickness, peel mass, itratable acidity, SS/TA raio, total cumulaive producivity and pulp mass. Regarding the GxE interacion, only variables fruit length, percentage of pulp, soluble solids, itratable acidity, and SS/TA raio, were not signiicant, which indicates low interacion efects for those traits (Table 4). This can also be observed by low values of σ 2
int (Table 1). A study conducted with half-sibling passion fruit progenies evaluated in two environments in Rio de Janeiro also found no GxE interacion for the same traits (Oliveira et al. 2008).
The detailed study of the GxE interacion allows selecing the best genotypes for the various environmental condiions, and it results from the esimated phenotypic adaptability and stability (Silva et al. 2014), which enable idenifying genotypes with behaviors that can be predicted according to environmental variaions. For selecion of the most stable and adaptable hybrid, it was the simultaneous selecion method based on performance of geneic values (HMRPGV). Depending on the evaluated trait, the genotypes were classiied diferently through HMRPGV values (Table 4). However, in general considering all the studied traits, hybrids BRS Gigante Amarelo, HFOP-09, H09-09, GP09-02 and GP09-03, and BRS Sol do Cerrado stood out (Table 4). The most relevant traits for recommending the release of a hybrid are producivity, fruit mass, fruit length and diameter, and percentage of pulp. For the producivity trait, the most stable and adaptable in various environments were the hybrids BRS Gigante Amarelo, GP09-03, H09-09, BRS Sol do Cerrado, and H09-14. For fruit mass, the following genotypes were highlighted: BRS Gigante Amarelo, H09-30, HFOP-09, GP09-02, and H09-09. Fruits with larger lengths and/or diameters tend to have larger peel mass and thickness, which are not appreciated especially by the juice industry, because they negaively inluence pulp mass and percentage of pulp (Negreiros et al. 2007, Freitas et al. 2011). However, hybrids BRS Gigante Amarelo, HFOP-09, H09-09, GP09-02, and BRS Sol do Cerrado were also found to have higher pulp mass, which indicates that this is not always a valid associaion (Table 4).
The chemical properies of fruits, such as soluble solids, itratable acidity and SS/TA raio are important to the juice industry. Passion fruit pulp with higher sugar levels results in a smaller number of fruits required to obtain concentrated juice at 50° Brix (Oliveira et al. 2008, Freitas et al. 2011). High acidity in the passion fruit juice is an important characterisic
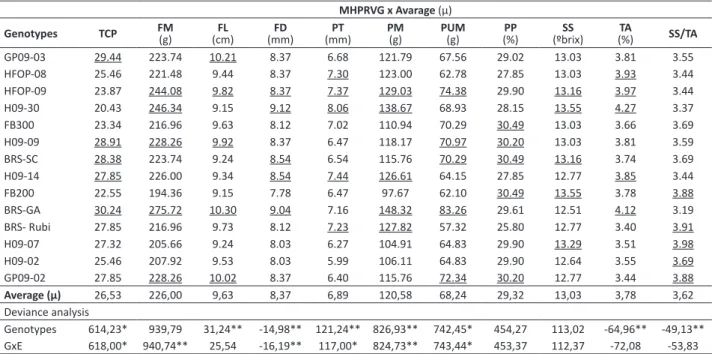
Table 4. Deviance analysis and stability and adaptability (HMRPGV x µ) in 14 yellow passion fruit hybrids evaluated in three locaions
in the State of Bahia for traits of fruits: total cumulaive producivity (TCP), fruit mass (FM), fruit length (FL), fruit diameter (FD), peel thickness (PT), peel mass (PM), pulp mass (PUM), percentage of pulp (PP), soluble solids (SS), itratable acidity (TA), SS/TA raio
MHPRVG x Avarage (µ)
Genotypes TCP FM(g) (cm)FL (mm)FD (mm)PT PM(g) PUM(g) (%)PP (ºbrix)SS (%)TA SS/TA
GP09-03 29.44 223.74 10.21 8.37 6.68 121.79 67.56 29.02 13.03 3.81 3.55 HFOP-08 25.46 221.48 9.44 8.37 7.30 123.00 62.78 27.85 13.03 3.93 3.44 HFOP-09 23.87 244.08 9.82 8.37 7.37 129.03 74.38 29.90 13.16 3.97 3.44 H09-30 20.43 246.34 9.15 9.12 8.06 138.67 68.93 28.15 13.55 4.27 3.37 FB300 23.34 216.96 9.63 8.12 7.02 110.94 70.29 30.49 13.03 3.66 3.69 H09-09 28.91 228.26 9.92 8.37 6.47 118.17 70.97 30.20 13.03 3.81 3.59 BRS-SC 28.38 223.74 9.24 8.54 6.54 115.76 70.29 30.49 13.16 3.74 3.69 H09-14 27.85 226.00 9.34 8.54 7.44 126.61 64.15 27.85 12.77 3.85 3.44 FB200 22.55 194.36 9.15 7.78 6.47 97.67 62.10 30.49 13.55 3.78 3.88 BRS-GA 30.24 275.72 10.30 9.04 7.16 148.32 83.26 29.61 12.51 4.12 3.19 BRS- Rubi 27.85 216.96 9.73 8.12 7.23 127.82 57.32 25.80 12.77 3.40 3.91 H09-07 27.32 205.66 9.24 8.03 6.27 104.91 64.83 29.90 13.29 3.51 3.98 H09-02 25.46 207.92 9.53 8.03 5.99 106.11 64.83 29.90 12.64 3.55 3.69 GP09-02 27.85 228.26 10.02 8.37 6.40 115.76 72.34 30.20 12.77 3.44 3.88
Average (µ) 26,53 226,00 9,63 8,37 6,89 120,58 68,24 29,32 13,03 3,78 3,62
Deviance analysis
Genotypes 614,23* 939,79 31,24** -14,98** 121,24** 826,93** 742,45* 454,27 113,02 -64,96** -49,13** GxE 618,00* 940,74** 25,54 -16,19** 117,00* 824,73** 743,44* 453,37 112,37 -72,08 -53,83
for the processing, due to the possibility of reducing the addiion of acidiiers (Nascimento et al. 1999). The SS/TA raio is considered one of the most pracical ways to evaluate the lavor of fruits. Acidity is decisive for the SS/TA raio, because high levels of acidity decrease the value of this raio (Freitas et al. 2011). Inexpressive gains were observed for soluble solids, itratable acidity and SS/TA raio, which explains the similarity between the genotypic values free of interacion (µ+g) and the new average. Besides that, the chemical characterisics were notsigniicant for the GxE interacion (Table 4), so the genotypes presented similar behavior in the evaluated environments.
According to the results, the average heritability of the genotypes for the six evaluated traits in the three environments was found to have medium to high values, which also indicates the existence of enough variability for the selecion of superior genotypes, even if they are hybrids in the last validaion stage. There were GxE interacions for all traits except for fruit length, percentage of pulp, soluble solids, itratable acidity and SS/TA raio. The hybrids that were the most stable and adaptable to the evaluated environments, and hence can be recommended for commercial planing in Bahia, are BRS Gigante Amarelo, BRS Sol do Cerrado, HFOP-09, H09-09, GP09-02 and GP09-03.
ACKNOWLEDGEMENTS
The authors would like to thank the Conselho Nacional de Desenvolvimento Cieníico e Tecnológico (CNPq) e Coordenação de Aperfeiçoamento de Pessoal de Nível Superior (CAPES) for the scholarships and the Fundação de Amparo à Pesquisa do Estado da Bahia (FAPESB: RED0004/2012) for the inancial support and Bioenergia Orgânicos (Agreement FUNARBE 7697) for making experimental ields available.
REFERENCES
Atroch AL, Nascimento FJ and Resende MDV (2013) Seleção genéica simultânea de progênies de guaranazeiro para produção, adaptabilidade e estabilidade temporal. Revista de Ciências Agrárias 56: 347-352.
Borges V, Ferreira PV, Soares L, Santos GM and Santos AMM (2010) Seleção de clones de batata-doce pelo procedimento REML/BLUP.
Acta Scieniarum Agronomy25: 643-649.
Brasil - Ministério da Agricultura e do Abastecimento (2003) Instrução Normaiva Nº 12 de 4 de Setembro de 2003. Diário Oicial. Brasília, Seção1: 72-76.
Cargnelui Filho A and Storck L (2009) Medidas do grau de precisão experimental em ensaios de compeição de culivares de milho.
Pesquisa Agropecuária Brasileira44: 111-117.
Carvalho AD, Fritsche Neto R and Geraldi IO (2008) Esimaion and predicion of parameters and breeding values in soybean using REML/ BLUP and Least Squares. Crop Breeding and Applied Biotechnology 8: 230-235.
Carvalho LP, Farias FJC, Morello CL and Teodoro PE (2016) Uso da metodologia REML/BLUP para seleção de genóipos de algodoeiro com maior adaptabilidade e estabilidade produiva. Bragania 75: 314-321.
Costa RB, Resende MDV, Gonçalves PS and Silva MA (2002) Individual mulivariate REML/BLUP in the presence of genotype x environment interacion in rubber tree (Hevea) breeding. Crop Breeding and Applied Biotechnology2: 131-140.
Cruz CD, Regazzi AJ and Carneiro PCS (2004) Modelos Biométricos Aplicados ao Melhoramento Genético.2nd edn, Imprensa
Universitária, Viçosa, 480p.
Farias Neto JT and Resende MDV (2001) Aplicação da metodologia de modelos mistos (REML/BLUP) na esimação de componentes de variância e predição de valores genéicos em pupunheira (Bactris gasipaes). Revista Brasileira Fruicultura23: 320-324.
Freitas JPX, Oliveira EJ, Cruz Neto AJ and Santos LR (2011) Avaliação de recursos genéticos do maracujazeiro-amarelo. Pesquisa Agropecuária Brasileira46: 1013-1020.
Gonçalves GM, Pio Viana A, Bezerra Neto, FV, Pereira MG and Pereira TNS (2007) Seleção e herdabilidade na predição de ganhos genéicos em maracujá-amarelo. Pesquisa Agropecuária Brasileira42: 193-198.
Hallauer AR and Miranda Filho JB (1988) Quanitaive geneics in maize breeding. Iowa State University Press, Ames, 664p.
IBGE (2015) Banco de dados agregados: produção agrícola municipal. Sistema IBGE de Recuperação Automáica - SIDRA.Available at <htp://www.sidra.ibge.gov.br/>. Accessed on 06 Out, 2016. Maia MCC, Resende MDV, Paiva JR, Cavalcani JJV and Barros LMB (2009)
Seleção simultânea para produção, adaptabilidade e estabilidade genoípicas em clones de cajueiro, via modelos mistos. Pesquisa Agropecuária Tropical39: 43-50.
Medeiros SAF, Yamanishi OK, Peixoto JR, Pires MC, Junqueira NTV and Ribeiro JGBL (2009) Caracterização ísico-química de progênies de maracujá-roxo e maracujá-azedo culivados no Distrito Federal.
Revista Brasileira Fruicultura31: 492-499.
Moraes MC, Geraldi IO, Mata FP and Vieira MLC (2005) Geneic and phenotypic parameter esimates for yield and fruit quality traits from a single wide cross in yellow passion fruit. Hort Science 40:
1978-1981.
Agropecuária Brasileira34: 2353-2358.
Negreiros JRS, Araújo Neto SE, Álvares VS, Lima VA and Oliveira TK (2007) Caracterização de frutos de progênies de meios-irmãos de maracujazeiro-amarelo em Rio Branco - Acre. Revista Brasileira Fruicultura30: 431-437.
Neves CG, Nunes OJ, Ledo CAS and Oliveira EJ (2013) Avaliação agronômica de parentais e híbridos de maracujazeiro- amarelo. Revista Brasileira Fruicultura35: 191-198.
Oliveira EJ, Fraife Filho GA and Freitas JPX (2014) Desempenho produivo e interação genóipo x ambiente em híbridos e linhagens de mamoeiro.
Bioscience Journal30: 402-410
Oliveira EJ, Santos VS, Lima, DS, Machado MD, Lucena RS, Mota TBN and Castellen MS (2008) Seleção em progênies de maracujazeiro-amarelo com base em índices mulivariados. Pesquisa Agropecuaria Brasileira43: 1543-1549.
Pio Viana A, Silva FHL, Gonçalves GM, Silva MGM, Ferreira RT, Pereira TNS, Pereira MG, Amaral Júnior AT and Carvalho GF (2016) UENF Rio Dourado: a new passion fruit culivar with high yield potenial. Crop Breeding and Applied Biotechnology 16: 250-253.
Resende MDV and Dias LAS (2000) Aplicação da metodologia de modelos mistos (REML/BLUP) na estimação de parâmetros genéticos e predição de valores genéicos adiivos e genoípicos em espécies fruíferas. Revista Brasileira Fruicultura22: 44-52.
Resende MDV (2004) Métodos estatísticos ótimos na análise de experimentos de campo.Embrapa Florestas, Brasília, 25p.
Resende MDV (2007) Software SELEGEM – REML/BLUP: sistema
estaísico e seleção genéica computadorizada via modelos lineares mistos.Embrapa Florestas, Brasília, 359p.
Resende MDV (2002) Genéica biométrica e estaísica no melhoramento de plantas perenes.Embrapa Informação Tecnológica, Brasília, 975p.
Resende MDV and Duarte JB (2007) Precisão e controle de qualidade em experimentos de avaliação de culivares. Pesquisa Agropecuária Tropical37: 182-194.
Rosado AM, Rosado TB, Alves AA, Laviola BG and Bhering LL (2012) Seleção simultânea de clones de eucalipto de acordo com produividade, estabilidade e adaptabilidade. Pesquisa Agropecuária Brasileira 47: 964-971.
Santos EA, Viana AP, Freitas JCO, Rodrigues DL, Tavares RF, Paiva CL and Souza MM (2015) Genotype selecion by REML/BLUP methodology in a segregaing populaion from na interspeciic Passilora spp. crossing. Euphyica 208: 493-507.
Silva PR, Bisognin DA, Locatelli AB and Storck L (2014) Adaptability and stability of corn hybrids grown for high grain yield.Acta Scieniarum Agronomy36: 175-181.
Silva FL, Barbosa MHP, Resende MDV, Peternelli LA and Pedrozo CA (2015) Eiciency of selecion within sugarcane families via simulated individual BLUP. Crop Breeding and Applied Biotechnology15: 1-9.