_________________________________
1 Parte da Dissertação de MS do primeiro autor, através do Programa de Pós-Graduação em Engenharia Agrícola, UNIOESTE. 2 Professor Eixo Recursos Naturais do Instituto Federal de Mato Grosso do Sul; Rodovia MS - 473, Km 23 - Fazenda Santa Bárbara,
s/n; 79750-000, Nova Andradina- MS, Brasil.
3 Professor do programa de Pós-Graduação em Engenharia Agrícola - PGEAGRI, CCET; Universidade Estadual do Oeste do Paraná;
Rua Universitária 2069; 85819-110, Cascavel-PR, Brasil.
4 Professora Eixo Recursos Naturais do Instituto Federal de Mato Grosso do Sul; Rodovia MS - 473, Km 23 - Fazenda Santa Bárbara,
s/n; 79750-000, Nova Andradina- MS, Brasil.
CONSTRUCTION AND CALIBRATION OF TDR PROBES FOR VOLUMETRIC WATER CONTENT ESTIMATION IN A DISTROFERRIC RED LATOSOL
ROSIMALDO SONCELA2, SILVIO C. SAMPAIO3, MARCIO A. VILAS BOAS3, MARIA H.
F. TAVARES3, ADRIANA SMANHOTTO4
ABSTRACT: The determination of volumetric water content of soils is an important factor in irrigation management. Among the indirect methods for estimating, the time-domain reflectometry (TDR) technique has received a significant attention. Like any other technique, it has advantages and disadvantages, but its greatest disadvantage is the need of calibration and high cost of acquisition. The main goal of this study was to establish a calibration model for the TDR equipment, Trase System Model 6050X1, to estimate the volumetric water content in a Distroferric Red Latosol. The calibration was carried out in a laboratory with disturbed soil samples under study, packed in PVC columns of a volume of 0.0078m3. The TDR probes were handcrafted with three rods and 0.20m long. They were vertically installed in soil columns, with a total of five probes per column and sixteen columns. The weightings were carried out in a digital scale, while daily readings of dielectric constant were obtained in TDR equipment. The linear model v = 0.0103 Ka + 0.1900 to estimate the studied volumetric water content showed an excellent coefficient of determination (0.93), enabling the use of probes in indirect estimation of soil moisture.
KEYWORDS: apparent dielectric constant; time-domain reflectometry; soil water content.
CONSTRUÇÃO E CALIBRAÇÃO DE SONDAS DE TDR PARA ESTIMATIVA DA UMIDADE VOLUMÉTRICA EM UM LATOSSOLO VERMELHO DISTROFÉRRICO
RESUMO: A determinação da umidade volumétrica de solos é fator importante no manejo da irrigação. Dentre os métodos indiretos para a estimativa, a técnica da reflectometria no domínio do tempo (TDR) vem recebendo significativo enfoque. Como toda técnica, apresenta vantagens e desvantagens, entre elas a maior desvantagem é a necessidade de calibração e alto custo de aquisição. O objetivo principal deste trabalho foi estabelecer um modelo de calibração para o equipamento de TDR, Trase System Modelo 6050X1 para a estimativa da umidade volumétrica em um Latossolo Vermelho distroférrico típico. A calibração foi realizada em condições de laboratório, utilizando amostras deformadas do solo em estudo, acondicionadas em colunas de PVC com volume de 0,0078 m3. As sondas de TDR, fabricadas artesanalmente com três hastes e 0,20 m de comprimento, foram instaladas verticalmente nas colunas de solo, em um total de cinco sondas por coluna, totalizando dezesseis colunas. Realizaram-se as pesagens com balança digital e leituras diárias da constante dielétrica com o equipamento TDR. O modelo linear v 0,0103Ka0,1900 para estimativa da umidade volumétrica do solo em estudo apresentou excelente coeficiente de determinação (0,93), viabilizando o uso das sondas na estimativa indireta da umidade do solo.
Rosimaldo Soncela, Silvio C. Sampaio, Marcio A. Vilas Boas, Maria H. F. Tavares, Adriana Smanhotto 920
INTRODUCTION
The time-domain reflectometry (TDR) has been widely used by researchers in studies involving the properties of the soil-water-plant system, especially for being a non-destructive method and for enabling the automation of data collection (COELHO et al., 2006; TRINTINALHA et al., 2004).
The TDR technique is based on measuring the displacement time t in nanoseconds (ns) of a sequence of pulses in a microwave transmission line (antenna) composed of two or more steel rods of length L (cm) which are introduced into the soil (TOMMASELLI & BACCHI, 2001). The course time is related to the average dielectric constant of the medium in which the guide probe is inserted (QUEIROZ et al., 2005). Each material has a dielectric constant (K) ranging between 1 and 80. The air has a minimum value of K equal to 1, while the water has a maximum value of K equal to 80. A mixture of materials will have an apparent dielectric constant (Ka) to be determined by the composition of materials, ranging from 1 to 80 (NOBORIO, 2001).
The value of the apparent dielectric constant (Ka) of the air-soil-water complex may, then, be determined by Equation 1 (NOBORIO, 2001):
L
(ct)
Ka
2
(1)In which:
L – length of guides in centimeters; t – transit time in nanoseconds; and
c – speed of light (approximately 29.9977 cm ns-1).
The cubic polynomial model presented by TOPP et al. (1980), which determines the moisture in function of Ka, and is considered universal and used by many TDR equipment does not take into account the specific characteristics of each soil type. Thus, several researchers have noted that the relations proposed by TOPP et al. (1980) has no applicability for all types of soils, since some attributes – salt content, density, among others – may give variations in measurements (SILVA & GERVÁSIO, 1999; TOMMASELLI & BACCHI, 2001; COELHO et al., 2006). A constant concern in the use of the equipment is with the probes supplied by the manufacturer of the device, which, when damaged, have a high cost for its replacement (COELHO et al. 2005). To solve this problem, several probes of lower cost are being built in Brazil, using domestic materials (SOUZA et al., 2006; SANTORO et al., 2009).
Thus, it is necessary to obtain a calibration model for each soil type, and this is considered an acceptable drawback compared to the advantages it presents compared to other techniques (GONÇALVES et al., 2011; Souza et al., 2006). The calibration process consists of collecting data from the device or system to be calibrated, of the collection of reference values and of the analysis of the relation between them (CICHOTA, 2003). In this context, the aim of this study was to evaluate the functionality of the probes constructed and determine the specific calibration curve for the Distroferric Red Latosol, facilitating the accurate determination of volumetric water content.
MATERIAL AND METHODS
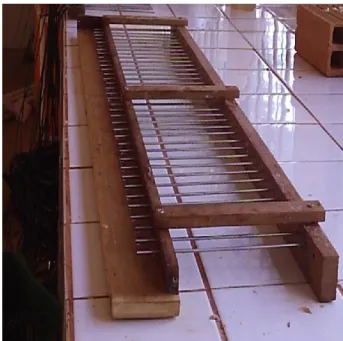
FIGURE 1. Wood template with parallel rods of stainless steel, separated by 0.02 meters, constructed for assembly of TDR probes.
Then, the connector was mounted on one end of the coaxial cable, and, at the other end, welding was performed on the two side rods. The inner conductor was welded on the central rod of each probe. For a better fixation of the rods to the coaxial cable, prior to welding, the rods were cleaned with a solution of 1% phosphoric acid. The capacitor was welded on two rods, i.e., a central and a lateral (Figure 2). The function of this is to change the punctual impedance on the conductive guide, which improves the calibration process using the Trase System TDR equipment (COELHO et al., 2006).
Rosimaldo Soncela, Silvio C. Sampaio, Marcio A. Vilas Boas, Maria H. F. Tavares, Adriana Smanhotto 922
Then, the epoxy resin of the catalyst was prepared, putting it in the closed part of the template. After twenty-four hours, the template was removed and each probe was sawed to perform the division, carefully not to damage it. Figure 3 shows the probe ready.
FIGURE 3. Example of TDR probe made at the Laboratory of Water Resources and Environmental Sanitation of the State University of West Paraná (UNIOESTE), Campus of Cascavel city (PR).
The probes were tested in water to check the variability between the probes and the correction of the readings of Ka.
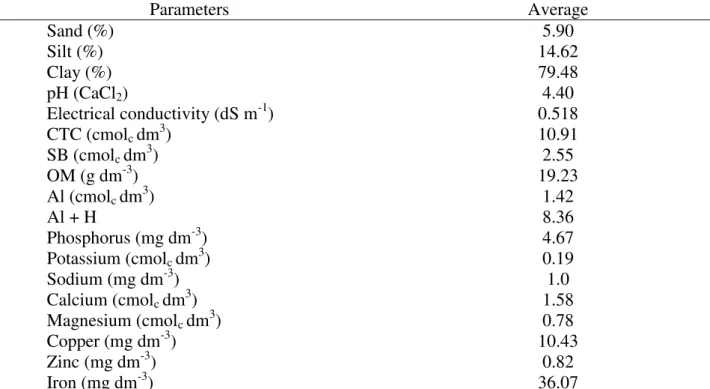
Then, sixteen columns were constructed using segments of PVC tubing (0.30m high and 0.195m of internal diameter) and TNT mesh at one end. The columns were filled with soil (TFSA), collected in the Experimental Center of Agricultural Engineering – NEEA, located in Cascavel city (PR), classified as Distroferric Red Latosol (EMBRAPA, 2006), at the 0-20cm layer. The physical and chemical properties are given in Table 1.
TABLE 1. Chemical and granulometric analyses of the soil used for the calibration of the TDR probes.
Parameters Average
Sand (%) 5.90
Silt (%) 14.62
Clay (%) 79.48
pH (CaCl2) 4.40
Electrical conductivity (dS m-1) 0.518
CTC (cmolc dm3) 10.91
SB (cmolc dm3) 2.55
OM (g dm-3) 19.23
Al (cmolc dm3) 1.42
Al + H 8.36
Phosphorus (mg dm-3) 4.67
Potassium (cmolc dm3) 0.19
Sodium (mg dm-3) 1.0
Calcium (cmolc dm3) 1.58
Magnesium (cmolc dm3) 0.78
Copper (mg dm-3) 10.43
Zinc (mg dm-3) 0.82
Iron (mg dm-3) 36.07
The columns were “hit” three times on a rubber base to settle the soil within the column, thus avoiding the formation of voids. Then, five probes were installed in each column (Figure 4).
FIGURE 4.Column of soil with the distribution of TDR probes.
The columns were placed in a container with 2/3 of water at the column height during 48 hours. Immediately, the first readings of the Ka were made. Then, the columns were weighted, through dry weight after assembly of the columns and through wet weight after saturation, and the gravimetric water content was obtained of each column of Equation 2 (EMBRAPA, 1997). After weighing, the columns were placed on a bench and maintained with the soil surface exposed to permit loss of water by evaporation, and the weightings and TDR readings were made daily, the soil density was calculated for each column through soil volume in the column and the weight of soil.
g
v
*
(2)In which: v
– Volumetric water content, (%);
g
– Gravimetric water content
– Soil density;
c – speed of light (approximately 29.9977 cm ns-1).
Readings of Ka values were made daily with constructed probes, of water content based on volume, from the water content based on the assembly mass with a precision balance. This process was repeated during a period of 20 days.
The evaluation of the models, for their ability to estimate the volumetric water content, from Ka data obtained with TDR has been made based on the coefficient of determination (R2) by linear adjustment. The probes were standardized through Shewhart statistical quality control for individual measurements by Minitab software (MONTGOMERY, 2004), which considers the average, standard deviation and median sample, and the center line reflects the level of process operation. We considered the Equation 3 as the upper control limit (LSC), and the Equation 4 as the lower control limit (LIC), defining the limits of the variable. These values were set at three standard deviations (JUSTI et al., 2010).
N
3
X
LSC
N
3
X
LIC
(3)
(4) In which:
X - Test averages;
Rosimaldo Soncela, Silvio C. Sampaio, Marcio A. Vilas Boas, Maria H. F. Tavares, Adriana Smanhotto 924
RESULTS AND DISCUSSION
Table 2 shows the average value of Ka readings for each probe immersed in water. TABLE 2.Values of apparent dielectric constant (Ka) for each probe.
Probe Ka Probe Ka Probe Ka Probe Ka Probe 02 74.7 Probe 31 75.3 Probe 54 76.8 Probe 77 73.0 Probe 03 74.2 Probe 32 71.7 Probe 55 78.0 Probe 78 75.8 Probe 05 76.5 Probe 34 73.4 Probe 56 75.7 Probe 79 77.5 Probe 06 76.7 Probe 35 78.0 Probe 57 74.3 Probe 80 75.8 Probe 08 75.5 Probe 36 73.8 Probe 58 75.5 Probe 81 74.2 Probe 09 76.0 Probe 38 78.2 Probe 59 76.0 Probe 87 74.2 Probe 12 76.2 Probe 39 77.7 Probe 60 72.4 Probe 88 74.1 Probe 13 77.1 Probe 40 75.8 Probe 61 78.2 Probe 89 73.6 Probe 14 73.4 Probe 41 77.7 Probe 63 72.4 Probe 90 73.6 Probe 17 72.0 Probe 42 77.7 Probe 64 74.0 Probe 91 75.5 Probe 19 77.5 Probe 43 75.6 Probe 65 72.3 Probe 92 78.7 Probe 20 76.9 Probe 44 70.9 Probe 66 76.4 Probe 93 76.7 Probe 21 75.9 Probe 45 76.1 Probe 69 79.7 Probe 94 75.2 Probe 22 73.6 Probe 46 76.2 Probe 70 76.2 Probe 95 78.4 Probe 23 74.9 Probe 47 76.2 Probe 71 73.0 Probe 96 75.5 Probe 24 75.3 Probe 48 78.6 Probe 72 76.0 Probe 4 75.7 Probe 25 74.6 Probe 50 78.6 Probe 73 77.3 Probe 10 74.5 Probe 26 73.1 Probe 51 76.8 Probe 74 76.2 Probe 11 77.0 Probe 28 75.2 Probe 52 77.9 Probe 75 75.7 Probe 16 77.7 Probe 29 73.6 Probe 53 77.8 Probe 76 77.3 Probe 49 75.2
Average 75.6
Coefficient of Variation (%) 2.49
Standard Deviation 1.88
It is observed in Table 2 that the coefficient of variation of Ka in water to the constructed probes was low, since the result was below 10%, representing homogeneous data (GOMES, 2000). The data observed in this study corroborate the data verified by VILLWOCK et al. (2004), who obtained a mean value of Ka equal to 74.5 and coefficient of variation of 2.61%, in handmade probes.
Through the values of the coefficients a (linear) and b (angular), obtained from the linear regression for each probe, it was performed the standardization with the help of Minitab software. Figures 5 and 6 show the graphs of Shewhart statistical quality control for individual measurements, obtained by linear a and angular b coefficients of equations of each probe constructed.
FIGURE 5.Graphic of quality control on the linear coefficient of the equations.
C
oef
ficien
t “
a”
Observation
LIC = 1.274
X = 1.095 LSC = 0.916
1.8
1.5
1.2
0.9
0.6
FIGURE 6.Graphic of quality control on the angular coefficient of the equations.
TABLE 3. Adjusted models for determination of volumetric water content vof each column and data from all columns and their respective coefficients of determination ( 2
R )
Column Model 2
R
01 0,0103Ka0,1825
v
0.970
02 0,0105Ka0,1919
v
0.956
03 0,0104Ka0,2029
v
0.946
04 0,0127Ka0,1202
v
0.732
05 0,0103Ka0,2021
v
0.946
06 0,0102Ka0,1825
v
0.940
07 0,0103Ka0,1825
v
0.927
08 0,0094Ka0,2124
v
0.936
09 0,0105Ka0,2060
v
0.957
10 0,0110Ka0,1692
v
0.963
11 0,0105Ka0,1980
v
0.930
12 0,0112Ka0,1652
v
0.967
13 0,0112Ka0,1667
v
0.943
15 0,0107Ka0,1861
v
0.930
16 0,0106Ka0,2030
v
0.923
17 0,0103Ka0,1941
v
0.932
All 0,0103Ka0,1900
v
0.930
It appears from Figure 5 that the values of the observations 16, 17, 18, 19, 20 and 76, relative to the probes 24, 25, 26, 28, 29 and 04, respectively, were above the upper control limit (LSC) therefore the process is considered as unstable, uncontrolled or unpredictable. Thus, they were despised for this experiment, as well as for the observation 31 regarding the probe 48, which was beyond the Lower Control Limit (LIC). In Figure 6, we note that the observations 16, 17, 19 and 20, relative to the probes 24, 25, 28, 29, respectively, were beyond the LIC. It may be noted that the other observations were randomly distributed over the lower and upper limits, indicating that the process is stable, predictable, finding themselves, in this way, within the quality control allowed for individual graphs. This result demonstrates the reliability methodology presented by SOUZA et al.
C oef ficien t “ b ” Observation
LSC = 22.93
X = 17.86
Rosimaldo Soncela, Silvio C. Sampaio, Marcio A. Vilas Boas, Maria H. F. Tavares, Adriana Smanhotto 926
(2006) for the construction of TDR probes to replace the commercial probes, especially in situations where one needs a large number of probes. Table 3 presents the adjusted models with the data obtained in each column using linear regression.
It may be seen, from Table 3, the angular and linear coefficient, and the model found was significant with high reliability value. The coefficients of determination obtained were good, ranging from R2 = 0.923 to R2 = 0.970, with the exception of the column 04, which obtained R2 = 0.732, and this value is related to the construction of the discarded probes 24, 25, 26, 28 and 29. These results prove that there is a linear relation between Ka and volumetric water content of soil, demonstrating therefore that it is possible to use the coefficient of the handmade probes for determining the volumetric water content of the soil. Similar values were verified by SANTORO et al. (2009); VILLWOCK et al. (2004); TOMMASELLI and BACCHI (2001); and SILVA and GERVÁSIO (1999).
Table 4 presents the analysis of variance for the adjusted model to the Ka grouped data and volumetric water content for all columns.
TABLE 4. Analysis of variance of adjusted model for correlation between apparent dielectric constant and volumetric water content.
Source of
variation Degrees of freedom Square sum Mean Square F Statistic p-value Regression 1 15.323 15.323 19598.81 0.000*
Residue 1648 1.288 1.288 Total 1649 16.612
* significant at 5%.
It can be seen, from Table 4, that p-value < 0.05 at the 5% level of significance for regression. Therefore, at least one of the explanatory variables affected the response variable. Table 5 presents the test of significance of the variables in the adjusted model for all columns.
TABLE 5. Test of significance of the adjusted linear model between apparent dielectric constant and volumetric water content for all columns.
Estimators Coefficient deviation Standard t0 Statistic p-value Decision
Linear 0.190 0.0016 115.53 0.000 * Angular 0.0103 0.00007 140.00 0.000 *
It is observed, from Table 5, that the coefficients were significant at the 5% level; therefore, this model of calibration is accepted for probes under study for Distroferric RED LATOSOL.
CONCLUSIONS
• The probes made with national material were presented as a viable alternative for obtaining soil water content.
• The adjusted calibration model for the Distroferric Red Latosol was the linear v = 0.0103 Ka + 0.1900, with a coefficient of determination R2 = 0.93.
ACKNOWLEDGEMENT
REFERENCES
CICHOTA, R. Avaliação do campo de um TDR segmentado para determinação de umidade no solo. 2003. 121 f. Dissertação (Mestrado em Agronomia) – Universidade de São Paulo, Escola Superior de Agricultura Luiz de Queiroz, Piracicaba, 2003.
COELHO, E. F.; VELLAME, L. M.; COELHO FILHO, M. A. Sonda de TDR para estimativa da umidade e condutividade elétrica do solo, com uso de multiplexadores. Revista brasileira de engenharia agrícola e ambiental,Campina Grande, v. 9, n. 4, p. 475-480, 2005.
COELHO, E. F.; VELLAME, L. M.; COELHO FILHO, M. A; LEDO, C. A. S. Desempenho de modelos de calibração de guias de onda acopladas a TDR e a multiplexadores em três tipos de solos. Revista brasileira de ciência do solo,Viçosa-MG, v. 30, p. 23-30, 2006.
EMBRAPA. Empresa Brasileira de Pesquisa Agropecuária. Sistema Brasileiro de Classificação de solos. 2. Ed. Rio de Janeiro, 2006, 306 p.
EMBRAPA. Empresa Brasileira de Pesquisa Agropecuária. Manual de métodos de análises de solo. 2.ed. Rio de Janeiro, 1997. 212p
GOMES, F. P. Curso de estatística experimental. 14. ed. Piracicaba: Degaspari, 2000. 477 p. GONÇALVES, A. C. A.; TRINTINALHA, M. A.; TORMENA, C. A.; FOLEGATTI, M. V. Influência da densidade do solo na estimativa do conteúdo de água de um Nitossolo Vermelho distroférrico por meio da técnica da TDR. Revista brasileira de ciência do solo,Viçosa-MG, v. 35, p. 1551-1559, 2011.
JUSTI, A. L.; VILAS BOAS, M. A.; SAMPAIO, S. C.Índice de capacidade do processo na
avaliação da irrigação por aspersão. Engenharia Agrícola, Jaboticabal, v. 30, n. 2, p.264-270, 2010. MONTGOMERY, D. Introdução ao Controle Estatístico da Qualidade. 4. ed. Rio de Janeiro: LTC, 2004.
NOBORIO, K. Measurement of soil mater content and electrical conductivity by time domain reflectometry: a review. Computers and Electronics in Agriculture, New York, n. 31, p. 213 – 237, 2001.
QUEIROZ, S.O. P.; TESTEZLAF, R.; MATSURA, E. E. Avaliação de equipamentos para determinação da condutividade elétrica do solo. Revista Irriga, Botucatu, v. 10, n. 3, p. 279-287, agosto-outubro, 2005.
SANTORO, B. L.; SATO, L. M.; LOPES, L. N.; SOUZA, C. F. Construção e validação de sondas de tdr para o monitoramento ambiental. In: CONGRESSO BRASILEIRO DE ENGENHARIA AGRÍCOLA, 38., Juazeiro; Petrolina. 2009. Anais... CD-ROM.
SILVA, E. L. da; GERVÁSIO, E. S. Uso do instrumento TDR para determinação do teor de água em diferentes camadas de um latossolo roxo distrófico. Revista brasileira de engenharia agrícola e ambiental, Campina Grande, v. 3, n. 3, p. 417-420, 1999.
SOUZA, C. F.; FOLEGATTI, M. V.; MATSURA, E. E.; OR, D. Calibração da reflectometria no domínio do tempo (TDR) para a estimativa da concentração da solução no solo. Engenharia Agrícola, Jaboticabal, v. 26, n. 1, p.282-291, jan./abr. 2006.
SOUZA, C. F.; OR, D.; MATSURA, E.E. A variable-volume TDR probe for measuring water content in large soil volumes. Soil Science Society of America Journal, Medison, v. 68, p. 25-31, 2004.
Rosimaldo Soncela, Silvio C. Sampaio, Marcio A. Vilas Boas, Maria H. F. Tavares, Adriana Smanhotto 928
TOMMASELLI, J. T. G.; BACCHI, O. O. S. Calibração de um equipamento de TDR para medida de umidade de solos. Pesquisa Agropecuária Brasileira, Brasília, v. 36, n. 9, p.1145-1154, set., 2001.
TOPP, G. C.; DAVIS, J.L.; ANNAN, A. P. Electromagnetic determination of soil water content: measurements in coaxial transmission lines. Water Resources Research, Washington, v. 16, p.574-582, 1980.
TRINTINALHA, M. A.; GONÇALVES, A. C. A.; TORMENA, C. A.; COSTA, A. C. S.;
FOLEGATTI, M. V.; FREITAS, P. S. L; REZENDE, R. Comparação dos sistemas TDR e ECHO para medida de umidade em um solo argiloso e em areia. Acta Scientiarum, Maringá, v. 26, n. 3, p. 353-360, 2004.