SAMPLING AND TDR PROBE INSERTION IN THE
DETERMINATION OF THE VOLUMETRIC
SOIL WATER CONTENT
(1)W. G. TEIXEIRA(2), G. SCHROTH(3), J. D. MARQUES(4) & BERND HUWE(5)
SUMMARY
Volumetric soil water content (θθθθθ) can be evaluated in the field by direct or
indirect methods. Among the direct, the gravimetric method is regarded as highly reliable and thus often preferred. Its main disadvantages are that sampling and laboratory procedures are labor intensive, and that the method is destructive, which makes resampling of a same point impossible. Recently, the time domain reflectometry (TDR) technique has become a widely used indirect,
non-destructive method to evaluate θθθθθ. In this study, evaluations of the apparent
dielectric number of soils (εεεεε) and samplings for the gravimetrical determination
of the volumetric soil water content (θθθθθGrav) were carried out at four sites of a
Xanthic Ferralsol in Manaus – Brazil. With the obtained εεεεε values, θθθθθ was estimated
using empirical equations (θθθθθTDR), and compared with θθθθθGrav derived from disturbed
and undisturbed samples. The main objective of this study was the comparison of θθθθθTDR estimates of horizontally as well as vertically inserted probes with the θθθθθGrav values determined by disturbed and undisturbed samples. Results showed
that θθθθθTDR estimates of vertically inserted probes and the average of horizontally
measured layers were only slightly and insignificantly different. However,
significant differences were found between the θθθθθTDR estimates of different
equations and between disturbed and undisturbed samples in the θθθθθGrav
determinations. The use of the theoretical Knight et al. model, which permits an evaluation of the soil volume assessed by TDR probes, is also discussed. It
was concluded that the TDR technique, when properly calibrated, permits in
situ, nondestructive measurements of θθθθθ in Xanthic Ferralsols of similar accuracy
as the gravimetric method.
Index terms: Amazon, Oxisols, time domain reflectometry, dieletric properties.
(1) Recebido para publicação em junho de 2000 e aprovado em maio de 2003.
(2) Pesquisador da Embrapa Amazônia Ocidental. Rod. AM – 010 – Km 29. Caixa Postal 319. CEP 69011-970. Manaus (AM). E-mail: [email protected]
(3) Pesquisador do Projeto de Fragmentos Florestais do Instituto Nacional de Pesquisas da Amazônia (INPA) Caixa Postal 478, CEP 69011-970 Manaus (AM). E-mail: [email protected]
(4) Professor da Universidade Estadual do Amazonas – UEA. CEP 69050-010 Manaus (AM). E-mail: [email protected] (5) Professor da Universidade de Bayreuth, Bodenphysik Abteilung, D-95440 Bayreuth, Alemanha. E-mail: [email protected]
RESUMO: PROCEDIMENTOS DE AMOSTRAGEM E DO MODO DE INSERÇÃO NO SOLO DE SONDAS TDR NA DETERMINAÇÃO DA UMIDADE VOLUMÉTRICA DO SOLO
A umidade volumétrica do solo (θ) no campo pode ser avaliada por métodos diretos e indiretos. Dentre os métodos diretos, o gravimétrico é considerado altamente confiável e, conseqüentemente, preferido. As principais desvantagens deste método são: a grande demanda de trabalho para a amostragem do solo e os procedimentos posteriores no laboratório, uma vez que, por ser um método destrutivo, não permite reamostrar o mesmo local posteriormente. Ultimamente, a técnica da reflectometria no domínio do tempo (TDR) vem sendo amplamente usada como um método indireto não-destrutivo para avaliação de
θ. Neste estudo, avaliações do número dielétrico aparente do solo (ε) e amostragens para determinação gravimétrica da umidade do solo (θGrav) foram realizadas em quatro locais
em um Latossolo Amarelo em Manaus – Brasil. Com os valores de ε obtidos foi estimada, por meio de equações de calibração, a umidade volumétrica do solo pela técnica do TDR (θTDR), e então comparadas com as θGrav oriundas de amostras indeformadas e deformadas.
Este estudo objetivou comparar valores de θGrav determinados com amostras deformadas e
indeformadas com os valores de θTDR estimados tanto com a sonda introduzida
horizontalmente quanto verticalmente no solo. Resultados comprovaram a ausência de diferenças significativas entre a estimativa de θTDR, quando a sonda foi colocada
verticalmente no solo, e a média aritmética das camadas avaliadas pela sonda introduzida horizontalmente. Foram encontradas diferenças significativas nas determinações gravimétricas entre amostras indeformadas e deformadas. O uso do modelo de Knight et al. para avaliação do volume de solo pela técnica TDR foi também discutido. A técnica TDR, quando apropriadamente calibrada, permitiu a determinação de θ, in situ, em Latossolo Amarelo textura argilosa, com resultados similares aos do método gravimétrico.
Termos de indexação: Amazonas, Latossolo Amarelo, reflectometria no domínio do tempo, propriedades dielétricas.
INTRODUCTION
The benefits of soil water monitoring in understanding processes such as diffusion and mass flux in nutrient transport to plant roots, as well as the need to parameterize and to validate applied models of water fluxes, justify the time and effort needed to implement a soil water measurement component in some research programs.
Volumetric soil water content (θ) in the field can be evaluated through direct or indirect methods. Among the direct procedures, the gravimetric method is regarded as highly reliable and is therefore often preferred. The gravimetric method is a ratio determination that involves the weighing of collected soil samples before and after drying. Whereas the principle of the method is simple and direct, both the sampling and laboratory procedures are labor intensive. Furthermore, the gravimetric method is destructive, which makes it impossible to resample the same point or to automate data acquisition. The gravimetric determination of soil water content can be carried out on disturbed material. Disturbed samples are usually taken with a soil auger, and undisturbed samples are typically collected with steel cylinders of known volume.
In recent years, Time Domain Reflectometry (TDR) technique has become a widely used
non-destructive method to evaluate θ. It is based on the determination of the dielectric number of the soil (ε) by estimating the propagation velocity of electromagnetic waves (Topp et al., 1980). Its main disadvantages are the need for specific calibrations for some soil classes and the high cost of the equipment. Spatial variability of θ in the centimeter scale may provide information that allows a better understanding of the deviations between values determined by different methods of θ evaluation. Knowledge of the spatial variability of θ in the field is an essential factor for the choice of proper methods and procedures to either measure directly or to calibrate indirect methods for a reliable evaluation of θ.
The objectives of this study were to investigate: (1) the effect of the insertion mode of the TDR probe near the soil surface and in the subsoil on θTDR estimations; (2) the influence of the use of disturbed or undisturbed soil samples on the determination of
θGrav. In addition, the direct measurements of θGrav
and indirect estimates of θTDR were compared.
MATERIAL AND METHODS
Station of Embrapa - Amazonia Ocidental, in Manaus, Brazil. The soil is classified as a Xanthic Ferralsol (FAO, 1990) or Latossolo Amarelo, according to the Brazilian classification (EMBRAPA, 1998).
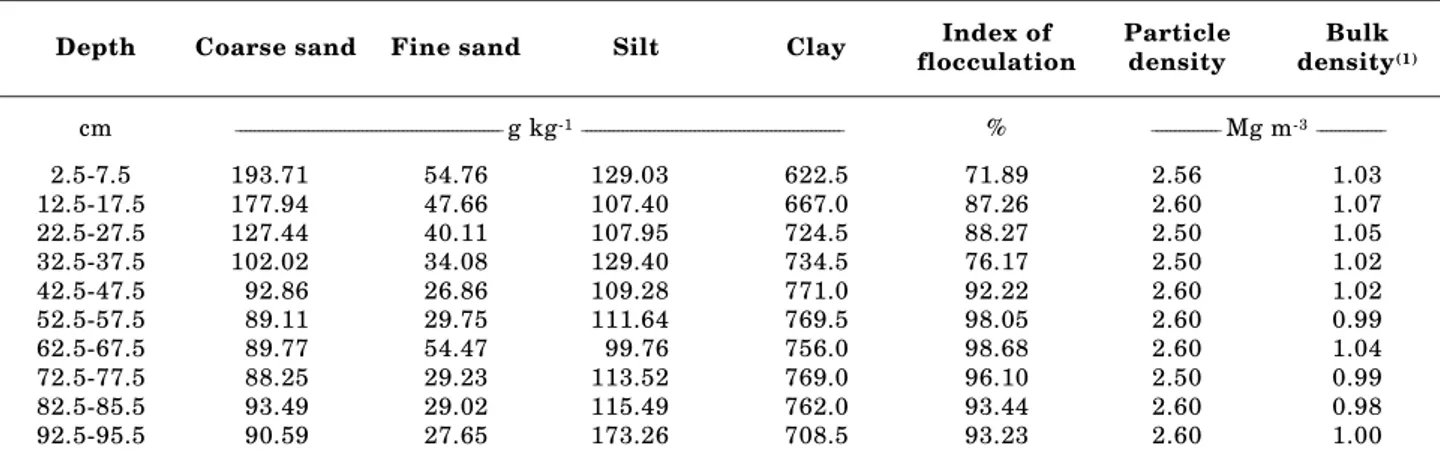
Ferralsols have a wide distribution in the Amazon Basin (Vieira & Santos, 1987). They are normally well drained despite their high clay content, and the clay fraction is dominated by kaolinite (Camargo & Rodrigues, 1979). Some physical and hydraulic soil characteristics evaluated according to the methods described in EMBRAPA (1997) are shown in table 1. Two sites were measured to characterize the soil surface and are identified as site number 1 and 2 in table 2. At these sites, three undisturbed and three disturbed soil samples were taken at two depths, 0-5 and 5-10 cm. Sites 3 and 4 (Table 2) were measured to characterize the subsurface soil. Disturbed soil samples were extracted at depths of 25-30 and 30-35 cm, while undisturbed soil samples were collected only at a depth of 27-32 cm.
Before sampling the soil, ε was previously registered at six points of each depth, where the probe was inserted vertically and horizontally (means of two records for both horizontal and vertical measurements). Immediately after the evaluation of ε, three steel cylinders for each depth were driven vertically into the soil so that their geometric center coincided with the point at which the TDR probe had been inserted. Then the disturbed soil samples were collected and transported to the laboratory.
Determinations of ε were carried out with a commercial device (Easy Test® Dublin - Poland) with two transmission lines of 10 cm length, a diameter (∅) of 2 mm and a distance of 16 mm between lines. The steel cylinders used to collect undisturbed soil samples were 5 cm high with a volume of 100 cm3. Disturbed soil samples were collected with a small
soil auger (∅≈ 5 cm) which was inserted at 10 cm depth, parallel to the soil surface into the remaining space among the cylinders. The soil samples were weighed and oven-dried at 105 °C for 48 h for the determination of bulk density (ρ) and θGrav.
With the obtained e values, θTDR was estimated using the empirical equation proposed by Topp et al. (1980),
θTDR = -5.3 x 10⁻² + 2.92 x 10⁻² ε -5.5 x 10⁻⁴ ε2 + 4.3 x 10⁻⁶ε3
by Malicki et al. (1996),
and Teixeira et al. (1997).
θTDR = 4.64 x 10⁻² + 2.04 x 10⁻²ε - 1.68 x 10⁻⁴ ε2 A crucial question of comparing methods for the θ determination is related to the soil volume assessed by the different techniques. The estimation of the evaluated soil volume is direct and easy with the gravimetric method. In this study, steel cylinders of 100 cm3 were used to collect undisturbed, and a soil auger that holds ≈ 200 cm3 to collect disturbed samples. The latter were homogenized and resampled in the laboratory, where θ was determined in a sample of ≈ 100 cm3.
The sensitivity region of the TDR probes used in this study is hypothesized to resemble a cylinder that surrounds the transmission lines, concentrating the sensitivity in an area of ∅ ≈ 5 cm with a length of ≈ 11 cm (Figure 1). If this is true, the measured soil volumes are approximately similar and allow the comparison between methods and procedures.
ρ +
ρ − ρ − − ε = θ
180 . 1 170 . 7
59 . 0 68 . 0 819 .
0 2
TDR
(1) For each depth the value is a mean of five samples.
Table 1. Particle size distribution, index of flocculation, particle density and bulk density evaluated to 100 cm depth in a profile on a Xanthic Ferralsol in Manaus, Brazil
Depth Coarse sand Fine sand Silt Clay flocculationIndex of Particledensity densityBulk(1)
cm ___________________________________________________________ g kg-1__________________________________________________________ % _______________ Mg m-3_______________
A theoretical model to estimate the volume measured by TDR probes was presented by Knight et al. (1995). It was rearranged with the program Maple V (Waterloo Maple Inc., New York) in function of the height of energy influence, or the “radius of the measured volume”, h – [m] which can be estimated using the equation below
where, b [m] is the rod diameter, d [m] the distance between the rods, and P [adimensional –0 ≤ P ≤ 1] is the relative proportion of energy accumulated at height (h) around the probe axis. Theoretical calculations about the assessed soil volume were carried out and compared with true measurements. Analyses of variance and Tukey’s tests, with equal and unequal sample sizes (Steel et al., 1997) were performed to compare the means of each depth to the values of θGrav determined with disturbed and undisturbed samples. θTDR estimations with
= h 1 2 − e
−4P +
ln + d
b −
d2 b2 1 4
ln + d
b −
d2
b2 1
1 (d2 − b2)
− e
−4P +
ln + d
b −
d2 b2 1 4
ln + d
b −
d2
b2 1
1
Figure 1. Geometric characteristics and soil volume assumed to be evaluated by Easy Test probes (Adapted from Easy Test, with permission).
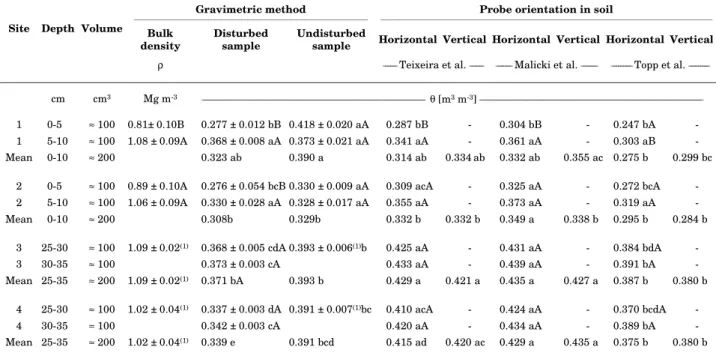
Table 2. Volumetric soil moisture assessed gravimetrically [θθθθθGRAV] with two sample procedures (disturbed
and undisturbed samples) and volumetric soil moisture estimated with TDR probes oriented vertically and horizontally at four sites on a Xanthic Ferralsol in Manaus, Brazil
Time Domain Reflectometry (TDR)
Gravimetric method Probe orientation in soil
Bulk
density Disturbedsample Undisturbedsample Horizontal Vertical Horizontal Vertical Horizontal Vertical Site Depth Volume
ρ ______ Teixeira et al. ______ _______ Malicki et al. _______ _________ Topp et al. _________
cm cm3 Mg m-3 ___________________________________________________________________________________________________ θ [m3 m-3] ___________________________________________________________________________________________________
1 0-5 ≈ 100 0.81± 0.10B 0.277 ± 0.012 bB 0.418 ± 0.020 aA 0.287 bB - 0.304 bB - 0.247 bA
-1 5-10 ≈ 100 1.08 ± 0.09A 0.368 ± 0.008 aA 0.373 ± 0.021 aA 0.341 aA - 0.361 aA - 0.303 aB
-Mean 0-10 ≈ 200 0.323 ab 0.390 a 0.314 ab 0.334ab 0.332 ab 0.355 ac 0.275 b 0.299 bc
2 0-5 ≈ 100 0.89 ± 0.10A 0.276 ± 0.054 bcB 0.330 ± 0.009 aA 0.309 acA - 0.325 aA - 0.272 bcA
-2 5-10 ≈ 100 1.06 ± 0.09A 0.330 ± 0.028 aA 0.328 ± 0.017 aA 0.355 aA - 0.373 aA - 0.319 aA
-Mean 0-10 ≈ 200 0.308b 0.329b 0.332 b 0.332 b 0.349 a 0.338 b 0.295 b 0.284 b
3 25-30 ≈ 100 1.09 ± 0.02(1) 0.368 ± 0.005 cdA 0.393 ± 0.006(1)b 0.425 aA - 0.431 aA - 0.384 bdA
-3 30-35 ≈ 100 0.373 ± 0.003 cA 0.433 aA - 0.439 aA - 0.391 bA
-Mean 25-35 ≈ 200 1.09 ± 0.02(1) 0.371 bA 0.393 b 0.429 a 0.421 a 0.435 a 0.427 a 0.387 b 0.380 b
4 25-30 ≈ 100 1.02 ± 0.04(1) 0.337 ± 0.003 dA 0.391 ± 0.007(1)bc 0.410 acA - 0.424 aA - 0.370 bcdA
-4 30-35 ≈ 100 0.342 ± 0.003 cA 0.420 aA - 0.434 aA - 0.389 bA
-Mean 25-35 ≈ 200 1.02 ± 0.04(1) 0.339 e 0.391 bcd 0.415 ad 0.420 ac 0.429 a 0.435 a 0.375 b 0.380 b
(1) One sample for both depths collected between 27.5 and 32.5 cm.
horizontal insertion of rods and estimates using different calibration equations were also compared. Furthermore, a comparison between the means of θGrav (averaging the two measured depths) and θTDR with the horizontally and vertically inserted probe was drawn.
RESULTS AND DISCUSSION
Probe orientation and soil volume evaluated by TDR
No statistically significant difference was observed between θTDR results obtained with probes inserted vertically and horizontally using the calibration equations of Topp et al. (1980), Malicki et al. (1996) and Teixeira et al. (1997) (Table 2). However, significant differences between equation results were found; they are discussed below. Similar results expressing the effect of the orientation of TDR probes on ε estimates were found by Topp & Davis (1985) and Zegellin et al. (1992). However, different results may be established when using larger transmission rods due to the greater evaluated volume, which is more susceptible to the effect of the spatial gradient of θ, especially when installed vertically. Horizontal installation of transmission rods may reduce the effect of the vertical gradients of θ, but this type of installation requires excavation and, consequently, gives rise to a disturbance of the natural soil structure.
Empirical investigations (Baker & Lascano, 1989; Zegelin et al., 1992) and theoretical considerations (Knight, 1992; Ferré et al., 1996) agree that a sensitivity perpendicular to the TDR probes decreases exponentially with the distance from the transmission line elements. Furthermore, the volume evaluated by the propagation of the electromagnetic waves from TDR probes presents a quasi-elliptical form around the transmission with two rods, but a limited sensitivity extends much farther (Baker & Lascano, 1989; Zegelin et al., 1989; Knight et al., 1992; 1995). The radii of measured soil volume around the TDR rods were calculated for the probes used in this study by Knight’s model. The calculated radii (h) were 0.009, 0.023, and 0.13 m for a total energy proportion (P) of 0.95, 0.99, and 0.999, respectively. The singular behavior of h in function of P is illustrated in figure 2, which shows the enormous enhance of the radius sampled by TDR probes with a centesimal enhance of P. The theoretical value calculated with P = 0.99 agrees to the assumption of the “radius of the measured soil cylinder” by the TDR probes used in this study (Figure 1). There was also a large degree of agreement between results obtained from experiments conducted by Petersen et al. (1995) and Weitz et al. (1997) and theoretical values obtained by Knight et al.’s model to estimate the soil volume by the TDR technique.
To calibrate the TDR for a specific soil, the estimation of h is especially important to ensure that the soil volume collected with the cylinders to determine θGrav is comparable with the volume assessed by the TDR probes. An estimation of h may also be important to determine the minimum depth for installing probes horizontally near the surface.
There are practically no differences within sites among the θTDR estimates of soil sampled every 5 cm or the average of twice this volume using a specific calibration equation, as shown in table 2 (i.e., the vertical means are statistically equal to horizontal means within a specific calibration equation). These results show that the volumetric samples collected in an intermediate position (e.g. between 2.5-7.5 cm) may be used in most calibration studies and compared with TDR estimates from rods installed vertically at 0-10 cm.
Disturbed and undisturbed samples to evaluate θθθθθ gravimetrically
In field evaluations, it is normally difficult to control the small-scale spatial variation of θ when collecting samples to calibrate methods. However, field calibrations can be more representative of reality, especially if the objective is to calibrate data collected in field conditions. The reliability of the accuracy of values in most TDR calibrations is doubtful for the use in field evaluations of θ. Such calibrations were carried out with soil samples that had been dried, sieved, and repacked to a desired ρ in the laboratory. These procedures sometimes affect the soil structure dramatically, and this may have a high influence on ε determinations, particularly in clayey and structured soils like Ferralsols.
Figure 2. Relation between the relative
accumulated energy [P] and the radius [h] of an imaginary cylinder circunferenced around the TDR sensor-rod . Calculation by the model proposed by Knigth et al., 1995 with b = 0.002 m (rod diameter) and the spacing between the two rods d = 0.016 mm.
P [adimensional]
0,86 0,88 0,90 0,92 0,94 0,96 0,98
h [
m
]
Divergences between the direct (gravimetric) and indirect (TDR) methods are shown in table 2. They are probably related to the fact that the mass-based θ values of disturbed samples were recalculated to volume-based values using ρ values, thus introducing a new source of error. The trend of underestimating θ in disturbed samples relative to undisturbed samples (Table 2) may be a consequence of the inevitable soil compaction when the cylinders are inserted into the soil. This occurs especially in the top layers (0-5 cm), where the high concentration of roots and organic matter increases the disturbance during soil sampling and leads to an overestimation of ρ. This explanation is confirmed by the reduced difference between values of disturbed and undisturbed samples and the small standard deviation of ρ in subsurface sites, where the soil is easily sampled with reduced compaction.
Soil characteristics
A higher homogeneity in the subsoil sampling sites (3 and 4 in Table 2) is shown by reduced standard deviations in ρ values (Table 2). It is related to the fact that the variability of the underlying soil physical properties decreases considerably with increasing depth due to the reduced biological activity. Furthermore, the higher contents of organic matter normally found in the superficial layers covered by forest may cause an underestimation of ε as reported by Topp et al. (1980) and Herkelrath et al. (1991). Moreover, greater ρ values in the subsoil sites (3 and 4 in Table 2) may have also influenced ε determinations. Roth et al. (1990), Roth et al. (1992), Dirksen & Dasberg (1993) and Malicki et al. (1996) also showed significant effects of ρ on ε determination. Therefore, the equation of Malicki takes ρ values into account to estimate θTDR.
The presence of air gaps may cause discontinuities in the propagation of electromagnetic waves and thus considerably increase estimation errors (Knight, 1992; Ferré et al., 1996). This is probably one explanation for the greater deviation in the evaluations of θTDR (Table 2) at the surface, where macropores are frequently found, caused by dead roots and macrofauna activity. Smaller deviations for ε measurements in the subsoil may also be related to a better contact of the transmission lines with the soil matrix. Moreover, the higher amount of θ in subsoil sites (3 and 4 in Table 2) contributes to reduce the variability because of the greater contribution of water to the dielectric number (≈ 81) compared to other soil constituents (air ≈ 1 and the mineral constituents of soil ≈ 3) (Roth et al., 1990).
Accuracy of empirical equations for the determination of θθθθθ
Some significant differences between the empirical equations under study are shown in
Table 2. As a general tendency, results show that the estimates of θTDR from the equation proposed by Teixeira et al. (1997) is statistically equal to results obtained by Malicki’s equation, and both results are higher than those derived from Topp’s equation. Although Topp’s equation has been used successfully by many researchers in soils of temperate climate, it is unsuitable for many tropical soils (Tommasseli & Bachi, 2001; Dirksen & Dasberg, 1993). The θTDR estimated by Topp's equation underestimated the mean θGrav values of undisturbed soil samples (Table 2) in these studies. Similar results in tropical soils were found for clayey soils by Weitz et al. (1997) and Dasberg & Hopmans (1992). This underestimation is probably related to the anomalous behavior of the dielectric properties of water bound in colloidal particles (clay and organic matter) which induces a different dielectric behavior of such water molecules from those of free water (Bohl & Roth, 1994).
The empirical equation of Teixeira et al. (1997) was developed for a specific use on clayey Ferralsols, and probably yields reasonable results in soils with similar characteristics. However, the number of samples and range of wetness in this study were not large enough to permit a detailed discussion about the suitability of the calibration equations, therefore they are not discussed further and will be presented in following papers.
The uncertainties in θ determinations (Table 2) were a consequence of their natural variability. The deviation range found in this investigation is similar to values found for other studies. The accuracy of θTDR estimations found by Topp et al. (1980) was 0.01 m m-3. Herkelrath et al. (1991) found values of about 0.02 m m-3, Bohl & Roth (1994) 0.02 to 0.03 m m-3 for mineral soils and 0.03 to 0.07 m m-3 for organic soils, Jacobsen & Schjønning (1995) found a precision in the range from 0.01 to 0.18 m m-3, and Weitz et al. (1997) in the range from 0.02 to 0.52 m m-3.
CONCLUSIONS
1. The mode of insertion of the TDR probes used in this study did not have a significant effect on θ estimates.
2. Significant differences were found between disturbed and undisturbed samples in gravimetric determinations.
3. The TDR technique, when properly calibrated, permits nondestructive in situ measurements of θ in Xanthic Ferralsols with a similar accuracy of results as the gravimetric method.
ACKNOWLEDGEMENTS
This project was supported, in part, by grants from Embrapa – Amazônia Ocidental and the SHIFT program (Studies of Human Impact on Forest and Floodplains in the Tropics) project ENV 45. We gratefully acknowledge Estevão Santos for performing physical determinations in the laboratory and O.P. Faccin for the assistance in field data collection.
LITERATURE CITED
BAKER, J.M. & LASCANO, R.J. The spatial sensitivity of time-domain reflectometry. Soil Sci., 147:378-384, 1989. BOHL, H. & ROTH, K. Evaluation of dielectric mixing models
to describe the θ(ε)-relations. In: TIME DOMAIN REFLECTOMETRY IN ENVIRONMENTAL, INFRAS-TRUCTURE, AND MINING APPLICATIONS, Evanston, 1994. Evanston, North Western University, 1994. p.309-319. (Special publication SP, 19-94)
CAMARGO, M.N. & RODRIGUES, T.E. Guia de Excursão do XVII Congresso Brasileiro de Ciência do Solo. Manaus, Embrapa - CPAA, 1979. 72p.
DASBERG, S. & HOPMANS, J.W. Time domain reflectometry calibration for uniformly and nonuniformly wetted and clayey loam soils. Soil Sci. Soc. Am. J., 56:1341-1345, 1992. DIRKSEN, C. & DASBERG, S. Improved calibration of time domain reflectometry soil water content measurements. Soil Sci. Soc. Am. J., 57:660-667, 1993.
EMPRESA BRASILEIRA DE PESQUISA AGROPECUÁRIA -EMBRAPA. Manual de métodos de análise de solo. 2.ed. Rio de Janeiro, 1997. 212p.
EMPRESA BRASILEIRA DE PESQUISA AGROPECUÁRIA -EMBRAPA. Sistema brasileiro de classificação de solos. Rio de Janeiro.1998. 412p.
FAO. Soil Map of the world – Revised legend. Rome, 1990. 119p. FERRÉ, P.A.; RUDOLPH, D.L. & KACHANOSKI, R.G. Spatial averaging of water content by time domain reflectometry: Implications for twin rod probes with and without dielectric coatings. Water Res. Res., 32:271-279, 1996.
GARDNER, W.H. Water content.In: KLUTE, A., ed. Methods of soil analysis, Part 1: Physical and mineralogical methods, 2.ed. Madison, American Society of Agronomy and Soil Science Society of America, 1986. p.479-492.
HERKELRATH, W.N.; HAMBURG, S.P. & MURPHY, F. Automatic, real-time monitoring of soil moisture in a remote field area with time domain reflectometry. Water Res. Res., 27:857-864, 1991.
JACOBSEN, O.H. & SCHJØNNING, P. Comparsion of TDR calibration functions for soil water determination. In: PETERSEN, L.W. & JACOBSEN, O.H., eds. Time-domain reflectometry – Applications in soil science, Lyngby, 1994. Lyngby, Danish Institute of Plant and Soil Science, 1995. p.25-34. (Report, 11)
KNIGHT, J.H. Sensitivity of time domain reflectometry measurements to lateral variations in soil water content. Water Res. Res., 28:2345-2352, 1992.
KNIGHT, J.H.; WHITE, I. & ZEGELIN, S.J. Sampling volume of TDR probes used for water content monitoring. In: PETERSEN, L.W. & JACOBSEN, O.H., eds. Time-domain reflectometry – Applications in soil science, Lyngby, 1994. Lyngby, Danish Institute of Plant and Soil Science, 1995. p.45-56. (Report, 11)
MALICKI, M.A.; PLAGGE, R. & ROTH, C.H. Improving the calibration of dielectric TDR soil moisture determination taking into account the solid soil. Eur. J. Soil Sci., 47:357-366, 1996.
PETERSEN, L.W.; THOMSEN, A.; MOLDRUP, P.; JACOBSEN, O.H. & ROLSTON, D.E. High-resolution time domain reflectometry: sensitivity dependency on probe-design. Soil Sci., 159:149-154, 1995.
ROTH, C.H.; MALICKI, M.A & PLAGGE, R. Empirical evaluation of the relationship between soil dielectric constant and volumetric water content as the basis for calibrating soil moisture measurements by TDR. J. Soil Sci., 43:1-13, 1992.
ROTH, K.; SCHULIN, R.; FLÜHLER, H. & ATTINGER, W. Calibration of time domain reflectometry for water content measurement using a composite dielectric approach. Water Res. Res., 26:2267-2273, 1990.
STEEL, R.G.; TORRIE, J.H. & DICKEY, D.A. Principles and procedures of statistics: a biometrical approach. 3. ed. New York, Mc-Grawn Hill, 1997. 666p.
TEIXEIRA, W.G.; FACCIN, O.P.; SCHROTH, G.; AZEVEDO, C.P. & HUWE, B. Calibração de TDR para avaliação da umidade do solo num Latossolo amarelo textura muito argilosa – Avaliação no campo. In: CONGRESSO BRASILEIRO DE CIENCIA DO SOLO, 26. Rio de Janeiro, 1997. Resumos expandidos. Rio de Janeiro, Sociedade Brasileira de Ciência do Solo/Embrapa – CNPS, 1997. CD-ROOM
TOMMASELLI, J.T.G & BACCHI, O.O.S. Calibração de um equipamento TDR para medida de umidade de solos. Pesq. Agropec. Bras., 36:1145-1154, 2001.
TOPP, G.C. & DAVIS, J.L. Measurements of soil water content using time-domain reflectometry (TDR): a field evaluation. Soil Sci. Soc. Am. J., 49:19-24, 1985.
VIEIRA, L.S. & SANTOS, P.C.T. Amazônia - seus solos e outros recursos naturais. São Paulo, Agronômica Ceres, 1987. 416p.
WEITZ, A.M.; GRAUEL, W.T.; KELLER, M. & VELDKAMP, E. Calibration of time domain reflectometry technique using undisturbed soil samples from humid tropical soils of volcanic origin. Water Res. Res., 33:1241-1249, 1997.
ZEGELIN, S.J.; WHITE, I. & JENKINS, D.R. Improved field probes for soil water content and electrical conductivity measurement using time domain reflectometry. Water Resour. Res., 25:2367-2376, 1989.
![Figure 2. Relation between the relative accumulated energy [P] and the radius [h] of an imaginary cylinder circunferenced around the TDR sensor-rod](https://thumb-eu.123doks.com/thumbv2/123dok_br/15887642.668483/5.892.456.806.733.991/figure-relation-relative-accumulated-energy-imaginary-cylinder-circunferenced.webp)
