Aeration simulation of stored grain under variable air ambient conditions
Daniela de Carvalho Lopes
a,∗, Jos´e Helvecio Martins
a, Evandro de Castro Melo
a,
Paulo Marcos de Barros Monteiro
baFederal University of Vi¸cosa, Department of Agricultural Engineering, Av. P.H. Rolfs, s/n, Campus Universit´ario, Vi¸cosa, 36570-000 MG, Brazil bFederal University of Ouro Preto, Department of Control and Automation, Escola de Minas, Campus Universit´ario,
Morro do Cruzeiro, Ouro Preto, 35400-000 MG, Brazil
Received 9 January 2006; accepted 10 May 2006
Abstract
A simulation model for stored grain aeration was implemented and compared with experimental data. The software, called AERO, is capable of simulating the aeration process in stored grain, with hot spots, using time variant ambient data. Some modifications to the original model proposed by Thorpe [Thorpe, G.R., 1997. Modelling ecosystems in ventilated conical bottomed farm grain silos. Ecol. Modell. 94, 255–286] have been presented. The modified model is simpler, less computer-intensive and maintains the accuracy of the results. Comparing the model with data collected between January and August 2005, it was observed that the simulation results agreed well with real conditions, indicating that this software can reliably predict the aeration process for different world regions.
© 2006 Elsevier B.V. All rights reserved.
Keywords: Aeration; Grain; Simulation
1. Introduction
Simulation models can be used to predict temperature, dry matter loss and moisture content of stored grain. Generally, these models are used to evaluate the efficacy of ambient air ventilation, to estimate the maximum safe storage period of grain and to predict the necessary aeration time. With these evaluations, it is possible to analyze the aeration viability for a specific region and to optimize control strategies. The value of the simulation is greater in tropical and subtropical regions, where the aeration benefits have not been totally investigated, experimentally.
Many mathematical models have been developed to sim-ulate the heat and the mass transfers in aerated bulk stored grains (Andrade, 2001; Canchun et al., 2001; Devilla, 2002; Sin´ıcio et al., 1997; Thorpe, 1997; Wilson, 1988). Many stud-ies have also been conducted to predict the temperature and moisture content variation in stored grain without aeration (Alagusundaran et al., 1990; Davidson, 1986; Muir et al., 1980; Sin´ıcio et al., 1997; Thorpe and Elder, 1982; White,
∗Corresponding author. Tel.: +55 31 3891 5909/9913 1597. E-mail address:[email protected](D. de Carvalho Lopes).
1988). Generally, these models are based on energy and mass balances. In some cases, it is also possible to estimate the airflow velocity, the airflow distribution and the pressure vari-ation inside the bin. In these studies, the authors obtained reliable results, but it is clear that further research is required. Recent advances in computer technology enabled the development of general-purpose software programs to simu-late grain aeration, which can be used in sensitivity analysis, relating the main variables involved in this process and help to manage this technology.
The objective of this work was to present the methodology employed in the development of a software program, called AERO, that simulates the grain aeration process based on a one-dimensional model by using time variant ambient data, which enables the effects of hot spots to be considered.
2. Methodology
The mathematical model used in this work was based on that formulated byThorpe (1997)and presented in more detail byThorpe (2001). This model relates air psychometric relationships with mass and energy balances. Some changes
were made in the original equations in order to simplify it, decreasing its execution time, but without decreasing its accu-racy. The differential equations that describe the heat and mass transfer in an aerated bulk of grain are expressed as:
∂θ
∂t
ρb[cg+cUw]+ερa
ca+R
cw+ ∂hv ∂Ta
=ρbhs ∂U
∂t −uaρa
ca+R
cw+∂hv
∂Ta
∂θ
∂y
+ρb
dms
dt (Qr−0.6hv) (1)
∂U
∂t ρb= −ρaua ∂R
∂y +
dms
dt (0.6+U) (2)
wherecais the specific heat of air (J kg−1◦C−1),cgthe
spe-cific heat of dry grain (J kg−1◦C−1),c
wspecific heat of water
(J kg−1◦C−1), h
v the latent heat of vaporization of water
(J kg−1),hs the differential heat of sorption (J kg−1),Uthe
grain moisture content (%) on a dry basis,msthe grain’s dry
matter loss (%),Qrthe heat of oxidation of grain (J s−1m−3),
Ta the air temperature in equilibrium with the grain (◦C),t
the time (s),uathe aeration air velocity (m s−1),Rthe humid-ity ratio of air (kg kg−1),ythe vertical coordinate (m),εthe
grain porosity (decimal),ρa the density of intergranular air
(kg m−3),ρ
bthe bulk density of the grain (kg m−3) andθis
the grain temperature (◦C).
In this work, the partial differential equations that describe heat and mass transfer, in bulk stored grains, were solved using numerical analysis (Eqs.(3) and (4)) because the solu-tion of one affects the solusolu-tion of the other and because the temperature and the relative humidity of the aeration air vary arbitrarily with time (Navarro and Noyes, 2001).
θinew=θi+
t
ρb(cg+cw)+ερa[ca+Ri(cw+dhv)]
×
hs
−ρaua
Ri−Ri− 1 y
+dm(0.6+Ui)
+ρbdm(Qr−0.6hv)−uaρa(ca+Ri(cw+dhv))
×
θi−θi− 1 y
(3)
Uinew=Ui+ t ρb
−ρaua R
i−Ri−1 y
+dmdt(0.6+Ui)
(4)
whereidenotes the node under consideration, dhvdTais the
differential of latent heat with relation to temperature, dmdt
is the rate of dry matter loss,tthe time interval (s) andy
is the section length (m).
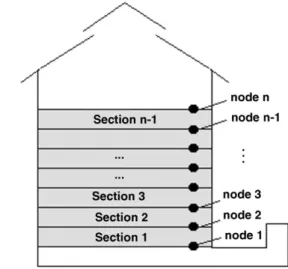
The bulk of grains was divided into sections in the ver-tical direction (direction of the airflow), as shown inFig. 1. The section limits were called nodes and at the first node it was assumed that the mass and temperature steady state
Fig. 1. Scheme used to characterize the various sections of a stored grain bulk.
conditions existed between equilibrium between the aeration air and surface of the bulk of grain. This configuration tends to overestimate the moisture content value of the first grain section. But, this problem was minimized by estimating the temperature and the moisture content of the first section using a Lagrangian interpolation considering the first four nodes.
Each section length was obtained by dividing the height of the grain bulk (L) by the total sections number (NS). The
soft-ware user should provide, as input data, the initial distribution of grain moisture content and temperature, the type of stored grain, its bulk density (the user can consult values registered in a database), the number of sections, the bin diameter and length, the local barometric pressure, the required airflow rate and the name of the file that contains the ambient data and the air temperature rise due to the fan operation. The initial distributions of grain moisture content and temperature can be uniform or contain hot spots and sections with different moisture contents.
During the simulation process, the grain moisture content and temperatures are calculated after each time interval for each section in an iterative way.
In the original mathematical model, the specific heat of dry grain, the specific heat of air and the specific heat of water were considered as constants. Navarro and Noyes (2001) pointed out that the specific heat of water and the specific heat of air are well-established quantities and in this work they were also used as constant values (4186 and 1000 J◦C kg−1,
respectively). ButBrooker et al. (1992)reported that the spe-cific heat of grain changes according to the grain moisture content variation. So, in the simulation executed by AERO, this parameter is calculated in each time interval for each grain section using Eq.(5):
cg=1000(K+QUP) (5)
The differential heat of sorption was estimated in each iter-ation step by applying Eq.(6)(Thorpe, 2001). This method was based on the Clapeyron equation and compares the vapor pressures of water in equilibrium with moist grain and free water.
hs =hv
1+Aexp( −BU)
(θ+C)2 (θ+273.15)
×
−5+ 6800
θ+273.15
(6)
whereA, B andC are constant values that depend on the stored product.
The equilibrium relative humidity (ERH) and the humid-ity ratio of the intergranular air for each section were also calculated in each iteration step. The ERH was obtained using Chung–Pfost equation, which is one of the equations approved by the ASAE (Brooker et al., 1992).
The value of dhvdTawas considered equal to−2363 from
Eq.(7), presented by Cengel and Boles, according toThorpe (2001). This equation was obtained by fitting a linear equation to thermodynamic data given in standard textbooks and it gives values of latent heat from vaporization of water within a maximum error of 0.02% in the temperature range from 0 to 50◦C.
hv=2501330−2363Ta (7)
The heat from oxidation of grain was considered equal to 15,778 kJ s−1m−3since the oxidation of 1 kg of grain
sub-strate liberates 15,778 kJ of heat and forms 1.47 kg of carbon dioxide and 0.6 kg of water (Thorpe, 2001).
The porosity of bulk grain was also considered a constant value (40%) based onBrooker et al. (1992). They reported that the intergranular void volume is 35–55% of the bulk grain volume for most product types. Therefore, considering this parameter as a constant value the model becomes simpler and does not affect the results significantly.
The density of intergranular air was calculated by using Eq. (8), presented by Al´e (2001), in order to consider the altitude effects on this parameter.
ρa= 352.8Patm
101.325(Taera+273.15) (8) whereTaera is the aeration air temperature (◦C) andPatm is
the barometric pressure (kPa).
In our approach to developing a simpler model, the diffu-sion term and the rate of energy flowing into the bin by ther-mal conduction, used in the original model, were neglected. This procedure was based on some tests we conducted dur-ing the development of the software. Even when the fan was considered to be turned off, the simulation results were very similar whether or not these terms were considered. These observations can be explained due the low values associated with the effective diffusivity of moisture vapor through grain and due to the high insulation thermal coefficient of the bulk grain.
Another term observed in the original model that was not used in AERO was the differential of integral heat of wetting of grains with respect to temperature (∂Hw/∂T). According
toThorpe (2001), this term could be neglected because its value cannot be calculated accurately since its equation was obtained using a large number of differentiation functions with empirically fit data.
The velocity of the aeration air was estimated by Eq.(9) depending on the bin dimensions and on the required airflow rate:
ua=qV
S (9)
where ua is the velocity of aeration air (m s−1), Vthe bin
volume (m3),Sthe bin cross section area (m2) andqis the
required airflow rate (m3s−1m−3).
Finally, a method developed by Thompson (1972) was used to determine the rate of dry matter loss. An empirical equation was applied considering that the dry matter loss is time dependent (Eq.(10)).
dms
dt =
14.72×10⁻¹⁰
exp 1.667×10⁻⁶t/M MMT
+2.833×10⁻⁹
MMMT
(10)
The termsMM(moisture modifier) andMT(temperature
modifier) modify the grain conditions depending on its mois-ture content and temperamois-ture.MT can be calculated by Eq.
(11) (when temperature is lesser or equal to 15.5◦C and
moisture content is lesser or equal to 19% w.b.), 12 (when temperature is greater than 15.5◦C and moisture content
is between 19 and 28% w.b.) and 13 (when temperature is greater than 15.5◦C and moisture content is greater or equal
to 28% w.b.). The moisture modifier is obtained by Eq.(14).
MT=32.2 exp(−0.1044θ−1.856) (11) MT=32.2 exp(−0.1044θ−1.856)
+UP
−19
100 exp(0.0183θ−0.2847) (12)
MT=32.2 exp(−0.1044MMMTθ−1.856)
+0.09 exp(0.0183θ−0.2847) (13)
MM=0.103
exp
455 (100U)1.53
−0.845U+1.558
(14)
The simpler model obtained has the advantages that its solution is easier to obtain and it saves computing resources.
3. Results and discussion
Fig. 2. Output data screen of AERO.
be viewed on the software screen (Fig. 2) and are also saved in electronic spreadsheets.
The simulation model results were verified against exper-imental data collected from January to August 2005 using a
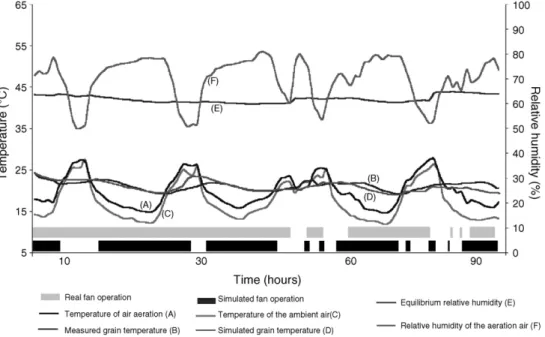
bin with a diameter of 2.6 m and a height of 1.5 m, located at the Federal University of Vic¸osa (Brazil) and filled with maize. Figs. 3–5 show the graphical comparison of data for 100 h of aeration in June 2005, for the three
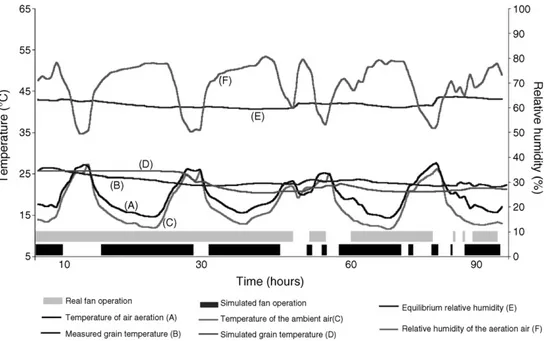
Fig. 4. Measured and simulated data profiles vs. time at the second bulk grain level for 100 h in June 2005.
ated grain sections. The predicted temperatures were com-pared with the measured ones taken at three levels, moni-tored by DS1820 addressable temperature sensors from the 1-WireTM series. It is important to highlight that as the distance between nodes is reduced, the numerical solution becomes a better approximation. Although, only three lev-els were monitored, the simulation was performed using 15 sections. To compare the results, an average of each five simulated sections was used, characterizing each monitoring level. Also, if users choose a number of sections that results in a layer thickness greater than 0.5 cm, they are advised
that better results could be achieve if more sections are considered.
During the observed period, the average daytime tempera-ture of the ambient air was 19◦
C and the average temperature of the night time ambient air was 13.5◦
C. The average tem-perature of the aeration air was 21◦C for the day period
and 16.9◦C for the night. The average relative humidity
of the air aeration was 70%. The maximum and the mini-mum relative humidity of aeration air observed in this period were 81.2 and 50%, respectively. The average moisture con-tent of the stored grain was 13.6% wet basis. Initially, the
temperature of the three bulk grain levels were 24.32, 25.7 and 25.88◦C, respectively. During the period observed in
Figs. 3–5, these temperatures dropped to 22, 22.5 and 22.7◦C,
respectively.
The predicted results agree well with recorded data. From these results, it could be noted that the mathematical model gives a good prediction of the stored grain system for moments when the aeration system was turned on and turned off. Also, the simulated operation of the aeration sys-tem matches well during the times when the fan was on and off.
The maximum difference between measured and simu-lated temperatures was 3.2◦C at the second bulk grain level.
By using a larger bin, better results can be reached because the solar radiation and air convection influence will be smaller and the model will predict the real data better. During the day, higher temperatures were observed near the wall and the surface than those near the center of the bin. During the night, when the ambient temperatures dropped, the cooling process was more accentuated in these regions of the bin.
The results are strongly dependent on the control strat-egy used, which considered the relationships between the aeration air and the bulk grain conditions. The objective of the control strategy was to maintain the temperature gradi-ent inside the bin smaller than 3◦
C and cool the bulk grain whenever possible. The predicted moisture content was used in the control strategy to prevent the possibility of grain ker-nels, near the air inlet, to be excessively dried or dampened. These objectives guarantee safe storage conditions in tropi-cal and subtropitropi-cal regions in which accentuated daily and seasonal temperature fluctuations occur and where suitable cooling could not be achieved. In these regions, the aeration system should be used as a preventive tool and its success will depend on additional care to store the grain dry and clean.
4. Conclusion
The mathematical model proposed byThorpe (1997)and presented in more details by Thorpe (2001), can be suc-cessfully used with some modifications, suggested in this research, for predicting the complex changes in stored grain systems under various conditions and with the aeration sys-tem turned on or turned off. This will help students,
con-sultants, teachers and other storage professionals predict the behavior of aeration systems.
References
Alagusundaran, K., Jayas, D.S., White, N.D.G., Muir, W.E., 1990. Finite difference model of three-dimensional heat transfer in grain bins. Can. Agric. Eng. 32, 315–321.
Al´e, J.F., 2001. Sistemas de ventilac¸˜ao industrial—ventiladores. Depar-tamento de Engenharia Mecˆanica e Mecatrˆonica, LSFM, PUCRS (in Portuguese).
Andrade, E.T., 2001. Simulac¸˜ao da variac¸˜ao de temperatura em milho armazenado em silo met´alico. Vic¸osa, Minas Gerais: Imprensa Univer-sit´aria, Universidade Federal de Vic¸osa, Tese de doutorado em Engen-haria Agr´ıcola 174 pp. (in Portuguese with English abstract). Brooker, D.B., Bakker-Arkema, F.W., Hall, C.W., 1992. Drying and storage
of grains and oilseeds. AVI Book, USA, 450 pp.
Canchun, J., Da-Wen, S.E., Chongwen, C., 2001. Computer simulation of temperature changes in a wheat storage bin. J. Stored Prod. Res. 37, 165–167.
Davidson, M.R., 1986. Natural convection of gas/vapor mixtures in a porous medium. Int. J. Heat Mass Transfer 29, 1371–1381.
Devilla, I.A., 2002. Simulac¸˜ao de deteriorac¸˜ao e de distribuic¸˜ao de temper-atura e umidade em uma massa de gr˜aos armazenados em silos com aerac¸˜ao. Vic¸osa, Minas Gerais, Imprensa Universit´aria, Universidade Federal de Vic¸osa, Tese de doutorado em Engenharia Agr´ıcola 84 pp. (in Portuguese with English abstract).
Muir, W.E., Fraser, B.M., Sinha, R.N., 1980. Simulation model of two-dimensional heat transfer in controlled atnosfhere grain bins. Can. Agric. Eng. 12, 21–24.
Navarro, S., Noyes, R.T., 2001. The mechanics and physics of modern grain aeration management. CRC Press, Boca Raton, 647 p.
Sin´ıcio, R., Muir, W.E., Jayas, D.S., 1997. Sensitivity analysis of a mathe-matical model to simulate aeration of wheat stored in Brazil. Postharvest Biol. Technol. 11, 107–122.
Thompson, T.L., 1972. Temporary storage of high-moisture shelled corn using continuous aeration. Transactions of the ASAE. St. Joseph, MI, vol. 15, no. 2, pp. 333–337.
Thorpe, G.R., Elder, W.B., 1982. The effects of aeration on the persistence of chemical pesticides applied to bulk stored grain. J. Stored Products Res. 18, 103–114.
Thorpe, G.R., 1997. Modelling ecosystems in ventilated conical bottomed farm grain silos. Ecol. Modell. 94, 255–286.
Thorpe, G.R., 2001. Physical basis of aeration. In: Navarro, S., Noyes, R.T. (Eds.), The Mechanics and Physics of Modern Grain Aeration Manage-ment. CRC Press, Boca Raton, pp. 125–194, Chapter 4.
White, G.G., 1988. Temperature changes in bulk stored wheat in subtropical Australia. J. Stored Products Res. 24, 5–11.