www.ccarevista.ufc.br ISSN 1806-6690
LINSEC - The software for modeling and simulation of grain drying
systems
1LINSEC - Programa computacional para modelagem e simulação de sistemas de
secagem de grãos
Domingos Sárvio Magalhães Valente2*, Daniel Marçal de Queiroz2, Luis César da Silva3, Gabriel Henrique Horta
de Oliveira4 e Fábio Lúcio Santos5
ABSTRACT - Considering the importance of mathematical models in the development and analysis of grain drying systems, and understanding the need to develop interfaces that will improve the accessibility of these models, this work aimed to: a) implement the Thompson model to simulate grain drying at high temperatures; b) develop an appropriate language to generate drying models; and c) develop a graphical interface with the goal of facilitating user understanding. Thus the computational program LINSEC that was created using the programming language Visual Basic 6.0. LINSEC was highly effective for the modeling and simulation of drying systems and in providing simulated values close to reality. LINSEC is highly flexible and user-friendly during the modeling of several types of dryers.
Key words:Grain dryer. Mathematical models. Thompson’s model.
RESUMO - Tendo em vista a importância dos modelos matemáticos no desenvolvimento e análise de sistemas de
secagem, além do conhecimento e necessidade de desenvolver interfaces de modo a aprimorar a acessibilidade e uso destes modelos, este trabalho visou: a) implementar o modelo de Thompson de modo a simular a secagem de grãos a altas temperaturas; b) desenvolver uma linguagem apropriada para gerar sistemas de secagem; e c) desenvolver uma interface gráfica com o objetivo de facilitar o entendimento do usuário, utilizando-se a linguagem Visual Basic 6.0. O programa computacional LINSEC, demonstrou uma alta efetividade na simulação de secagem, fornecendo valores próximos à realidade. É flexível e de fácil utilização pelo usuário durante a simulação para diferentes tipos de secadores.
Palavras-chave: Secadores de grãos. Modelos matemáticos. Modelo de Thompson.
*Autor para correspondência
1Recebido publicação em 02/02/2011; aprovado 28/02/2012
The authors would like to acknowledge CNPq and FAPEMIG, agencies of the Brazilian government, for their financial support, essential for the completion of this research
2Departamento de Engenharia Agrícola/UFV, Campus UFV, Viçosa-MG, Brasil, 36.570-000, valente@ufv.br, queiroz@ufv.br 3Departamento de Engenharia Rural/UFES, Campus de Alegre, Alegre-ES, Brasil, 29.500-000, silvalc@cca.ufes.br
It has been proved that mathematical modeling and simulation are important tools in the development, design and analysis of grain drying systems. These activities normally require programming language skills. Therefore, this scenario indicates the need to develop graphical interfaces that can aid modeling and simulation of drying systems. Therefore, this work presents a computational toolset that provides modeling and simulation drying systems with a graphical interface.
MATERIAL AND METHODS
A computational program known as LINSEC was implemented through the use of the program Visual Basic, version 6.0. It is a graphically oriented simulation toolset that allows the assemblage of computational models of grain dryers and simulation of the drying process according to Thompson’s model. The organized block structure of the model permits the modeling and simulation of several types of grain drying systems.
The blocks are related to air, products and dryers. Each block represents an integral specific part of the drying system. LINSEC disposes of fifteen blocks. In order to model a dryer system, users need to select blocks according to dryer configuration.
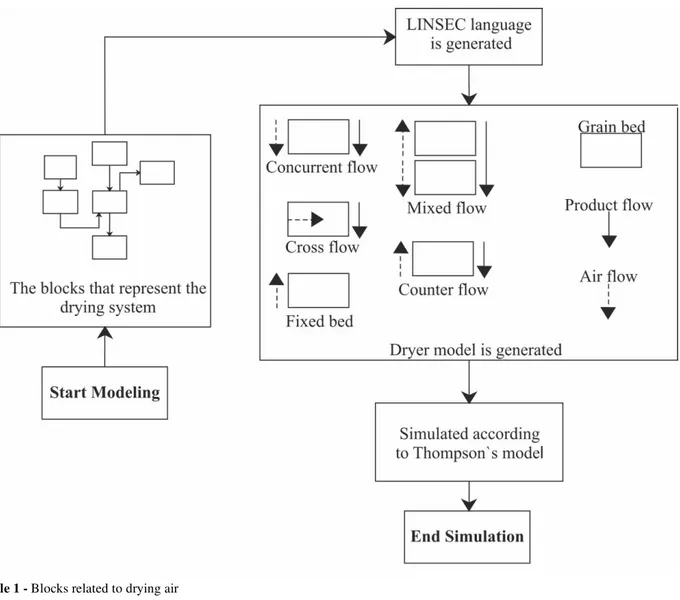
LINSEC works in the following way: (a) the blocks that represent the drying system parts are inserted in the workspace; (b) the blocks are connected accordingly to the logic that governs the drying systems, leading to the flow sheet of air and product movement; (c) an instructional code of LINSEC language is generated; and (d) LINSEC compiles the language and simulates the drying on the basis proposed by Thompson, Peart e Foster (1968). The conceptual model related to the modeling of drying systems using LINSEC can be seen in Figure 1.
The drying process was divided into several subprocesses. The grain bed was considered as several layers with reduced thickness, placed upon each other. The variations in the conditions of air and grain in each layer were calculated based on small increments of time. All steps and equations are presented by Souza, Queiroz and Lacerda Filho (2002) and Dalpasquale and Sperandio (2010).
Tables 1, 2 and 3 contain, respectively, information about blocks related to drying air, product properties and dryer configuration.
INTRODUCTION
Artificial drying of agricultural products is a technology which usually utilizes high cost equipment with high energy consumption in order to heat the air used
for drying (REINATO et al., 2002; SHARMA; CHEN;
LAN, 2009). Among drying modalities, drying at high temperatures is the most commonly used technology in commercial grain storage facilities (LUANGMALAWAT et al., 2007). This technology generates a gradient of humidity which accelerates the drying process, extends the shelf life of agricultural products (ERENTURK; ERENTURK; TABIL, 2004) and prevents losses due
to the low water activity achieved (ULLMANN et al.,
2010). However, it also creates conditions that can cause discoloration, cracks and fissures on the grains
(BUNYAWANICHAKULet al., 2007; LUANGMALAWAT
et al., 2007; NISHIYAMA; ZAO; LI., 2005; RAO; BAL; GOSWAMI, 2006). In this case, the equipment must be designed in order to prevent these changes, preserve product quality and maximize dryer efficiency.
The main goal of drying is to remove excess water from the product until it reaches the ideal level of moisture content. This level is required in order to store, process and commercialize grain in a
safe mode (JAYAS; WHITE, 2003; LIU et al., 2007;
OLIVEIRAet al., 2010). To achieve this objective on
a commercial scale, the use of high-capacity dryers that employ high drying-air temperature is recommended. These dryer systems generally imply high acquisition cost, heating energy consumption, and electrical energy usage
(REINATOet al., 2002; SHARMA; CHEN; LAN, 2009).
Generally, drying mathematical models are used to predict final moisture content and output product temperature of products and drying time (DALPASQUALE et al., 2007). The mathematical model consists of heat and mass transfer interaction between the product and drying air. Even though empirical equations provide very accurate results for each specific experiment, they are not valid for other conditions. Simulation models are therefore recommended for describing the drying process (MOVAGHARNEJAD; NIKZAD, 2007).
Figure 1 - Conceptual model related to the modeling of drying systems using LINSEC
Table 1 - Blocks related to drying air
Block Name Graphic Symbol Description
Air source
Used for defining inlet air conditions such as: air temperature (oC), relative humidity (%), and
volumetric flow rate (m3 s-1)
Heating system
Characterizes heater system according to the following information: air outlet temperature (oC),
heater system efficiency (%), and energy consumption (kJ s-1)
Air divider Divides airflow in two outlets. User needs to informpercentage of air flow for which outlets
Air mixer Used for modeling mixing of two airstreams
Air exhaust storage
Monitors the outlet airstreams conditions. During simulation it reports: average air temperature (oC),
Table 2 - Blocks related to product properties
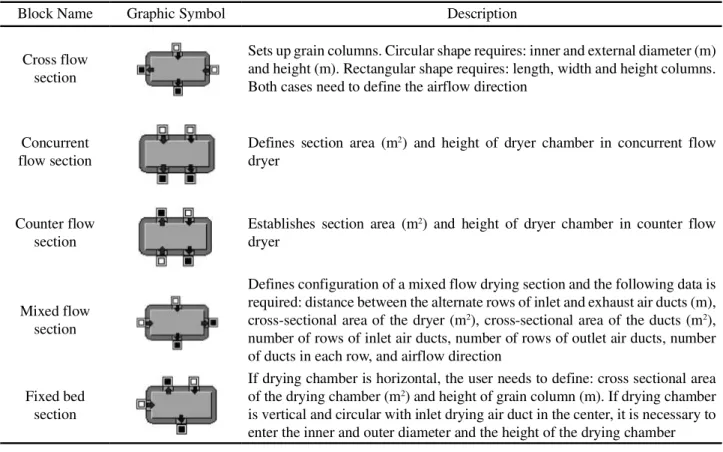
Table 3 - Blocks related to dryer configuration
Block Name Graphic Symbol Description
Product inlet
Used for defining initial grain properties: type (corn, soybean, wheat or rice), moisture content (% w.b.), temperature (oC), specific mass (kg m-3) and product
flow (kg s-1)
Storage section Sets up a grain holding bin: requires volume (m3)
Product divider Divides grains flow in two. User needs to inform which percentage will flowby outlet “A”
Product mixing Represents the mixing of two grain flows
Product outlet Reports final moisture content of the product
Block Name Graphic Symbol Description
Cross flow section
Sets up grain columns. Circular shape requires: inner and external diameter (m) and height (m). Rectangular shape requires: length, width and height columns. Both cases need to define the airflow direction
Concurrent flow section
Defines section area (m2) and height of dryer chamber in concurrent flow
dryer
Counter flow section
Establishes section area (m2) and height of dryer chamber in counter flow
dryer
Mixed flow section
Defines configuration of a mixed flow drying section and the following data is required: distance between the alternate rows of inlet and exhaust air ducts (m), cross-sectional area of the dryer (m2), cross-sectional area of the ducts (m2),
number of rows of inlet air ducts, number of rows of outlet air ducts, number of ducts in each row, and airflow direction
Fixed bed section
If drying chamber is horizontal, the user needs to define: cross sectional area of the drying chamber (m2) and height of grain column (m). If drying chamber
Figure 2 -(a) Conceptual model that represents the fixed bed dryer and (b) model that represents the fixed bed dryer in the LINSEC under the same experimental conditions specified by Silva (1980)
In order to test LINSEC, two different sets of data related to the corn drying were employed: (i) the first one refers to a fixed bed dryer designed by Silva (1980), and (ii) the second to a concurrent flow dryer developed by Queirozet al. (1988).
Fixed bed dryer modeling
Figure 2 shows a flowchart that represents the fixed bed dryer under the same experimental conditions carried out by Silva (1980).
The drying chamber of a fixed bed dryer was
modeled with a cross section of 1.0 m2, and column
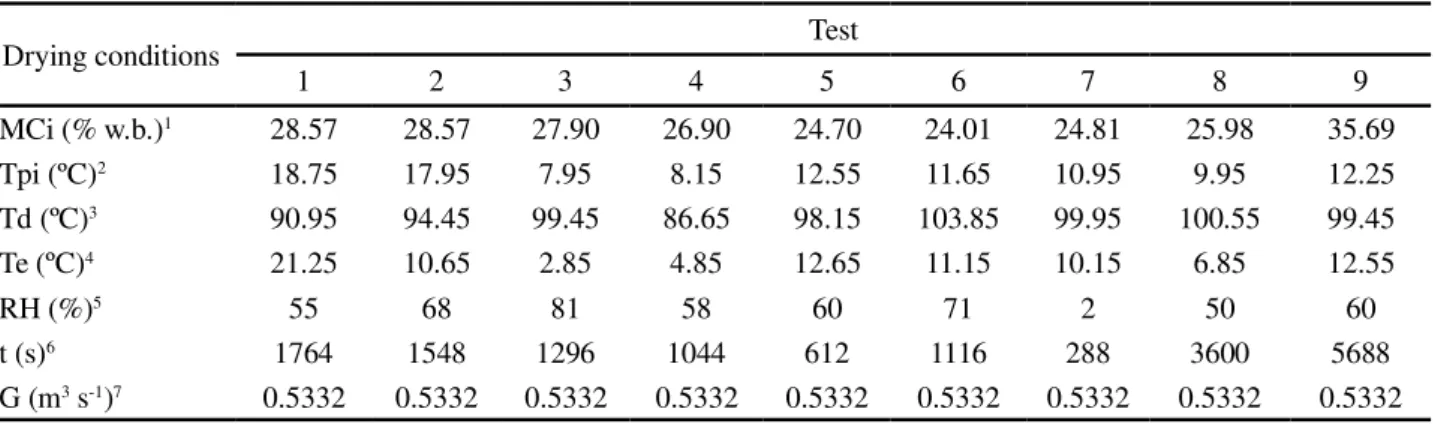
height of 0.305 m grain. The experimental data of nine drying tests accomplished by Silva (1980) is presented in Table 4.
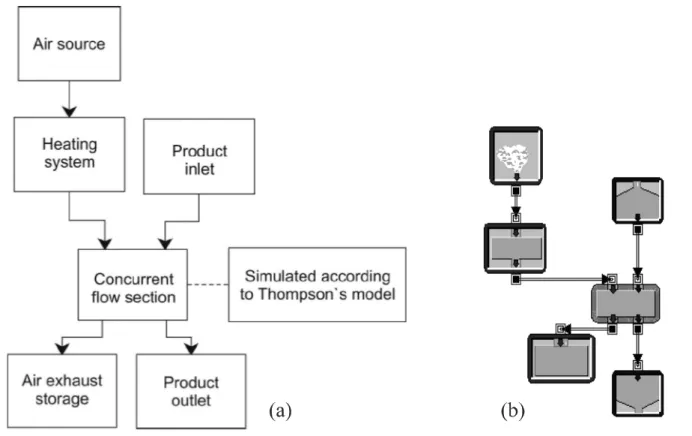
Concurrent flow dryer modeling
The Figure 3 presents the flowchart that represents the concurrent flow dryer under the same experimental conditions conducted by Queirozet al. (1988).
Table 4 - Drying conditions used in the experimental tests conducted by Silva (1980) and implemented in LINSEC in order to run simulations in the fixed bed dryer for corn
1/ MCi, initial moisture content of the product;2/Tpi, initial temperature of the product;3/ Td, drying air temperature; 4/Te, environment air temperature; 5/RH, relative humidity;6/ t, drying time;7/G, airflow
Drying conditions Test
1 2 3 4 5 6 7 8 9
MCi (% w.b.)1 28.57 28.57 27.90 26.90 24.70 24.01 24.81 25.98 35.69
Tpi (ºC)2 18.75 17.95 7.95 8.15 12.55 11.65 10.95 9.95 12.25
Td (ºC)3 90.95 94.45 99.45 86.65 98.15 103.85 99.95 100.55 99.45
Te (ºC)4 21.25 10.65 2.85 4.85 12.65 11.15 10.15 6.85 12.55
RH (%)5 55 68 81 58 60 71 2 50 60
t (s)6 1764 1548 1296 1044 612 1116 288 3600 5688
Table 5 - Experimental conditions of the drying tests performed by Queirozet al. (1988) and implemented in LINSEC for simulating
the corn drying process in the concurrent flow dryer
1/ MCi, initial moisture content of the product;2/Tpi, initial temperature of the product;3/ Td, drying air temperature;4/ Te, environment air temperature;5/RH, relative humidity;6/ t, drying time;7/ G, airflow;8/ Lr, loading rate
The dryer dimensions are: chamber cross
section of 0.25 m2 and grain bed height of 0.60 m.
Figure 3 - (a) Conceptual model that represents the concurrent flow dryer and (b) model that represents the concurrent flow dryer in the LINSEC under the same experimental conditions conducted by Queirozet al. (1988)
The experimental data of the nine tests conducted by Queirozet al. (1988) are presented in Table 5.
Drying conditions
Test
1 2 3 4 5 6 7 8 9
MCi (% w.b.)1 15.87 14.92 16.78 17.10 17.52 17.46 19.12 18.93 17.59
Tpi (ºC)2 26.00 29.40 29.00 29.60 27.50 30.00 28.50 28.90 27.70
Td (ºC)3 130.30 130.50 169.60 160.40 150.50 170.20 140.20 140.50 157.20
Te (ºC)4 20.90 27.40 25.10 28.50 20.00 26.70 27.20 21.80 27.60
RH (%)5 72 58 59 59 79 63 58 72 59
t (s)6 12600 14400 11700 10800 11700 11700 10800 13500 11700
G (m3 s-1)7 0.5332 0.5332 0.5332 0.5332 0.5332 0.5332 0.5332 0.5332 0.5332
RESULTS AND DISCUSSION
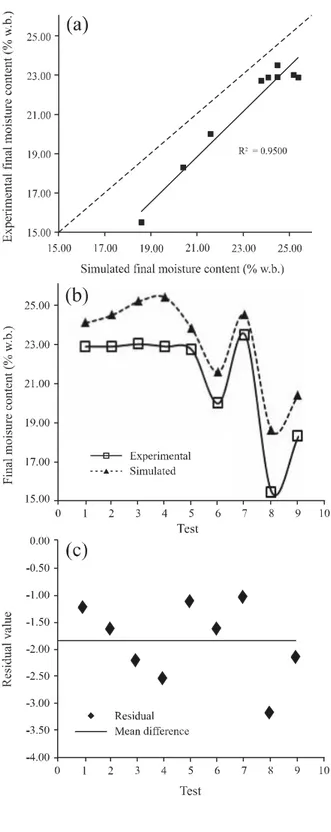
Figure 4 shows the results of the average final moisture content simulated by LINSEC and experimental data obtained by Silva (1980).
Figure 4 -(a) Simulated values of final moisture contentversus
experimental data obtained by Silva (1980), (b) comparison of simulated and experimental final moisture content in each test and (c) tendency of residual distribution values
As can be seen in Figure 4, the final moisture content simulated by LINSEC was higher than the experimental data. The mean and maximum absolute differences between simulated and experimental moisture contents were 1.82% w.b. and 3.13% w.b., respectively. Martinset al. (1982) performed the same comparative test using the MSU (Michigan State University) simulated and experimental data and obtained the mean and maximum differences of 0.88% w.b. and 3.45% w.b., respectively. As showed in Figure 4, the residual values demonstrate that simulated data presented a stochastic distribution and a systematic mean error.
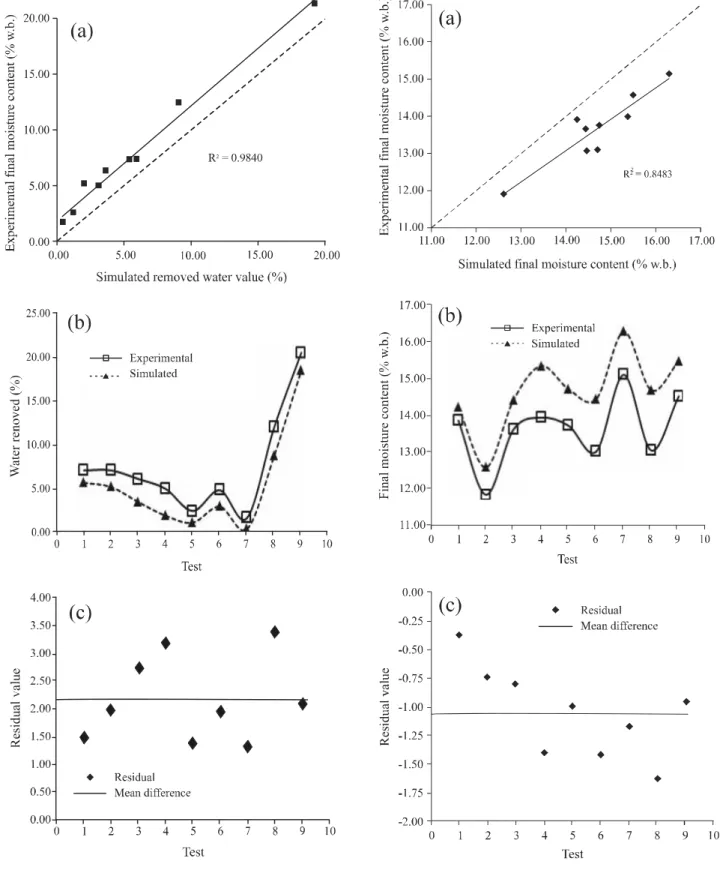
Figure 5 presents the results of the water
removed from the grains in the simulated tests versus
experimental tests carried out by Silva (1980).
Figure 5 shows that simulated values of the amount of water removed from the grains were underestimated in relation to the experimental values. The mean and maximum absolute differences between the simulated and experimental data were 2.16% and 3.37%, respectively. As showed in Figure 5, the residual distribution values demonstrate that simulation results presented stochastically distributed and systematic mean error. The correlation coefficient was 0.9840.
The results of the average final moisture content simulated by LINSEC and experimentally obtained data by Queirozet al. (1988) can be seen in Figure 6.
According to Figure 6 final moisture content simulated by LINSEC was higher than results
obtained by Queiroz et al. (1988). The mean and
maximum absolute differences between simulated and experimental final moisture content were 1.05% w.b. and 1.63% w.b., respectively. Queirozet al. (1988), in the same comparison, using the MSU model, obtained the mean and maximum differences of 0.35% w.b. and 0.70% w.b., respectively. The largest error observed in this study probably could have been caused by lower accuracy in the Thompsons’s model for drying temperatures above 100 °C, as shown in Table 5. In this case, the Michigan model has better accuracy.
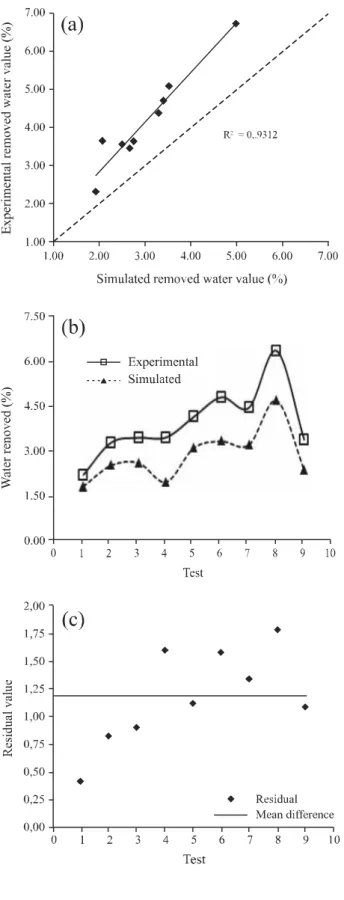
Figure 7 shows the results of water removed
from the grains in the simulated tests versus the
Figure 5 - (a) Water removed from the grains simulated test
versus experimental values obtained by Silva (1980), (b) comparison of simulated and experimental water removed from grains in each test, and (c) tendency of residual distribution values
Figure 6 - (a) Simulated final moisture content versus
Figure 7 - (a) Water content removed from the grains by simulation versus experimental values of water removed obtained by Queiroz et al. (1988), (b) comparison of simulated and experimental water removed from the grains in each test and (c) Tendency of the residual distribution values
distribution and systematic mean error, and there is increasing tendency of error according to increasing amounts of water removed from grains.
CONCLUSIONS
1. According to the test procedures, LINSEC, a toolset for modeling grain dryers, can be used for modeling and simulating a concurrent flow drier and fixed bed dryer, with the great advantage of not demanding user knowledge of programming languages;
2. Modeling drying systems using LINSEC is an easy procedure that offers a large number of users the opportunity to use simulation at the development, design, evaluation and analysis of drying systems.
ACKNOWLEDGEMENTS
The authors thank CNPq and FAPEMIG for the indispensable funding source and support.
REFERENCES
BUNYAWANICHAKUL, P.et al. Modeling and Simulation
of Paddy Grain (Rice) Drying in a Simple Pneumatic Dryer.
Biosystems Engineering, v. 96, n. 03, p. 335-344, 2007. DALPASQUALE, V. A.et al. Fixed-bed drying simulation of
agricultural products using a new backward finite difference scheme. Applied Mathematics and Computation, v. 200, n. 02, p. 590-595, 2007.
DALPASQUALE, V. A.; SPERANDIO, D. Modelo de simulação de secagem de produtos agrícolas usando entalpia do ar constante.
Engenharia Agrícola, v. 30, n. 04, p. 726-731, 2010.
ERENTURK, K.; ERENTURK, S.; TABIL, L. G. A comparative study for the estimation of dynamical drying behavior of Echinacea angustifolia: regression analysis and
neural network.Computers and Electronics in Agriculture,
v. 45, n. 01/03, p. 71-90, 2004.
JAYAS, D. S; WHITE, N. D. G. Storage and drying of grain in Canada: low cost approaches. Food Control, v. 14, n. 04, p. 255-261, 2003.
LIU, X.et al. A neural network for predicting moisture content
of grain drying process using genetic algorithm.Food Control, v. 18, n. 08, p. 928-933, 2007.
LUANGMALAWAT, Pet al. Effect of temperature on drying characteristics and quality of cooked rice.LWT - Food Science and Technology, v. 41, n. 04, p. 716-723, 2007.
MARTINS, J. H. et al. Simulação de secagem de milho em
MOVAGHARNEJAD, K.; NIKZAD, M. Modeling of tomato drying using artificial neural network. Computers and Electronics in Agriculture, v. 59, n. 01/02, p. 78-85, 2007. NISHIYAMA, Y.; CAO, W.; LI, B. Grain intermittent drying characteristics analyzed by a simplified model.Journal of Food Engineering, v. 76, n. 03, p. 272-279, 2005.
OLIVEIRA, G. H. H. et al. Desorption isotherms and
thermodynamic properties of sweet corn cultivars (Zea mays L.).
International Journal of Food Science and Technology, v. 45, n. 03, p. 546-554, 2010.
QUEIROZ, D. M.et al. Simulação de secagem de milho em
secadores de fluxos concorrentes de um estágio. Revista Brasileira de Armazenamento, v. 13, n. 01, p. 07-10, 1988.
RAO, P. S.; BAL, S.; GOSWAMI, T. K. Modelling and optimization of drying variables in thin layer drying of parboiled paddy. Journal of Food Engineering, v. 78, n. 02, p. 480-487, 2006.
REINATO, C. H. R. et al. Consumo de energia e custo de secagem de café cereja em propriedades agrícolas do sul de Minas Gerais.Revista Brasileira de Engenharia Agrícola e Ambiental, v. 06, n. 01, p. 112-116, 2002.
SHARMA, A.; CHEN, C. R.; LAN, N. V. Solar-energy drying systems: A review. Renewable and Sustainable Energy Reviews, v. 13, n. 06/07, p. 1185-1210, 2009.
SILVA, J. S. An engineering-economic comparison of five drying techniques for shelled corn on Michigan Farms. EUA: Michigan State University, 1980. 200 f.
SOUZA, C. M. A.; QUEIROZ, D. M.; LACERDA FILHO, A. F. Simulação do Processo de Secagem de Sementes de Milho em Camada Fixa.Scientia Agricola, v. 59, n. 04, p. 653-660, 2002. THOMPSON, T. L.; PEART, R. M.; FOSTER, G. H. Mathematical simulation of corn drying: a new model. Transaction of the ASAE, v. 11, n. 04, p. 582-586, 1968.
ULLMANN; R.et al. Seed quality of jatropha under different