Vol.52, n. 3: pp. 747-754, May-June 2009
ISSN 1516-8913 Printed in Brazil BRAZILIAN ARCHIVES OF
BIOLOGY AND TECHNOLOGY
A N I N T E R N A T I O N A L J O U R N A L
Comparison
of
Biostimulation
and
Bioaugmentation
Techniques for the Remediation of Used Motor Oil
Contaminated Soil
Surajudeen Abdulsalam
*and Adaji Benjamin Omale
School of Engineering and Engineering Technology; Abubakar Tafawa University; Bauchi - Nigeria
ABSTRACT
This study was carried out on the bioremediation of used motor oil contaminated soil artificially contaminated to a pollutant level of 40,000ppm using biostimulation and bioaugmentation remediation techniques for 42 days. Four treatment options were investigated in wooden microcosms: Control (T1), water amended (T2), biostimulation (T3) and hybrid of biostimulation and bioaugmentation (T4). The effectiveness of bioremediation processes were monitored using the total petroleum hydrocarbon removal (TPH) and total bacterial count (TBC). T3 had the highest TPH removal rate (69.2±0.05%), followed by T4 (65.2±0.25%) and T2 (58.4±0.5%); the control (T1) had the lowest TPH removal rate (43.2±1.5%). TBC revealed that bioremediation actually took place; T4 had the highest maximum bacterial growth of 9.6E+07CFU/g, followed by T3 (7.2E+07CFU/g), T2 (1.7E+05CFU/g) and T1 (1.65E+05CFU/g). In addition, T3 had the highest metal removal rate (2.172%) and T4 had the lowest metal removal rate (0.203%).
Key words: bioremediation, biostimulation, bioaugmentation, TPH, used motor oil, wooden microcosms
*
Author for correspondence: [email protected]
INTRODUCTION
Bioremediation is internationally approved technology for cost effective clean up of oil-contaminated sites. These technologies involve enhancing the natural biological transformation of chemical or petroleum-derived contaminants into less toxic and/or less mobile form. These technologies are gaining increased attention due to their low cost and effectiveness (Less and Senior, 1995; Vidali, 2001). As a transformation mechanism, it achieves permanent treatment of contaminants. Soil bioremediation may be broadly divided into “In Situ” and “Ex Situ” strategies. The former method refers to the treatment that
does not involve the excavation of contaminated soil whilst the latter does.
The most widely used “Ex-situ” technologies are Landfarming, Windrows and Biopile. In the present work, landfarming was chosen because of the nature of hydrocarbon involved (i.e. high boiling point) and expected depth of pollutant from the soil surface.
enhance the rate of contaminant biodegradation in the affected soil or water because the density of contaminant-specific degraders might have been artificially increased. On the other hand, in biostimulation approach, emphasis is placed on identifying and adjusting certain physical and chemical factors (such as soil temperature, pH, moisture content, nutrient content e.t.c) that may be impending the rate of biodegradation of the contaminant by the indigenous microorganism in the affected site (Chambers et al., 1991).
Landfarming is a simple technology in which contaminated soil is excavated and spread over a prepared bed and periodically mixed until pollutants are degraded. The goal is to stimulate indigenous biodegradative microorganisms and facilitate their aerobic degradation of contaminants. In general, the practice is limited to the treatment of superficial 10 – 35cm of soil such as the used motor oil contaminated soils (Vidali, 2001). Since landfarming has the potential to reduce monitoring and maintenance costs, as well as clean-up liability, it has received much attention as a disposal alternative.
Lubricant oils are a common element in daily lives, as they are needed to allow many engines and mechanisms to function. However, through their use, they loose their properties, become contaminated and at some point, they become unfit for the purpose originally intended. Fresh lubricating oils then replace these used oils and the waste oil must have a final disposal.
In Nigeria, as in other part of the developing world, oil spills at auto-mechanic workshops have been left uncared for over the years and its continuous accumulation may cause serious environmental problems because of its hazardous nature. For instance, used motor oil disposed of improperly contains potentially toxic substances, such as benzene (carcinogens), lead, arsenic, zinc
and cadmium, which can seep into the ground and contaminate ground water (Http. 2). In addition, one gallon of used motor oil can contaminate one million gallons of fresh water (Http.1; Http. 2) and render four-acre of soil unusable for planting for decades (Http. 2). Furthermore, used motor oil defiles the aesthetic nature of the environment. The objectives of this work were to examine the extent of biodegradation of used motor oil contaminated soil using the land farming technique, effect of metal content on bioremediation and to determine the best treatment option(s) for rehabilitation of used motor oil contaminated soils at commercial level.
MATERIALS AND METHODS
Materials
Fresh uncontaminated soil, with no prior history of oil contamination was excavated from Abubakar Tafawa Balewa University School Farm, Bauchi-Nigeria between 0-30cm from the soil surface. The soil was sieved on 2mm sieve to enhance proper mixing and extract consisting mainly of stones and dead plant debris discarded.
The sieved soil was contaminated artificially with three months old used motor oil to a pollutant level of 40,000ppm and its moisture content level was increased from 1.37 to 15 using distilled water. The soil matrix was properly mixed at ambient temperature (25-30oC).
Each of the contaminated soil (2kg) were stacked into four wooden boxes lined with polyethylene bags internally to prevent the leaching. Each box had dimension of 10cm height X 30cm length X 30cm width with soil layer 1.27cm deep. Various treatment options were prepared according to Table 1.
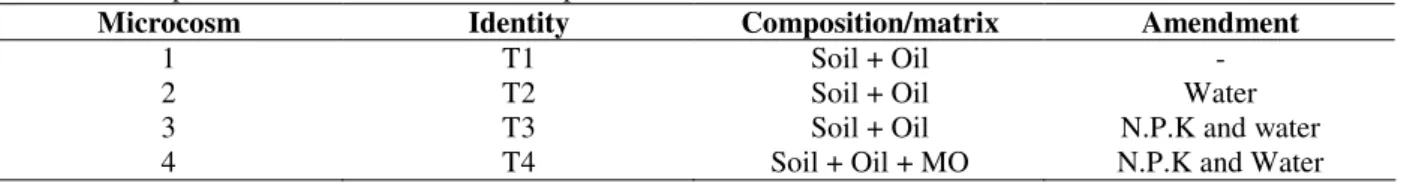
Table 1 - Composition of Various Treatment Options.
Microcosm Identity Composition/matrix Amendment
1 T1 Soil + Oil -
2 T2 Soil + Oil Water
3 T3 Soil + Oil N.P.K and water
4 T4 Soil + Oil + MO N.P.K and Water
T: treatment and MO: microorganisms.
An amount of 57.2g of fertilizer (N.P.K; 20:10:10) containing 20% inorganic N (9.5% NO3-N, 10.5% NH3-N), 10% P2O5 and 10% K2O were added as
the microcosms where applicable and properly homogenized.
Used motor oil degrading microbes were isolated from two auto-mechanics workshops in Bauchi metropolis. The microorganisms identified were
Bacillus, Pseudomonas and Proteus. Identification was carried out by morphological and biochemical characterization of petroleum hydrocarbon utilizers following the methods of Buchanan and Gibbons (1974). Pure culture of one of the isolates (Bacillus subtilis) was sub-cultured and kept viable in nutrient broth. Thirty milliliters (9E+04CFU/ml or 1.35E+02CFU/g) of the broth were inoculated on the surface of microcosm 4 (T4) and mixed.
All the microcosms were mixed twice every week for aeration for the six weeks. After mixing, these microcosms were kept away from sunlight at room temperature in order to prevent rate of dehydration. Also, the moisture content level of all the treatments were kept between 10-20 of the microcosm.
Methods
The physical-chemical characteristics of the soil such as the texture, water absorption capacity, porosity, pH, temperature, particle density, bulk density, total organic content (TOC) and the chemical composition were carried out by methods as described by Abdulsalam (2006). In addition, soil nitrogen, and moisture content were determined using the Kjeldahl and ASTM D2216 standard test method. The metal contents were determined by digesting the soil in sulphuric acid and hydrochloric acid, then measuring their concentrations using the Atomic Absorption Spectrophotometer.
Total petroleum hydrocarbon (TPH)
The TPH was carried out using the gravimetric method as described below; 5g of each treatment was weighed and transferred into a test tube in which 5ml of chloroform (CCl4) was added. The mixture was shaken vigorously for 5minutes. After settling, the liquid phase was decanted into a pre-weighed 50ml beaker. This procedure was repeated three times to bring the total volume to 20ml, which was evaporated on a heating mantle. The residue was allowed to cool and weighed. Results obtained were presented in mg/kg or ppm as follow:
×
=
610
)
(
taken
sample
of
weight
sample
in
oil
of
weight
ppm
TPH
(1)
Total Bacterial Counts
The total bacterial counts for the treatments were carried out in representative soil composite samples using the standard serial dilution and nutrient agar-plate counting techniques (Lorch et al., 1995). The pH, temperature, moisture content, total petroleum hydrocarbon (TPH) and total bacteria count (TBC) were monitored on weekly basis for all the treatments. In addition, the metal contents in each treatment were analyzed before and after the remediation processes.
RESULTS AND DISCUSSION
The results of the physico-chemical characteristics are presented in Table 2.
Table 2 - Physico-Chemical Characteristics of Soil Sample.
Parameter Value/type
Soil texture Loamy sand
Soil pH 6.02
Particle density (g/cm3) 2.60
Bulk density (g/cm3) 1.75
Soil porosity (%) 32.69
Soil moisture content (%) 1.37
TOC (%) 3.00
Water Absorption Capacity (%) 25.28
From the results as presented in Table 2, the soil texture was found to be Loamy sand by employing the ASTM soil classification triangle. This soil type is consistent for effective bioremediation because of its low clay and silt contents. The soil pH was also within the acceptable limit of 5.5-8.5. The high value of soil porosity was also, advantageous because of ease of oxygen, water
flow and nutrient supply to the soil matrix (Less and Senior, 1995).
On the other hand, the soil moisture content and soil nutrient (such as nitrogen) need to be augmented. These factors are limiting factors for the effective bioremediation (Chambers et al., 1991). Low moisture content gave rise to high water absorption capacity.
23 24 25 26 27 28 29 30
1 2 3 4 5 6
Bioremediation Time (week)
T
e
m
p
e
ra
tu
re
(
o
C
)
T1 T2 T3 T4
Figure 1 - Variation of temperature with bioremediation time.
Experimental Analysis
Temperature variation with bioremediation time
From the results as shown in Figure 1, the temperature variations for all the treatment options ranged from 25 to 29oC. This temperature range fell within the optimum required for effective bioremediation process (Irvine and Frost, 2003). The temperature variation with bioremediation time did not follow a definite pattern with time, which varied generally with the control (T1) showing the most variation.
pH variation with bioremediation time
Figure 2 shows the variations of pH with bioremediation time. The pH for all the treatment options ranged between 5.5 and 7.5. This pH range fell within the optimum required for the effective bioremediation process (Vidali, 2001; Irvine and Frost, 2003). The variation of pH with bioremediation time for all the treatments also differed.
Variation of TPH with bioremediation time
Figure 3 showed that, the concentration or TPH of the four treatments had a decreasing trend with increasing bioremediation time, which was consistent with the general degradation principle. The control (T1) showed the lowest TPH removal of 43.2±1.5% while treatment option 3 (T3)
showed the highest TPH removal rate of 69.2±0.05%. The TPH removal rates of T2 (58.4±0.5%), T3 (69.2±0.05%) and T4 (65.2±0.25%) were higher than that of the control (T1); indicating that biodegradation actually took place. In addition, the effect of moisture content on biodegradation of used motor oil was manifested by the high TPH removal rate of T2 than T1.
Treatments T1 to T4 showed no degradation in the first week. This could be the initial lag period where the microbes acclimatized to their new environment. The control (T1) showed no degradation for the first three weeks of bioremediation process, though 4.45% TPH removal was noticed after the fourth week. A drastic removal of TPH of 39.51% was observed between weeks 4 and 5 for T1. This could neither be linked to the volatilization because of the high molecular weight of lube oil nor leaching, as the wooden box was lined with polyethylene. This could rather be attributed to the initial moisture used in the emulsification of soil/oil interface during the contamination stage and the favorable environmental conditions (i.e. temperature of 28.73oC and pH of 7.19) in week 5 than for other treatment options.
to high food for microorganisms or the phase of exponential growth. Between weeks 4 and 6, the TPH removal rate was very slow, indicating the end of bioremediation process. This could be attributed to the depletion of nutrient in the process. The profile for T4 followed similar pattern as that of T3, which during the last three
weeks showed a slower TPH removal rate.
Treatment 3 (T3) showed the best TPH removal rate and the removal rate fell within the limit of 30-75% reported by Chaineau et al (2002). Hence, the biostimulation option (T3) gave the best result in this study, followed by the hybrid of biostimulation and bioaugmentation (T4).
5.5 6 6.5 7 7.5 8
1 2 3 4 5 6
Bioremediation Time (week)
p
H
T1 T2 T3 T4
Figure 2 - Variation of pH with bioremediation time.
0 5000 10000 15000 20000 25000 30000 35000 40000 45000
1 2 3 4 5 6
Bioremediation Time (week)
T
P
H
(
p
p
m
)
T1 T2 T3 T4
Figure 3 - Variation of total petroleum hydrocarbon with bioremediation time.
-2 -1 0 1 2 3 4 5 6 7 8
0 1 2 3 4 5 6 7
Bioremediation time (week)
In
(x
/x
o
)
T1 T2 T3 T4
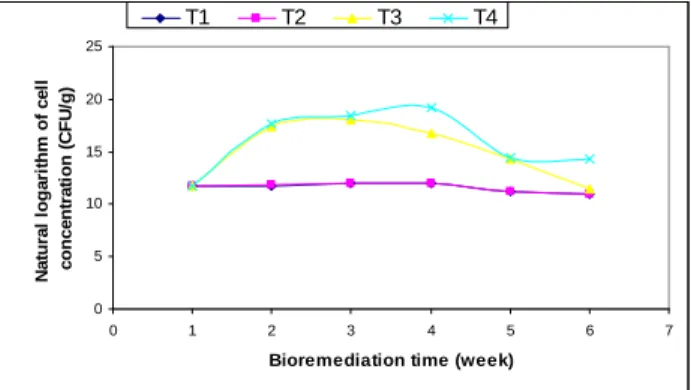
Variation of microbial growth with bioremediation time
Microorganisms play a major role in bioremediation and their absolute number can determine the overall degradative ability (Adeyinka and Urum, 2001). Results as depicted in Figure 4 showed that the profiles for the four microcosms T1, T2, T3 and T4 followed a typical microbial growth pattern. From these plots, microcosms T2, T3 and T4 showed a lag phase of one week while microcosm T1 showed a lag phase of three weeks. These lag phases were the periods the microbes used to adjust to their new environment.
After the one-week lag phase for microcosm T3, the rapid growth of the microbes between weeks 1 and 3, resulted in rapid degradation of the hydrocarbon contaminant by 63.1%, followed by a reduction in the rate of removal of total petroleum hydrocarbon between week 3 and 6. In week 6, the concentration of the microorganisms fell below the initial concentration of the indigenous microorganisms indicating the end of bioremediation process. This could be attributed to the depletion of nutrient and environmental stresses caused by the total hydrocarbon and/or the death of the indigenous microorganisms (Brock et al, 1984).
Microcosm T4 profile followed the same pattern as that of T3, but the period of exponential growth was extended to the fourth week before decline in concentration started. Although, the concentration of microbes did not fall below the initial amount but between weeks 5 and 6, their concentration
was constant, which could also be attributed to depletion of nutrient supplement in the microcosm. Despite of more rapid microbial growth in microcosm T4 than microcosm T3, the hydrocarbon removal rate (i.e. 59.8%) was lower compared to microcosm T3. This could perhaps be attributed to competition for the use of the nutrient supplement between the indigenous and exogenous microbes.
On the other hand, the growth rates of microbes in microcosms T1 and T2 were very low compared to microcosms T3 and T4, which clearly revealed the importance of biostimulation and bioaugmentation. Therefore, the low rate of proliferation of microbes in these microcosms resulted in low removal rate of hydrocarbon contaminant. In addition, between weeks 4 and 6, the concentrations of microbes in these microcosms fell below their initial value, indicating the end of bioremediation processes due to death of microorganisms.
The biostimulation option (T3) proved to enhance
better degradation than
biostimulation/bioaugmentation option (T4). The low degradation rate of T4 could be attributed to the competition for the use of nutrients between the indigenous and exogenous microorganisms. Therefore, T3 was the best in cleaning of used motor oil contaminated soil artificially contaminated. This was in line with the idea that the indigenous microbes at the site would take care of the pollution and that what was necessary was the addition of nutrients to speed up the growth of indigenous microbial population (Http. 3).
0 5 10 15 20 25
0 1 2 3 4 5 6 7
Bioremediation time (week)
N
a
tu
ra
l
lo
g
a
ri
th
m
o
f
c
e
ll
c
o
n
c
e
n
tr
a
ti
o
n
(
C
F
U
/g
)
T1 T2 T3 T4
Figure 5 shows more clearly the bioremediation of all the treatment options. The profiles followed similar pattern as showed in Figure 4.
Metal Contents
The concentrations of metal content before and after bioremediation processes are presented in Table 3. The total metal content before bioremediation processes was 120.69±5.0ppm, which was less than the maximum limit of 700ppm required for effective bioremediation (Vidali, 2001).
Thus, treatment 3 (T3) had the highest percentage decrease in metal content of 2.172%, followed by T1 and T4 with 2.03 and 0.203%, respectively. The increase in the metal content observed in T2 could probably be attributed to intrusion of Ca2+ and Mg2+ through the addition of water as indicated by high values of Ca2+ and Mg2+ for T2 than their respective initial values (Table 3).
Therefore, T3 remained the best treatment option offering the best metal removal and minimum deviation from its mean value.
Modeling of TPH variation with time for microcosm T3
In terms of modeling of variation of TPH of used motor oil contaminated soil with time, a simple power law function represented by equation (2) was found to fit adequately the data collected for microcosm T3:
701 . 0
41323
−=
t
TPH
(2)
where: TPH is the TPH concentration in ppm and t is the time in weeks. The correlation coefficient R2 was found to be 0.9874. Figure 6 shows the comparison between the experimental and the fitted data.
0 5000 10000 15000 20000 25000 30000 35000 40000 45000
0 1 2 3 4 5 6 7
Bioremediation time (week)
T
P
H
(
p
p
m
)
experimental computational
Figure 6 - Variation of TPH with Bioremediation Time for Microcosm T3.
Table 3 - Initial and Residual Metal Contents for Various Treatment Option after Six Weeks.
Data presented are mean values of triplicate determinations; ±Standard deviation.
In conclusion, bioremediation of used motor oil was successful in all the treatments. However, the biostimulation option gave the highest hydrocarbon removal rate of 69.2±0.05%, followed by the hybrid of biostimulation and
bioaugmentation with hydrocarbon removal rate of 65.2±0.25%. The water amended and control gave hydrocarbon removal rates of 58.4±0.5 and 43.2±1.5%, respectively. The hydrocarbon removal rates could be improved by addition of
Metal Content (ppm) Treatments
Zn2+ Ca2+ Mg2+ Mn2+ Fe2+ Total
Initial 0.9821 7.9222 6.8521 4.6784 100.2526 120.69±5.0
T1 0.5416 7.9563 7.3850 3.7674 98.5874 118.24±3.5
T2 0.9314 8.3309 7.5703 4.1798 101.235 122.25±3.2
T3 0.8518 8.6708 7.1462 3.5388 97.8589 118.06±2.1
nutrients since end of bioremediation for the best treatment could be attributed to the depletion of nutrient supplement and by conducting the experiment for a longer period.
In addition, biostimulation option had the highest metal removal rate of 2.172% and biostimulation/bioaugmentation option had the least total metal removal rate of 0.203%. Therefore, the biostimulation option was the best in this study. Thus, it could be used for rehabilitation of used motor oil contaminated soil at commercial level. Also, the variation of TPH with bioremediation time for T3 was found to fit adequately a simple power law function.
ACKNOWLEGEMENT
We wish to thank Mr. Uzah Umar and the National Vetnary Research Institute Vom, Plateau State, Nigeria for assisting us in bacterial identification and analyses.
RESUMO
O presente estudo trata da biorremediação usando-se solo contaminado artificialmente com óleo de motor a um nível de poluente de 40.000 ppm usando técnicas de remediação por bioestimulação e por bioagumentação durante 42 dias. Quatro opções de tratamento foram investigadas no microcosmo de madeira: Controle (T1), água alterada (T2), bioestimulação (T3) e híbrido de bioestimulação e bioaugmentação (T4). A eficácia dos processos de biorremediação foram monitoradas usando a remoção de hidrocarbonetos totais petróleo (TPH) e contagem bacteriana total (TBC). T3 teve a maior taxa de remoção de TPH (69,2 ± 0,05%), seguido por T4 (65,2 ± 0,25%) e T2 (58,4 ± 0,5%); o controle (T1) apresentou a menor taxa de remoção de TPH (43,2 ± 1,5%). TBC revelou que a biorremediação efectivamente ocorreu; T4 teve o maior crescimento de bactérias 9,6E+07CFU/g, seguido pelo T3 (7.2E+07CFU/g), T2 (1.7E+05CFU/g) e T1 (1.65E+05CFU/g). Além disso, T3 apresentou a maior taxa de remoção metal (2,172%) e T4 teve a mais baixa taxa de remoção metal (0,203%).
REFERENCES
Abdulsalam, S. (2006), Preliminary studies on bioremediation of used motor oil contaminated soil, PhD progress report submitted to the Department of Chemical Engineering, Ahmadu Bello University, Zaria.
Adeyinka, J. S. and Urum, K.C.N. (2001), Assessment and determination of bioremediation efficiency in a post crude oil pollution treatment, Trop. Environ. Res.3, 181-187.
Brock, T. D., Smith, D.W. and Madigan, M. T. (1984), Biology of Microorganisms, 4th edition, Prentice-Hall, Inc, Englewood Cliffs, N. J.
Buchanan, R. E. and Gibbons, N. E. (1974), Bergey’s Manual of determinative Bacteriology, 8th edition (ed.) R. E. Buchanan and Gibbons, N. E. The Williams and Wilkins Company, Baltimore. ISBN-068301117-0.
Chaineau, C., Setier, J. and Morillon, A. (2002), Is bioremediation a solution for the treatment of oily waste? Society of Petroleum Engineers Inc. SPE78548, pp. 1-10.
Chambers, D. C., Willis, J., Giti-Pour, S., Zieleniewiski, L. J., Rickabaugh, J. F., Mecca, M. I., Pasin, B., Sims, C. R., Sorensen, L. D., Sims, L. J., Mclean, E. J., Mahmood, R., Dupont, R. R. and Wagner, K. (1991), In-situ Treatment of Hazardous Waste Contaminated Soils, 2nd edition, Noyes Data Corporation New Jersey, U.S.A, pp. 7, 44-64, and 176-209 and 299-327
Irvine, D. A., and Frost, H. L. (2003), Bioremediation of soils contaminated with industrial wastes: a report on the state-of-the-art in bioremediation, SBR Technologies Inc.
Less, Z. M. and Senior, E. (1995), Bioremediation. A Practical Solution to Land Pollution: In Clean Technology and the Environment, Chapman and Hall, New York pp 121-146
Lorch, H. J., Benckieser, G., and Ottow, J. C. G. (1995), Basic methods for counting microorganisms in soil and water. In: Alef, K., Nanniieri, P. (Eds.), Methods in Applied Soil Microbiology and Biochemistry, Academic Press, New York, pp. 146-161.
Vidali, M. (2001), Bioremediation: An overview,
Journal of Applied Chemistry, 73 (7), 1163-1172
http://www.euopa.eu.int/comm/environment/waste/oil-index.htm. Access on: 28th December, 2005
http://www.deq.state.ms.us/MDEQ.nsf/page/Recycle-Used motor oil. Access on: 28th December, 2005 http://www.obio.com/bioaugmentation.htm. Accesse
on: 28th December, 2005.