Crop Breeding and Applied Biotechnology 12: 206-210, 2012 Brazilian Society of Plant Breeding. Printed in Brazil
Contribution of components of production on snap bean yield
Lanusse Cordeiro de Araújo1, Geraldo de Amaral Gravina1, Caillet Dornelles Marinho2*, Sebastião Ney Costa de Almeida1,
Rogério Figueiredo Daher1 and Antônio Teixeira do Amaral Júnior3
Received 28 October 2011 Accepted 20 April 2012
Abstract - Aiming to estimate the path coefficients among morphological traits and effects of production components on the yield of
grains and pods, thirty snap bean genotypes (27 lines and three commercial controls) were evaluated in Bom Jesus of Itabapoana-RJ. The experiments were carried out in a randomized block design, with four replications, from May to June, in 2009 and 2010. Eight traits were evaluated and the number of pods per plant, associated with high genetic correlation, is the character with the most significant direct effect on productivity. There is a high rate of genotypic association between the yields of pods and grains, as well as direct effects of high magnitude and positive signal between them, indicating that the selection for increased pod yield allows increased grain yield.
Key words: Phaseolus vulgaris L., genetic correlation, phenotypic correlation, path analysis.
1 Universidade Estadual do Norte Fluminense Darcy Ribeiro (UENF), Centro de Ciências e Tecnologias Agropecuárias, Laboratório de Engenharia Agrícola, Av. Alberto Lamego, 200, Campos dos Goytacazes, 28.013-602, RJ, Brazil
2 Universidade Federal de Viçosa (UFV), Centro de Ciências Exatas, Departamento de Estatística, Av. PH Rolfs, s/n, Viçosa, 36.570-000, MG, Brazil. *E-mail: caillet. [email protected]
3 UENF, Centro de Ciências e Tecnologias Agropecuárias, Laboratório de Melhoramento Genético Vegetal
INTRODUCTION
Snap bean cultivation is a very important socio-economic activity in regions where vegetables have been traditionally
grown. It is a good alternative for crop diversification, mainly
when used in rotation with tomato crop, since, under these conditions, the tutoring structure can be used, as well as the residues of high fertilizer doses required by tomato crop. In addition, snap bean is grown mainly by small farmers, uses
family labor and contributes to increased income, diversifica -tion and the maintenance of these families in the countryside. Traditionally, little attention has been devoted to snap bean breeding in Brazil, mainly because it is a culture whose seeds are always kept by producers as they reuse their own seeds or seeds from neighbors (Mariguele et al. 2008, Cabralet al. 2011). In the Brazilian market, the private sector has dominated the development of vegetable cultivars (Marinho et al. 2011). However, few commercial cultivars of snap bean have been available by private companies. Thus, the indication of suit-able snap bean cultivars to farmers depends on public breeding programs, which are scarce in Brazil (Oliveira et al. 2006, Mariguele et al. 2008, Vilela et al. 2009, Cabral et al. 2011).
It is necessary to know and explore the variability pres-ent in the accessions available in either germplasm banks or commercial materials to ensure the success of genetic breeding programs for this culture. Knowledge about the variability of traits of economic importance and their as-sociations is very important for the selection of breeding techniques and the achievement of information on adapt-ability and productivity in various regions (Vieira et al. 2007, Cabral et al. 2011).
The study on the correlations among characters is not conclusive about cause and effect relations (Gonçalves et al. 2003). Therefore, when there are many explanatory variables and a basic or dependent variable, it is necessary to use analyses that consider the correlations among the explanatory variables, such as the path analysis.
Considering the path analysis for yield and related com-ponents, Hoogerheide et al. (2007) reported that knowledge on the degree of this association achieved by correlation
studies, allows the identification of characters that can be
used as criteria for indirect selection for productivity in breeding programs.
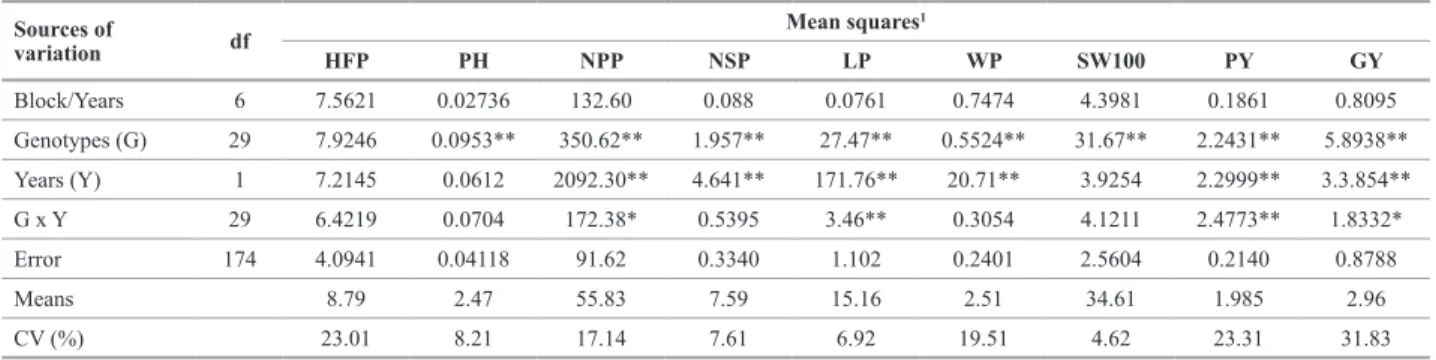
Table 1. Values and significances of the mean squares (MS) and percentage coefficients of the experimental variation, based on the mean of the treat -ments for nine traits, evaluated in two years in snap bean inbred lines
Sources of
variation df
Mean squares1
HFP PH NPP NSP LP WP SW100 PY GY
Block/Years 6 7.5621 0.02736 132.60 0.088 0.0761 0.7474 4.3981 0.1861 0.8095
Genotypes (G) 29 7.9246 0.0953** 350.62** 1.957** 27.47** 0.5524** 31.67** 2.2431** 5.8938**
Years (Y) 1 7.2145 0.0612 2092.30** 4.641** 171.76** 20.71** 3.9254 2.2999** 3.3.854**
G x Y 29 6.4219 0.0704 172.38* 0.5395 3.46** 0.3054 4.1211 2.4773** 1.8332*
Error 174 4.0941 0.04118 91.62 0.3340 1.102 0.2401 2.5604 0.2140 0.8788
Means 8.79 2.47 55.83 7.59 15.16 2.51 34.61 1.985 2.96
CV (%) 23.01 8.21 17.14 7.61 6.92 19.51 4.62 23.31 31.83
1 HFP = height of first pod; PH = plant height; NPP = number of pods per plant; NSP = average number of seeds per pod; LP = average length of pods; WP = average weight of pods; SW100 = 100 seed weight; PY = pod yield; and GY = grain yield.
**, * Significant in level of 0.01 and 0.05 of probability, respectively, by the F test.
This study aimed to assess, by genotypic correlation, the direct and indirect relationship between the yield of pods and of grains of snap bean, with its primary components, to assist in the selection of promising lines for the production of pods and grains (where applicable).
MATERIAL AND METHODS
The experiments were installed in the experimental field of
the IFF - Instituto Federal Fluminense, Bom Jesus do Itabapoana campus, Rio de Janeiro state, in the crop years 2009 and 2010, comprising 30 genotypes of snap bean of indeterminate growth habit. Out of these, 27 lines are at an advanced stage (genera-tions F8 and F9) of the breeding program of the Universidade Estadual do Norte Fluminense – UENF and three commercial materials are used as controls in the experiment. The experi-ment was arranged in a completely randomized block design with four replications. The experimental plot consisted of 12 plants, with a 1.0 x 0.5 m spacing. Ten individual plants from each plot were assessed and one plant was left at each end as borderline. The experiments were assessed from May to Au-gust in 2009 and 2010. Plants were tutored with bamboo and wire and the cultural treatments were performed according to recommendations of Filgueira (2000). Phytosanitary control and sprinkler irrigation were carried out when necessary.
The following traits were assessed: 1) height of first pod
(HFP), 2) plant height (PH), by measuring the distance from the stem of each plant to the end of the main stem, on the day
of the harvest, in cm; 3) number of pods per plant (NPP); 4)
average number of seeds per pod (NSP), obtained by counting
the number of seeds in a sample of 10 pods of each plant;
5) average length of the pod (LP), in cm, obtained by the
quantification of the longitudinal length of the sample of 10 pods per plant; 6) average weight of pods (WP), obtained by
the ratio between the total weight of pods and the number of
plants, expressed in g; 7) 100 seed weight (SW100), expressed
in g; 8) podyield (PY) expressed in kg.ha-1 of fresh pods,
obtained by weighing the fresh pods after each harvest in
each plot, and estimating productivity for 1 h; 9) grain yield
(GY), expressed in kg ha-1 of dry grains with 13% humidity,
obtained by weighing the grains produced by the plot and estimated for the area of 1 ha. The genetic-statistical analyses were performed with the Genes software (Cruz 2006). RESULTS AND DISCUSSION
In preliminary data analyses, the homogeneity of variance
of the treatments (genotypes) was verified by the Crochran
and Barttlet tests, and for normality, by the Lilliefors test, for both experiments (two years). Then, the analyses of variance
revealed that the effects of genotypes presented significant
variations for the characters assessed in this work. For the purposes of the correlation and path analyses, the data from both environments (two years, 2009 and 2010) were assessed together, since, according to the results of the individual analysis of variance, the residual variances of the two experi-ments were considered homogeneous, and the ratio between the highest and lowest mean square of the residue was lower than 7, according to the criterion established by Pimentel
Gomes (2000). The low influence of the environment on the
expression of the characters is probably due to the fact that the experiments were installed at the same season of year (from May to August, in 2009 and 2010).
There were significant differences (p < 0.01) in all traits we evaluated, except to height of first pod (HFP), indicating the
existence of genetic variability between genotypes (Table 1).
Concerning the years, there were significant differences (p <
0.01) for number of pods per plant (NPP), average number of seeds per pod (NSP), average length of the pod (LP), average
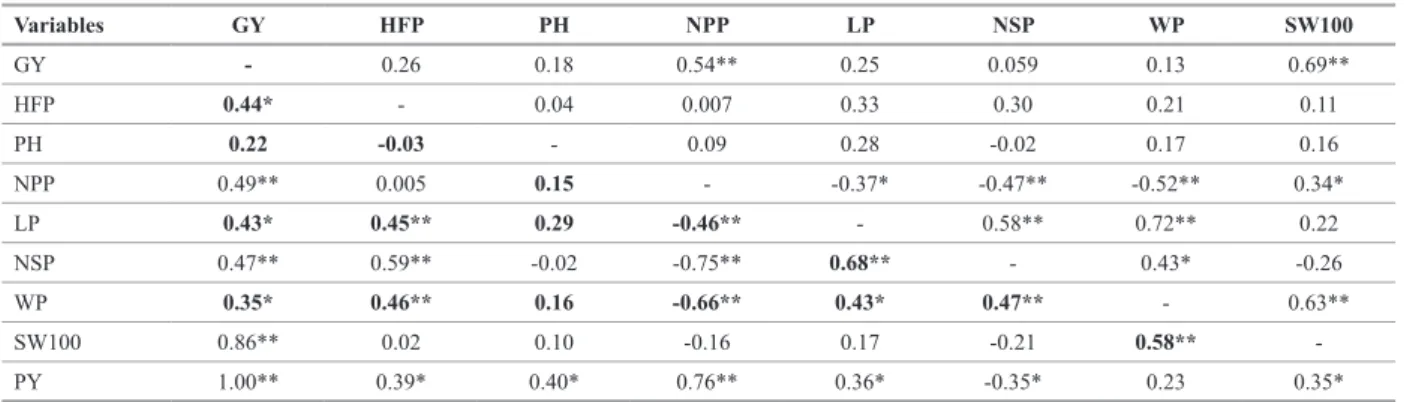
Table 2. Estimates of the phenotypic correlation coefficients and genotypic correlation (bold) among nine agronomic characters evaluated in snap bean
Variables GY HFP PH NPP LP NSP WP SW100
GY - 0.26 0.18 0.54** 0.25 0.059 0.13 0.69**
HFP 0.44* - 0.04 0.007 0.33 0.30 0.21 0.11
PH 0.22 -0.03 - 0.09 0.28 -0.02 0.17 0.16
NPP 0.49** 0.005 0.15 - -0.37* -0.47** -0.52** 0.34*
LP 0.43* 0.45** 0.29 -0.46** - 0.58** 0.72** 0.22
NSP 0.47** 0.59** -0.02 -0.75** 0.68** - 0.43* -0.26
WP 0.35* 0.46** 0.16 -0.66** 0.43* 0.47** - 0.63**
SW100 0.86** 0.02 0.10 -0.16 0.17 -0.21 0.58**
-PY 1.00** 0.39* 0.40* 0.76** 0.36* -0.35* 0.23 0.35*
*, ** Significant at 1% and 5% probability, respectively, by the t test. PY and GY= yields of pods and grains, expressed in kg ha-1; HFP = height of first pod insertion (cm); PH = plant height (m); NPP = number of pods per plant; LP = average length of pods (cm); NSP = average number of seeds per pod; WP = average pod weight (g); SW100 = 100 seed weight (g).
at p < 0.05, while LP and PY, significant differences occurred at p < 0.01. For the others traits, GxY was not significant. The occurrence of significant GxY indicates a genotypic dif -ferential response to changes in the environment. Therefore, the behavior of genotypes was differentiated front the two crop years, for the most important traits (PY and GY).
Furthermore, a diagnosis of multicollinearity was per-formed and a degree of low severity was observed, which was less than 100, according to the criteria of Montgomery and Peck, corroborated by Cruz and Carneiro (2003). For Carvalho et al. (1999), this study is important for regres-sion and path analyses and selection indices. Cruz and Carneiro (2003) report that the estimates of the parameters under multicollinearity can lead to unstable estimates of the
regression coefficients and the overestimation of the direct
effects of the explanatory variables on the main variable, which may lead to erroneous results.
The coefficient of determination reveals that 95% of pod
yield and 80% of grain yield can be explained by the effect of the variables analyzed. It is important to highlight that this value is restricted to the characters under analysis, since productivity is a quantitative character, with a large number of alleles of small effect that affect the main character.
The significant phenotypic and genotypic correlations
were found in several pairs of characters (Table 2). The dif-ferences between the phenotypic and genotypic correlations for most traits studied are low. This demonstrates the low magnitude of the environmental correlations and the little effect that the environment has on the variation of characters.
The phenotypic correlation measures the degree of as-sociation of two characters from environmental and genetic effects. The latter effect is the main responsible for the heritable fraction from parents to progenies. Considering than the most important traits for this crop are pod yield and grain yield,
in the present work will be discussed only coefficients of
genotypic correlations involving these traits with the others,
emphasizing only the major correlations. These values were obtained from the following variables: pod yield and grain yield (1.0), grain yield and 100 seed weight (0.86), pod yield and number of pods per plant (0.76), grain yield and number
of pods per plant (0.49). The variables NPP, SW100, LP and HFP correlated positively and significantly with the yields of
pods and grains, while the variable PH correlated only with
PY. The variable WP correlated only with grain yield and the
variable NSP alone correlated negatively with pod yield, but positively with grain yield. This discrepancy in magnitude and direction of the estimated parameters demonstrates that the causes of genetic and environmental variation affected this character by means of different physiological mechanisms, ac-cording to reasoning reported by Falconer and Mackay (1996). Several works on bean crop found that the number of pods per plant is the character that contributes most to grain yield of common bean, since it presents the highest correlations with grain yield (Lana et al. 2003, Cabral et al. 2011). In this study, this component correlated positively and
significantly with grain yield and pod yield. Moreover, this
character presented the highest direct effect on pod yield,
highlighting its potential for selection and identification of
superior genotypes for pod yield in snap beans.
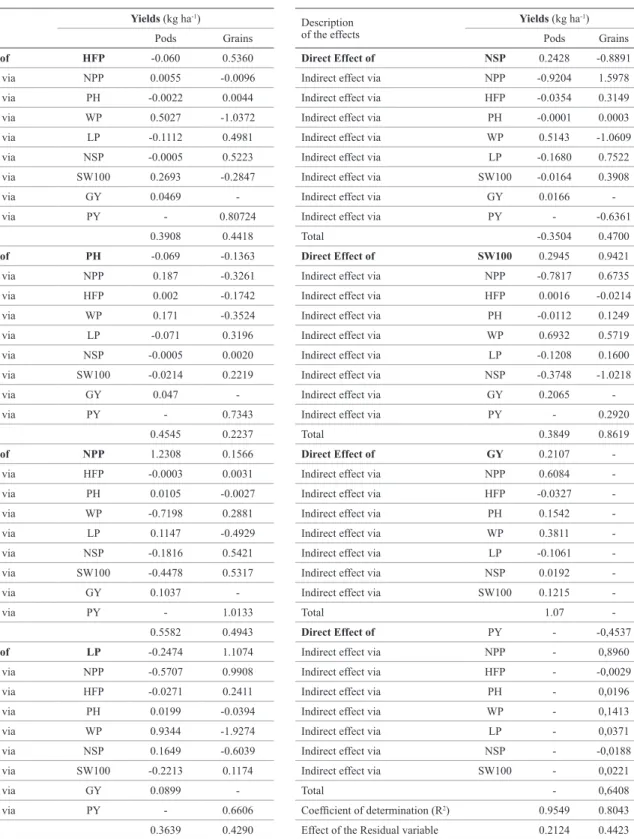
Table 3 indicates that there is a system of inter-relation-ships between the characters under study and that a certain variable might affect yield (of grains or pods) through another correlated trait, characterizing indirect effects of the character analyzed on productivity.
Table 3. Estimate of direct and indirect genotypic effects of the components of production on the yield of pods and grains, for snap bean crop, in two crop years (2009 and 2010)
Description of the effects
Yields (kg ha-1)
Description of the effects
Yields (kg ha-1)
Pods Grains Pods Grains
Direct Effect of HFP -0.060 0.5360 Direct Effect of NSP 0.2428 -0.8891
Indirect effect via NPP 0.0055 -0.0096 Indirect effect via NPP -0.9204 1.5978
Indirect effect via PH -0.0022 0.0044 Indirect effect via HFP -0.0354 0.3149
Indirect effect via WP 0.5027 -1.0372 Indirect effect via PH -0.0001 0.0003
Indirect effect via LP -0.1112 0.4981 Indirect effect via WP 0.5143 -1.0609
Indirect effect via NSP -0.0005 0.5223 Indirect effect via LP -0.1680 0.7522
Indirect effect via SW100 0.2693 -0.2847 Indirect effect via SW100 -0.0164 0.3908
Indirect effect via GY 0.0469 - Indirect effect via GY 0.0166
-Indirect effect via PY - 0.80724 Indirect effect via PY - -0.6361
Total 0.3908 0.4418 Total -0.3504 0.4700
Direct Effect of PH -0.069 -0.1363 Direct Effect of SW100 0.2945 0.9421
Indirect effect via NPP 0.187 -0.3261 Indirect effect via NPP -0.7817 0.6735
Indirect effect via HFP 0.002 -0.1742 Indirect effect via HFP 0.0016 -0.0214
Indirect effect via WP 0.171 -0.3524 Indirect effect via PH -0.0112 0.1249
Indirect effect via LP -0.071 0.3196 Indirect effect via WP 0.6932 0.5719
Indirect effect via NSP -0.0005 0.0020 Indirect effect via LP -0.1208 0.1600
Indirect effect via SW100 -0.0214 0.2219 Indirect effect via NSP -0.3748 -1.0218
Indirect effect via GY 0.047 - Indirect effect via GY 0.2065
-Indirect effect via PY - 0.7343 Indirect effect via PY - 0.2920
Total 0.4545 0.2237 Total 0.3849 0.8619
Direct Effect of NPP 1.2308 0.1566 Direct Effect of GY 0.2107
-Indirect effect via HFP -0.0003 0.0031 Indirect effect via NPP 0.6084
-Indirect effect via PH 0.0105 -0.0027 Indirect effect via HFP -0.0327
-Indirect effect via WP -0.7198 0.2881 Indirect effect via PH 0.1542
-Indirect effect via LP 0.1147 -0.4929 Indirect effect via WP 0.3811
-Indirect effect via NSP -0.1816 0.5421 Indirect effect via LP -0.1061
-Indirect effect via SW100 -0.4478 0.5317 Indirect effect via NSP 0.0192
-Indirect effect via GY 0.1037 - Indirect effect via SW100 0.1215
-Indirect effect via PY - 1.0133 Total 1.07
-Total 0.5582 0.4943 Direct Effect of PY - -0,4537
Direct Effect of LP -0.2474 1.1074 Indirect effect via NPP - 0,8960
Indirect effect via NPP -0.5707 0.9908 Indirect effect via HFP - -0,0029
Indirect effect via HFP -0.0271 0.2411 Indirect effect via PH - 0,0196
Indirect effect via PH 0.0199 -0.0394 Indirect effect via WP - 0,1413
Indirect effect via WP 0.9344 -1.9274 Indirect effect via LP - 0,0371
Indirect effect via NSP 0.1649 -0.6039 Indirect effect via NSP - -0,0188
Indirect effect via SW100 -0.2213 0.1174 Indirect effect via SW100 - 0,0221
Indirect effect via GY 0.0899 - Total - 0,6408
Indirect effect via PY - 0.6606 Coefficient of determination (R2) 0.9549 0.8043
Total 0.3639 0.4290 Effect of the Residual variable 0.2124 0.4423
REFERENCES
Cabral PDS, Soares TCB, Lima ABP, Soares YJB and Silva JA (2011) Análise de trilha do rendimento de grãos de feijoeiro (Phaseolus
vulgaris L.) e seus componentes. Revista Ciência Agronômica 42:
132-138.
Carvalho CGP, Oliveira VR, Cruz CD and Casali VWD (1999) Análise de
trilha sob multicolinearidade em pimentão. Pesquisa Agropecuária Brasileira 34: 603-613.
Cruz CD and Carneiro PCS (2003) Modelos biométricos aplicados ao melhoramento genético.Editora UFV,Viçosa, 585p.
Cruz CD (2006) Programa Genes: biometria. Editora UFV, Viçosa, 382p.
Falconer DS and Mackay TFC (1996) Introduction to quantitative genetics. 4th ed., Pearson Education, Harlow, 464p.
Filgueira FAR (2000) Novo manual de olericultura: agrotecnologia moderna na produção e comercialização de hortaliças. Editora UFV, Viçosa, 402p.
Gonçalves MC, Correa AM, Destro D, Souza LCF and Sobrinho TA (2003) Correlations and path analysis of common bean grain yield and its primary components. Crop Breeding and Applied Biotecnology 3: 217-222.
Hoogerheide ESS, Vencovsky R, Farias FJC, Freire EC and Arantes EM (2007) Correlações e análise de trilha de caracteres tecnológicos e a
produtividade de fibra de algodão. Pesquisa Agropecuária Brasileira
42: 1401-1405.
Lana AMQ, Cardoso AA and Cruz CD (2003) Herdabilidade e correlações entre caracteres de linhagens de feijão obtidas em monocultivo e em consórcio com milho. Ciência Rural 33: 1031-1037.
Mariguele KH, Maluf WR, Gomes LAA, Lopes MJC and Melo OD (2008)
Controle genético da qualidade da vagem em cruzamento de feijão-vagem e feijão comum. Pesquisa Agropecuária. Brasileira 43: 47-52.
Marinho CD, Martins FJO, Amaral SCS, Amaral Júnior AT, Gonçalves LSA and Mello MP (2011) Revisiting the Brazilian scenario of registry and protection of cultivars: an analysis of the period from 1998 to 2010, its dynamics and legal observations. Genetics and Molecular Research 10: 792-809.
Oliveira NG, De-polli H, Almeida DL and Guerra JGM (2006) Feijão-vagem semeado sobre cobertura viva perene de gramínea e leguminosa em solo mobilizado, com adubação orgânica. Pesquisa Agropecuária Brasileira 41: 1361-1367.
Pimentel Gomes F (2000) Curso de Estatística Experimental. Degaspari, Piracicaba, 477p.
Vieira EA, Carvalho FIF, Oliveira AC, Martins LF, Benin G, Silva JAG, Coimbra J, Martins AF, Carvalho MF and Ribeiro G (2007) Análise de trilha entre os componentes primários e secundários do rendimento de grãos em trigo. Revista Brasileira de Agrociência 13: 169-174.
Vilela FO, Amaral Júnior AT, Freitas Júnior SP, Viana AP, Pereira MG and Morais Silva MG (2009) Selection of snap bean recombined lines by using EGT and SSD. Euphytica 165: 21-26.
Contribuição de componentes de produção no rendimento de feijão-vagem
Resumo – Com o objetivo de estimar os coeficientes de trilha entre os caracteres morfológicos e componentes da produção sobre as produtividades de vagens e de grãos, trinta genótipos de feijão-de-vagem (27 linhagens e três testemunhas comerciais) foram avaliados em Bom Jesus de Itabapoana-RJ. Os experimentos foram implantados em blocos casualizados com quatro repetições, no período de maio a junho, nos anos de 2009 e de 2010. Oito caracteres foram avaliados e o caráter com maior efeito direto sobre a produtividade de vagens foi o número de vagens por planta (NVP), associado à alta correlação genotípica. Existe alto índice de associação genotípica entre as produtividades de vagens e de grãos, bem como efeito direto de alta magnitude e de sinal positivo entre elas, indicando que ao se fazer seleção para o aumento do rendimento de vagens, consequentemente, aumenta-se a produtividade de grãos.
Palavras-chave: Phaseolus vulgaris L., correlação genética, correlação fenotípica, análise de trilha.
for snap bean cultivation, whose commercial products are im-mature pods. However, there were indirect effects of negative signal between NVP and pod yield via PMV.
The most important component associated with grain yield was LP, with direct effect and magnitude of 1.11, followed by
SW100, whose direct effect on productivity was 0.94, and APV,
with 0.54 (Table 3). Similar results were found by Cabral et
al. (2011) for the characters NPP, SW100 and NSP. The other
characters did not directly affect grain yield. However, it is noteworthy that some indirect effects of high magnitude with positive and some negative signals are associated with grain
yield, namely: LP via WP (-1.93); HFP via WP (-1.04); LP
via NPP (0.99); LP via NSP (0.60); and HFP via NSP (0.52).
The results of this study allow us to consider the possible use of indirect selection for pod yield, using the agronomic character number of pods per plant as reference and, for
indirect selection for grain yield, the characters LP, SW100,
HFP and pod yield, considering the latter a primary character for grain yield.
ACKNOWLEDGEMENTS