Universidade Nova de Lisboa
Faculdade de Ciências e Tecnologia
Katholieke Universiteit Leuven
Faculty of Bioscience Engineering
Generic life cycle assessment
of the
Jatropha
biodiesel system
Por
Joana Teresa Gomes Dias Almeida
Dissertação apresentada na Faculdade de Ciências e Tecnologia da Universidade Nova de Lisboa para obtenção do Grau de Mestre em Energia e Bioenergia.
Orientador: prof. Bart Muys Co-orientador: prof. Paula Duarte
ACKNOWLEDGEMENTS
During the first year of my Master in Energy and Bioenergy held in Faculdade de Ciências e Tecnologia of the Universidade Nova de Lisboa, I became aware that bioenergy as we know it now, is as in need of technological optimization as of rightfully assessed sustainability. When deciding on my thesis’ theme, I aimed at combining that awareness with a trendy subject and an abroad academic experience. I fulfilled my will by becoming part of the Division of Forest, Nature and Landscape Research of K.U. Leuven as an exchange student on their work on putting together the puzzle of Jatropha sustainability. The small piece that I hope to have contributed with does not measure up to what I received in return. I was enthusiastic on putting myself into the assignment. Most of all, living in Leuven was an enriching and character defining experience.
Coming from a rather different background, this task would have never been possible for me without inexhaustible guidance and precious input. It helped me to excel my own limitations, set order in my reasoning and overcome the many adversities. For this, I have to thank several academic staff members.
Firs of all, I express my gratitude to Prof. Dr. Ir. Bart Muys for giving me the chance to perform this work and never hesitating with pushing me forward and clarifying my doubts. Antonio Trabucco, Carolin Spirinckx of VITO and Dr. Paula Duarte of FCT-UNL were most helpful with their availability to help and important inputs.
Dr. Raf Aerts, although not being involved in my work, has been a cheering presence. I thank him for being most welcoming and for taking my mind of Jatropha quite often, introducing me to other projects and insights on subjects we share a common interest for. Finally, an enormous thank to Ir. Wouter Achten for being a terrific teammate. Your input in the work was crucial, as well has the uplifting and soothing support in the tricky moments. Working with you has been a great motivation and pleasure for me.
I am grateful to my parents to whom I owe my staying in Leuven (and, after all, my entire academic path). My aunts São and Cacilda, who watched over my home during my absence, played not less important roles.
Alkis, Christian, Luna, Marianna and Marisa: thank you for taking me in your friendship. All the moments, the fun and the caring we built together during the past six months were crucial to my joy and balance. Moreover, they contribute to my will to return and join at least some of you for a while longer!
conclusion of the curricular phase of the Master course. During that time Manuel, Maria, Rita and Rui were a constant presence and turned the campus into a better place.
RESUMO
A espécie Jatropha curcas L. é uma planta selvagem pantropical que recentemente conquistou a atenção de investidores e cientistas enquanto matéria-prima para biodiesel. As opiniões positivas quanto a esta opção são abundantes, mas a falta de input científico extenso e intensivo impede uma avaliação clara de limitações e vantagens e, afinal, da sustentabilidade do sistema de biodiesel da Jatropha. A produção sustentável de energia corresponde a vários critérios e a sua ponderação deve incluir a análise ambiental de ciclo de vida.
Este estudo pretende discernir, de modo genérico, o balanço ambiental, as fases de produção com maior impacto e as opções de produção com menor impacto do sistema de produção de biodiesel a partir de Jatropha. O estudo foi feito com base nas normas ISO14040 a 43. Os dados foram reunidos a partir de literatura e questionários enviados a investidores relevantes. A análise de impacte ambiental recorreu à ferramenta informática SimaPro®, com os métodos IMPACT2002+ e Ecoindicator99.
A base de comparação é o sistema fóssil equivalente. Ambos os métodos apontaram para poupanças nas emissões de gases com efeito-estufa e de clorofluorocarbonetos e eficiência energética melhorada.
Os potenciais de eutrofização e acidificação sofrem um agravamento. Os fertilizantes utilizados no cultivo constituem os principais responsáveis pelos impactes negativos. Os créditos provenientes do uso dos subprodutos dependem da categoria ambiental e do próprio uso. Porém, usar o bagaço das sementes como vector energético confere vantagem ao sistema. Pelo contrário, incluir passos adicionais de transporte na cadeia do biodiesel é desvantajoso.
ABSTRACT
Wild pantropical plant Jatropha curcas L. has conquered the attention of investors and scientists as a biodiesel feedstock. Positive claims towards this option are abundant, but extensive scientific input is lacking for a clear evaluation of shortcomings and advantages and, in all, sustainability of a Jatropha based biodiesel system. Sustainable energy generation answers to several criteria and its pondering ought to include environmental life cycle assessment.
This study aimed at discerning, in a generic way, the environmental balance, most impactful production phases and least impactful production chain options of the Jatropha based biodiesel production system. The task was performed by the ISO14040 to 43 standard guidelines’ framework. Data was gathered from literature and questionnaires submitted to major investors. The impact assessment resourced to the code SimaPro®, adopting IMPACT2002+ and Ecoindicator99 as assessment methods.
The results’ comparison base is the equivalent fossil system. Both indicators point to savings in GHG emissions, better energetic efficiency and less harm to the ozone layer. Eutrophication and acidification potential are aggravated. Main environmental stressor are fertilizers in all cases. Revenues from by product use depend on the environmental category and the use itself. Replacing fossil energy sources with processed seed cake revealed to be of clear advantage. On the contrary, involving more transportation in the biodiesel chain is disadvantageous.
LIST OF ABREVIATIONS
CFC-11 – Trichlorofluoromethane CV – Coefficient of variation
DALY - Disability ajusted life years FU – Functional unit
GHG – Green house gas
GWP – Global warming potential HC – Hydrocarbons
JME – Jatropha methyl-ester LCA – Life cycle assessment LCI – Life cycle inventory
LDPE – Low-density polyethylene LHV – Low heating value
NEG – Net energy gain NER – Net energy ratio
ODP – Ozone depletion potential PDF – Potentially disappeared fraction PM – Particulate matter
TABLE OF CONTENTS
1. Introduction ... 1
1.1. Energy and biodiesel ... 1
1.2. Jatropha curcas L. cultivation and biodiesel production ... 3
1.3. Problem statement ... 7
1.4. Life cycle assessment: state of the art ... 8
1.4.1. Goal and scope definition ... 9
1.4.2. Inventory analysis... 10
1.4.3. Impact assessment and impact categories ... 10
1.4.4. Uncertainty analysis ... 13
1.4.5. Result interpretation ... 13
2. Methodology... 14
2.1. Goal and Scope... 14
2.1.1. Goal definition... 14
2.1.2. System function and functional unit... 14
2.1.3. System Boundaries and allocation... 14
2.1.4. Plantation model and scenarios ... 18
2.1.5. Data quality requirements, assumptions and limitations ... 19
2.1.6. Environmental impact categories and impact assessment methods ... 19
2.2. Inventory analysis... 22
2.2.1. Data collection... 22
2.2.2. Data treatment... 22
2.2.3. Scenarios... 32
3. Results ... 37
3.1. Goal and Scope... 37
3.2. System funcion and functional unit ... 37
3.3. System boundaries... 37
3.4. Life cycle inventory... 37
3.4.1. Base scenario ... 38
3.4.2. Scenarios... 41
3.5. Impact assessment ... 42
3.5.1. IMPACT2002+... 43
3.5.2. Ecoindicator 99... 52
3.5.3. Energy efficiency... 56
3.5.4. Uncertainty analysis ... 58
4. Discussion... 61
4.1. Methodology... 61
4.2. Life cycle impact assessment results ... 63
T
ABLE OF FIGURESFigure 1 – General equation of the transesterification of tryglicerides (source: Meher
et al., 2006)... 2
Figure 2 – Average impact of the vegetable oil based biodiesel in exhaust emissions for NOx, particulate matter (PM), CO and hydrocarbons (HC) (source: Dermibas, 2007)... 2
Figure 3 – Left: J. curcas tree (source: worldisgreen.com). Right: details of Jatropha plant – branch, leaf and fruits (source: carboncapture.us) ... 4
Figure 4 – Aspects of J. curcas L. cultivation: plantation field on the left (source: www.biofuelsdigest.com) and nursery on the right... 5
Figure 5 – LCA methology (source: ISO, 1997) ... 9
Figure 6 – Basic Jatropha biodiesel production system model (adapted from Achten et al., 2008)... 15
Figure 7 – Classic full production system model for Jatropha based biodiesel production... 16
Figure 8 – Side-by-side comparison of the production system model (Jatropha biodiesel based) and the reference system model (fossil diesel based) (adapted from: Reinhardt et al., 2007). ... 17
Figure 9 – System boundary expansion to avoid allocation procedures. ... 17
Figure 10 – Plantation system model. ... 18
Figure 11 – The IMPACT2002+ method framework (source: Jolliet et al., 2003)... 20
Figure 12 – Base production system model as defined in the SimaPro® project. ... 23
Figure 13 – Input transport distance estimation protocol. ... 30
Figure 14 – System boundaries for scenario A production model. ... 32
Figure 15 – Seed cake to biogas and slurry process scheme. ... 33
Figure 16 – Scenario C system boundaries. The pelletizing of seed cake for electricity generation purposes brings up a different reference system equivalent: electricity from coal... 34
Figure 17 – Seed cake to pellets to electricity process scheme. ... 35
Figure 18 – Unit process pattern identification belonging to impact assessment charts legend. ... 43
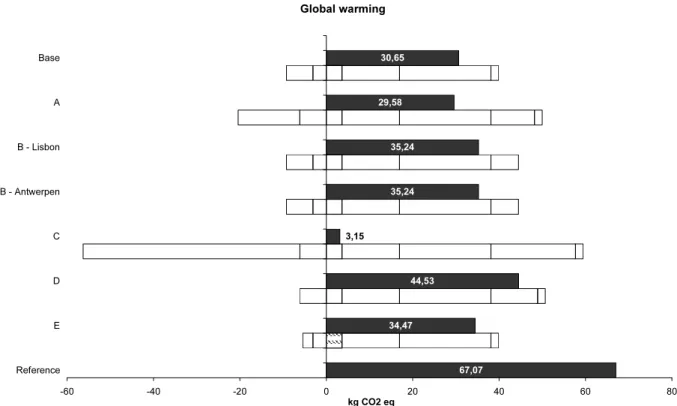
Figure 19 – Global warming potential according to characterization step of IMPACT2002+ of scenarios compared to reference system per 1FU (total in full and contribution of different processes in stacked patterns). ... 43
Figure 20 - Global warming potential according to damage assessment step of IMPACT2002+ of scenarios compared to reference system per 1FU (total in full and contribution of different processes in stacked patterns). ... 44
Figure 21 – Non-renewable energy consumption according to characterization step of IMPACT2002+ of scenarios compared to reference system per 1FU (total in full and contribution of different processes in stacked patterns). ... 45
Figure 22 - Non-renewable energy consumption according to damage assessment step of IMPACT2002+ of scenarios compared to reference system per 1FU (total in full and contribution of different processes in stacked patterns)... 46
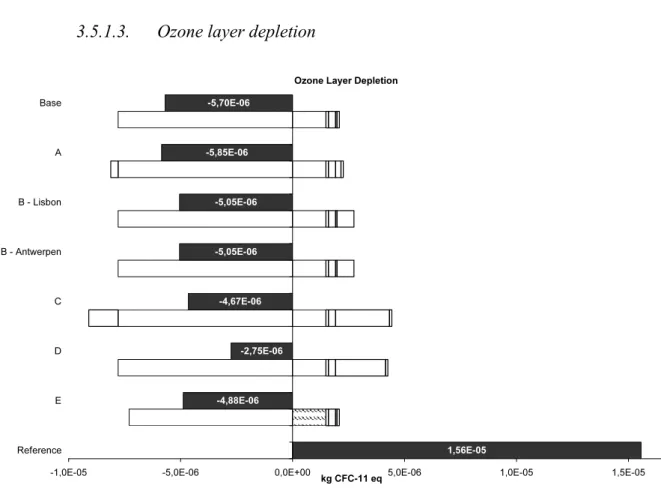
Figure 24 - Ozone layer depletion potential according to damage assessment step of IMPACT2002+ of scenarios compared to reference system per 1FU (total in full and contribution of different processes in stacked patterns). ... 48 Figure 25 – Terrestrial acidification and nutrification potential according to
characterization step of IMPACT2002+ of scenarios compared to reference system per 1FU (total in full and contribution of different processes in stacked patterns). ... 49 Figure 26 - Terrestrial acidification and nutrification potential according to damage assessment step of IMPACT2002+ of scenarios compared to reference system per 1FU (total in full and contribution of different processes in stacked patterns). ... 49 Figure 27 – Land occupation performance according to characterization step of
IMPACT2002+ of scenarios compared to reference system per 1FU (total in full and contribution of different processes in stacked patterns). ... 50 Figure 28 - Land occupation performance according to the damage assessment step of IMPACT2002+ of scenarios compared to reference system per 1FU (total in full and contribution of different processes in stacked patterns). ... 51 Figure 29 – Damage potential of climate change according to Ecoindicator99 of
scenarios compared to reference system per 1FU (total in full and contribution of
different processes in stacked patterns). ... 52 Figure 30 – Fossil fuel consumption according to Ecoindicator99 of scenarios
compared to reference system per 1FU (total in full and contribution of different
processes in stacked patterns)... 53 Figure 31 - Damage potential of on ozone layer according to Ecoindicator99 of
scenarios compared to reference system per 1FU (total in full and contribution of
different processes in stacked patterns). ... 54 Figure 32 – Damage potential of acidification and eutrophication according to
Ecoindicator99 of scenarios compared to reference system per 1FU (total in full and contribution of different processes in stacked patterns). ... 55 Figure 33 - Damage potential of land use according to Ecoindicator99 of scenarios compared to reference system per 1FU (total in full and contribution of different
processes in stacked patterns)... 56 Figure 34 – Comparison of net energy gain (NEG) of scenarios and reference
system. ... 57 Figure 35 - Comparison of net energy ratio (NER) of scenarios and reference
TABLE OF TABLES
Table 1 – Jatropha curcas L. seed oil and methyl-ester (JME) properties comparing to American (ASTM D 6751) and European (EN 14214) standards (adapted from: Oliveira et al., 2009; www.biodiesel.org). ... 7 Table 2 – IMPACT2002+ based analysed environmental impact categories at
midpoint and damage assessment levels (source: Humbert et al., 2005). ... 21 Table 3 – EcoIndicator99 analysed impact categories (source: Goedkoop and
Spriensma, 2001). ... 21 Table 4 – Reported productivities and correspondent land use needed to yield 1ton of seeds. ... 25 Table 5 – Nutrient content ratios of different fertilizers with documented use... 26 Table 6 – Nitrate leaching and ammonia volatilisation and emission factors (kg/ton seed) from artificial fertilizer application. ... 26 Table 7 – Average fertilizer input per age sector (kg/t of seed) (Prueksakorn and
Gheewala, 2008; Prueksakorn and Gheewala, 2006; Reinhardt et al., 2008;
questionnaires)... 27 Table 8 - Average fertilizer input for plantation establishment (kg/ha) (Prueksakorn and Gheewala, 2008; Prueksakorn and Gheewala, 2006; Reinhardt et al., 2008) ... 27 Table 9 – Data for calculating exhaust emissions of driving a Toyota Hilux® for
100Km with biodiesel... 29 Table 10 – Emission factors of GHG in fossil diesel combustion (source: IPCC,
2006)... 29 Table 11 – Emission factors for pellets combustion in power plant. ... 35 Table 12 – Fertilizer input during plantation establishment (kg/ha) and cultivation (kg/t seed). ... 38 Table 13 – Nitrate and ammonia emissions to water and air, respectively, during
cultivation and plantation establishment resulting for NPK application. ... 39 Table 14 – Fossil diesel (left) and biodiesel (right) exhaust emissions... 40 Table 15 – Average input transport distances (in tkm) per freight transport mode (1t basis) (Road, Rail and Sea) and per input and standard deviation. ... 40 Table 16 – Distances travelled by the biodiesel on its way to Europe (to the ports of Antwerp and Lisbon) through the three transport modes (road, railway and sea) in total km and tkm/FU... 41 Table 17 – Haulage of seeds a needed to produce 1t of oil in centralized production scenario... 41 Table 18 – Accounted emissions for pellets combustion in power plant per tne of
extracted oil. ... 42 Table 19 - Haulage of 1 tonne of oil in centralized production scenario. ... 42 Table 20 – Uncertainty analysis of 1FU results with 95% confidence interval
displaying statistical data: mean, standard deviation (SD) and coefficient of
1.
I
NTRODUCTION1.1.
ENERGY AND BIODIESEL
Assuring progress and welfare in a growing population and increasingly technological society has a cost. In an ever-growing demand context, energy production has been facing the challenge to restructure itself without compromising economic, social and environmental sustainability. Energy consumption worldwide, in the developed world but also in the emerging economies, is pushing the limits of supply. Further pressures mount when taking geopolitical matters in account and as well as environmental issues such as growing greenhouse gas emissions and natural resource depletion. Statistics predict a 50% increase in worldwide energy consumption until 2030 with emphasis on non-OECD (Organization for Economic Co-operation and Development) economies. The most demanded type of fuel would continue to be liquid fuel and the transportation sector would take up a large part (EIA, 2008). As such associated CO2 would continue rising.
Fossil fuels account for over 80% of the consumed primary energy worldwide, of which more than 50% is absorbed by the transport sector (EIA, 2008). The intensive and low-efficient use of fossil fuels by humans and the yet limited share of renewable energies in the world’s energy mix has drawn the Oil-Peak closer (Almeida and Silva, 2009). Biofuels present themselves as a direct and immediate replacement for the liquid fuels used in transport, displaying easy integration to the logistic systems currently operating (Escobar et al., 2009).
Liquid biofuels are chemically different from fossil fuels as they contain oxygen besides carbon and hydrogen. Therefore, they are considered oxygenates instead of hydrocarbons (Sims, 2002). Biodiesel is defined as the monoalkyl esters of vegetable oils or animal fats (Dermibas, 2008). Raw vegetable oil is usually transesterified: its triglycerides are combined with an alcohol and a catalyst to yield (m)ethyl esters and glycerol. Product recovery involves phase separation and successful removal of by-products (such as the commercially valued glycerol) and excess reagents (figure 1). The resulting (m)ethyl esters (depending on the alcohol used) show similar viscosity and energy values as conventional diesel (Sims, 2002; Dermibas, 2007).
Figure 1 – General equation of the transesterification of tryglicerides (source: Meher et al., 2006)
Biodiesel has been used in the market in different volumetric proportions, namely in blends between 5% and 20%. It is usually blended with fossil fuels to avoid the need for expensive engine modification and its chemical composition seams to influence combustion efficiency and exhaust emissions (Sims, 2002). Lapuerta et al. (2008) reviewed the published work on this aspect. They concluded that, notwithstanding the disparity of results, most studies point out an increase of NOx emissions and a remarkable decrease in particulates, CO and hydrocarbons (aromatic and polyaromatic compounds) (figure 2) (Lapuerta et al., 2008).
Figure 2 – Average impact of the vegetable oil based biodiesel in exhaust emissions for NOx, particulate
matter (PM), CO and hydrocarbons (HC) (source: Dermibas, 2007).
alternatives are being studied in order to enlighten and sustain the solid future decisions that need to be made (Dermibas, 2008). It is in this context that options such as biodiesel from Jatropha curcas L. are being analysed. This system’s viability consideration depends greatly on its life cycle environmental performance in comparison to fossil fuels.
1.2.
JATROPHA CURCAS L. CULTIVATION AND BIODIESEL PRODUCTIONBiofuels relate to growing energy crops subject to intensive agriculture practices. This implies high inputs of energy, water and fertilizers and large land extension. Therefore, choice of feedstock for biodiesel is most important in biodiesel’s sustainability because of its impacts on food prices and environment. So far, edible and non-edible vegetable oils have been the most attractive feedstock. There are more than 350 oil-bearing crops identified and a wide number of them and common plants have been studied around the world for the past years (Dermibas, 2007). Recently, Jatropha curcas L. (J. curcas) has drawn attention.
J. curcas, also known as Physic nut (or purgueira in Portuguese), belongs to the Euphorbiaceae family. This plant seems to be native from Central America, although its phenology is yet to be completely uncovered. It is commonly grown in the tropics as a living fence. Nowadays it is distributed pantropically, which gives rise to identification of different accessions. Although worldwide seed production is yet negligible, it was once produced in considerable amounts in Cape Verde and exported to Lisbon and Marseille to be used in soap production (Heller, 1996). Jatropha is adapted to arid and semi-arid conditions and higher temperatures, occurring mostly in seasonally dry areas. Its introduction has been successful in drier regions of the tropics with an average annual rainfall of between 300 and 1000 mm, although it also considerable yield can only be expected with rainfall ≥ 500mm (Achten et al., 2008). Jatropha prefers lower altitudes, well drained soils with good aeration (heavy and clayish soils prevent best root formation) and is adapted to marginal lands with low nutrient content (Heller, 1996; Achten et al., 2008). However, Physic nut is able to grow in areas with unsuitable soil and climate conditions, but has not proven to have commercially subsistent seed production in these cases. Reasonable productivity can be attained when an initial boost is given (Jongschaap et al., 2007).
(usually 50 to 60 days after anthesis) the fruit color changes from green to yellow. The seeds retain viability for long periods (Sunder, 2006).
Seeds contain several toxic substances, such as a lectin named curcin, phorbol esters and trypsin inhibitor. Secondary metabolites variety seems to depend on genetics or the environment (Makkar et al., 1997). Seed cake and oil are, therefore, non-edible, although there has been research focused on its detoxification (jatropha.uni-hohenheim.de)
Figure 3 – Left: J. curcas tree (source: worldisgreen.com). Right: details of Jatropha plant – branch, leaf and fruits (source: carboncapture.us)
Jatropha cultivation is considered the first production step of the biodiesel system and is not well documented (Gour, 2006). Optimum input parameters in given conditions are yet to be quantified as well as optimum crop and nursery strategies. Since J. curcas is, after all, a wild plant with wide phenotypic variation, reliable field data is needed to set input levels (Achten et al.., 2008).
J. curcas reproduces both through seeding and vegetative propagation of branch cuttings. Some suggest the use of seedlings from nurseries seems to enhance cultivation’s success as nurseries provide necessary control of environmental factors and allow production of healthy seedlings (figure 4). Nursery raised seedlings appear to ensue higher survival and better growth then the direct seed sowing (Kaushik and Kumar, 2008). The caretaker should monitor the seedling’s quality to keep uniformity at best available quality amid the plantation (Gour, 2006).
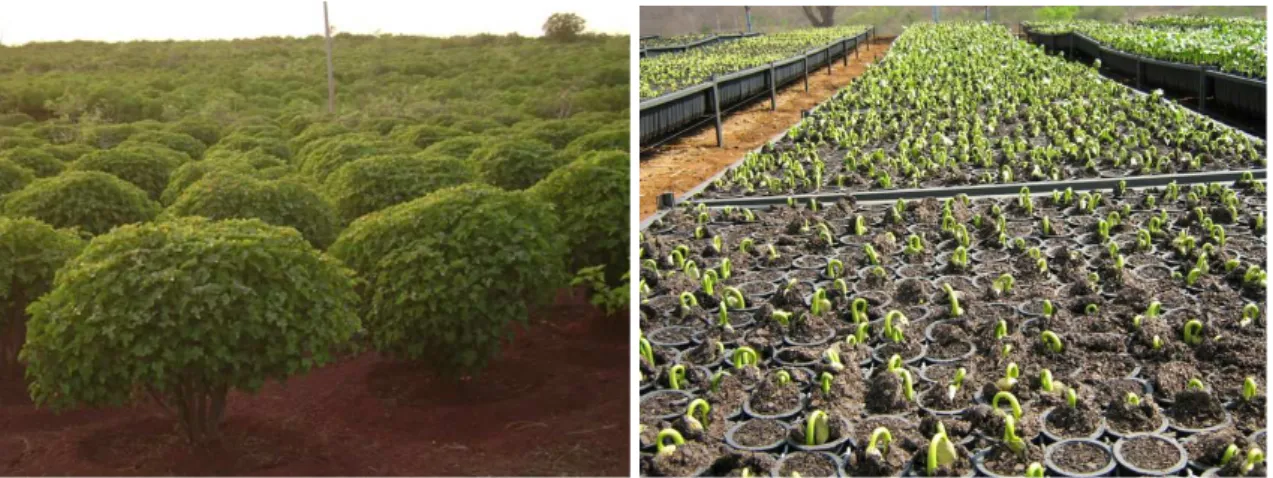
Figure 4 – Aspects of J. curcas L. cultivation: plantation field on the left (source: www.biofuelsdigest.com) and nursery on the right.
Pruning can be carried out from the first year on in order to shape the bush and enhance branch formation. Setting the plant’s architecture motivates healthy inflorescence and facilitates canopy management and fruit picking (Gour, 2006; Dias et al., 2007). Additional operations include weeding and hoeing of the plant’s basin, especially during the establishment period (Kaushik and Kumar, 2008).
The belief that the plant’s toxicity should be enough to deter parasitism has proved wrong since there are indeed species that find nutrients in the J. curcas. Different authors have observed pests and diseases of several types associated with the Physic nut, such as powdery mildew, flea beetles and millipedes, among others. So far, this has only happened in a regional fashion, but no wide spread diseases have yet been registered (Dias et al., 2007; Shanker and Dhyani, 2006). This is expected to change if large commercial plantations emerge (Kaushik and Kumar, 2008; Gour, 2006).
A Jatropha plantation takes approximately two years to start yielding. However, some authors state that plants risen from seeds take up to 4 years to yield seeds, in contrast to stem cuttings that start yielding in less than a year (Sunder, 2006). It is generally assumed that considerable and stable yields start at 4th-5th year of cultivation (Kaushik and Kumar, 2008). The yield depends on the soil, rainfall and the plant’s origin (Sunder, 2006). So far, a generic plantation yield is unknown for lack of systematic reporting (Achten et al., 2008). Data on this matter ranges from 1.5 to 7.8 tonnes of dry seed ha-1 yr-1 (Jongschaap et al., 2007). Achten et al. (2008) agreed that reasonable yield should vary from 4 to 5 tonnes of dry seed ha-1 yr-1.
Large scale cultivation requires irrigation. Nursery seedbeds demand water right after sowing and seedlings require irrigation during their first couple of years of plantation. Afterwards, hydric demand is contingent to agroclimatic conditions. Jatropha has low moisture requirement but water can be a limiting factor. Claims suggest that in high precipitation equatorial regions Jatropha can bloom and yield fruit all year. Drier climates enhance the seeds’ oil content and extreme draught will cause the trees to leaf shedding (Sunder, 2006; Gour, 2006; Tewari, 2007). Adrabbo and Atta (2008) have recently studied Jatropha’s response to hydric stress and drew conclusions that are somewhat more specific. They verify that there are no significant differences among the values of oil yield and its fatty acid and mineral composition due to different water stress ratios. However, slightly higher oil yields were attained with irrigation providing 100% of evapotranspiration potential (considered to be optimal) (Adrabbo and Atta, 2008).
Harvesting should focus on brown and yellow fruits that bear mature seeds. Collection is manual and is followed by fruit drying, which can be performed naturally or mechanically. Seed removal is manual or mechanical through a seed decortication. The seeds should be dried both for sowing (in the shed) or oil (in the sun) purposes (Gour, 2006). Some companies claim to apply mechanical harvesting similar to that used in olive and coffee plantations (plantabio.com.br/wp).
Post harvest management is crucial to yield quality and includes aspects such as seed grading and storage and pruning (Gour, 2006).
The two main methods for extracting the oil from the seeds is pressing or solvent extraction (commonly with hexane). The yields differ, being much higher with solvent extraction. Likewise, such is the most energy and input expenditure process and only large amounts of seeds seem to justify its use (Adriaans, 2006). Adriaans (2006) points out that press attained Jatropha oil has satisfactory quality so that there is no need in using underdeveloped and environmental hazardous solvent extraction methods.
Meanwhile, other oil extraction procedures are being developed including as enzyme or supercritical fluids-supported (Achten el al., 2008). Winkler et al. (2003) obtained satisfactory results using aqueous proteases in alkaline medium. Shah et al. (2005) added ultrasonication to the process and increased yields up to 74% in half the time.
Several studies have experimented the transesterification of Jatropha curcas oil. They corroborated the suitability of the resulting biodiesel use for diesel engine combustion proven as it is that its physico-chemical properties fit in European and American quality standards (table 1) (Oliveira et al., 2009; Tiwari et al., 2007; Lu et al., 2009; Tewari, 2007; El Diwani et al., 2009; Sahoo and Das, 2009).
Table 1 – Jatropha curcas L. seed oil and methyl-ester (JME) properties comparing to American (ASTM D
6751) and European (EN 14214) standards (adapted from: Oliveira et al., 2009; www.biodiesel.org).
Oil JME ASTM D6751 EN 14214
Calorific value (MJ/kg) 40.31 41.72
Acid value (mg KOH/g) 8.45 - max 0.50 max 0.5
Water content (w/w%) 0.052 0.003 max 0.05 max 0.05
Ash content (w/w%) nda nda max 0.02 max 0.02
Density at 15ºC (g/cm3) 0.9215 0.8826 0.86–0.90 0.86–0.90
Kinematic viscosity at 40ºC (Cst) 30.686 4.016 1.9 – 6.0 3.5–5.0
Conradson carbon residue (w/w%) 0.5396b 0.0223b max 0.05b max 0.3c
Copper strip corrosion 1a 1a max No. 3 1
Pour point (ºC) -2 -5
Flash Point (ºC) - 117 min 130 min 120
1.3.
PROBLEM STATEMENT
Biofuel sustainability has been widely debated, although an agreement of sustainability criteria and extensive analysis on the subject being yet to be completed. Nonetheless, political decisions are being made, economic investment is on course and environmental and social impacts are taking place as we speak (Passos, 2004).
Sustainability of a human activity encompasses a comparison between the environmental status resulting from it and the natural or desired status. A favourable comparison, in case of a biofuel production, would ideally agree with the following aspects (Passos, 2004; www.inforse.org):
− the fuel should supply an amount of energy superior to that required to produce it; − long term feedstock supply should be guaranteed in order to assure long term biofuel
supply to the market, which depends on the sustainability of the underlying activities; − the emission of unwanted substances to the environment (such as Green House Gases)
− land use should not compromise food production nor the respect for the ecosystem balance.
Biodiesel life cycle environmental balance has linear dependence on the efficiency of the agricultural and processing technologies applied (Janulis, 2003) and on the choice of an effective energy crop as feedstock (Ponton, 2009). To enjoy effectiveness, a crop should be fast growing, perennial, able to grow on marginal soil and require minimal fertilizer and irrigation input (Ponton, 2009).
Jatropha curcas L. seems to meet these criteria but solid and intensive scientific information is still scarce and insufficient to substance valuable strategies. Its potential for socio-economic development and favourable preliminary results on life cycle urge for better data and far more extensive studies in order to guide future decisions on this matter (Achten et al., 2007).
1.4.
LIFE CYCLE ASSESSMENT: STATE OF THE ART
Life cycle thinking sprung from the need to embrace the wider perspective of a product’s whole system and evaluate it throughout all stages of its life cycle. Life cycle assessment (LCA) comprises either a conceptual framework of a set of practical tools (or both) to analyse all the activities that go into making, transporting, using and disposing of a product. The main advantage of LCA is in supporting decision making with scientific data and competence (Jensen et al., 1997). The application of the process and associated waste minimization practices by management, design and manufacturing can also lead to environmentally better products as well as less expensive and marketing competitive ones (Ciambrone, 1997).
Modern LCA methodology stands on ISO 14040 to 14043 standards (ISO, 1997). These state that LCA comprises three main steps:
- inventorying relevant inputs and outputs of a product system; - evaluating the environmental impacts of those inputs and outputs;
- interpreting results of the previous phases in relation to the study’s objectives.
Figure 5 – LCA methology (source: ISO, 1997)
1.4.1. Goal and scope definition
Modelling implies simplification, which leads to distortion. Defining goal and scope diminishes the impact of the distortion in the results (Goedkoop et al., 2008). According to ISO 14040 (1997) standard, the goal of an LCA shall unambiguously state the intended application, the reasons for carrying out the study and the intended audience. In other words, the goal should determine the study’s purpose and level of sophistication.
Scope definition assures the setting of borders of the assessment in a manner to ensure the study is wide and detailed enough to address the stated goal. In defining scope, one must clearly describe the following items:
- the product system itself and it’s boundaries; - the system’s function and the functional unit; - allocation procedures;
- the types of impacts and their assessment techniques to be used; - data and data quality requirements;
- assumptions and limitations; - type of critical review, if any; - required type of report.
does the functional unit, which represents a quantified performance of the product system for use as a reference unit in a LCA study (Goedkoop et al., 2008; Jensen et al., 1997).
Allocation means partitioning the input or output flows of a process to the product system (Jensen et al., 1997). It is to be avoided and can be so through splitting processes in order to split outputs or extending system boundaries (Goedkoop et al., 2008).
The main limitations of an LCA relate to scale, data quality and the type of conducted analysis and its final use. Data quality, availability and inaccuracy resulting from assumptions and modelling, absence of social are forefront problems. The focus on the environmental and the methodology of LCA imply lack of economical, social and political analysis and also the lack of temporal dimensions and inability to address localised impacts (ISO, 1997; Guinée et al., 2001).
Since LCA is an iterative technique, the scope might be subject to modification along the study’s development as additional information is collected.
1.4.2. Inventory analysis
This phase’s objective is to quantify all relevant inputs and outputs of the product system through data collection and calculation procedures. Data shall be collected for each unit process included in the system boundaries. As data are collected constraints to previously stated data collection requirements and procedures might occur, which implies revisions to the goal or scope (Jensen et al., 1997).
The framework of LCA relies mostly on system boundary and life cycle inventory and its interaction with the established goals. These aspects define nature of the study and the spatial, temporal and production chain limits of the process and list all its components, clarifying inputs and outputs (Davis et al., 2009). Having settled this, the impact assessment phase can be carried out.
1.4.3. Impact assessment and impact categories
- classification – assigning of inventory data to categories;
- characterization – modelling of the data within the impact categories;
- normalization – showing relative contribution from the material production to each already existing effect;
- weighting – aggregating the results in very specific cases when meaningful (ISO, 1997; www.pre.nl).
Classification all substances are sorted into classes according to the effect they have on the environment. The aggregation within each class enables the production of an effect score. It is not sufficient just to add up the quantities of substances involved without applying weightings. Some substances may have a more intense effect than others may. This problem is dealt with by applying weighting factors to the different substances (www.pre.nl).
Damage oriented impact assessment methods add a step of damage to human health and ecosystem quality assessment. The principle consists of using damage functions to establish the relation between an impact and the damage to human or Ecosystem Quality (Goedkoop and Spriensma, 2001).
One should note that generally accepted methodologies for consistently and accurately associated inventory data with potential environmental impacts are still being developed (Jensen et al., 1997).
1.4.3.1. Global warming
Global warming is in the agenda of the scientific and political community worldwide. This phenomenon’s main responsible are greenhouse gases (GHG), whose resilient permanence in the atmosphere leads to the entrapment of heat otherwise dissipated to farther distances from the earth’s surface. The most significant examples of GHG are carbon and nitrogen oxides, methane, water vapour and fluorinated compounds (www.epa.gov). The Global Warming Potential (GWP) measures how much a mass of GHG (in t CO2 eq) can contribute to global warming (www.grida.no). It is expected that biodiesel should contribute to the reduction of GHG emissions.
1.4.3.2. Acidification
1.4.3.3. Eutrophication
The use of fertilizers in agricultural systems to increase productivity and sustain the soil’s nutrients may lead to the accumulation of phosphorous or nitrogen in the soil, air and water. This nutrient enrichment of the ecosystem is an unbalancement and causes biodiversity loss (toxics.usgs.gov). Its potential can be measured in PO4 eq.
Eutrophication has different effects depending on the ecosystem being aquatic or terrestrial. Aquatic eutrophication leads to the excessive growth of algae, which decompose and lead to a general deregulation. In the soil, eutrophication is caused by the deposition of atmospheric nitrogen compounds and leads to changes in functions and diversity of species (Jensen et al., 1997).
1.4.3.4. Ozone depletion potential
Ozone depletion is caused by the emission and thropospheric accumulation of halogenate gases, namely chlorofluorocarbons (CFC). Permanence in the atmosphere renders those gases into ozone reactive substances which, when transported to the stratosphere, cause the reduction of the ozone layer (www.esrl.noaa.gov).
Analogously to GWP, the Ozone Depletion Potential (ODP) defines the capacity of a substance to induce stratospheric ozone layer depletion. The impact of the analysed substance is compared to the one of trichlorofluoromethane (CFC-11). Therefore, this environmental category is measured in CFC-11 eq (www.epa.gov).
1.4.3.5. Non-renewable energy and energy analysis
This parameter refers to the energy content of all fossil fuels consumed in the system. It is expressed in MJ primary non-renewable energy (Humbert et al., 2005).
The fossil energy requirement will be accompanied by a full chain energy analyses in which the Net Energy Gain (NEG) and the Net Energy Ratio (NER), two indicators of energy efficiency in biofuels production, will be calculated. NEG measures the difference between the total energy outputs and the total energy inputs. NER is a ratio of total energy outputs to total energy inputs (Prueksakorn and Gheewala, 2008).
1.4.3.6. Land Occupation
2007). Therefore, it is important to take land occupation and use into account when evaluating environmental impacts.
Land occupation midpoint unit is m2 eq of organic arable land year. Land occupation damage potential (impact on ecosystem) is measured in Potentially Disappeared Fraction times area times year (PDFm2yr). This translates into an increased damage with an increase on area size, occupation time and increase in restoration time for formerly occupied area (Goedkoop and Spriensma, 2001).
1.4.4. Uncertainty analysis
In statistical terms, uncertainty is a parameter associated with the result of measurement that characterizes the dispersion of the values of a measured quantity. In an inventory it refers to the lack of certainty of the inventory components resulting from the data or the way it was dealt with (IPCC, 2000). It represents, therefore, the lack of knowledge about the true value of a quantity, appropriateness of a model or methodological decision, etc. (Reap et al., 2008). Uncertainty analysis ascertains and quantifies the fitness of an LCI result through a systematic procedure that measures the cumulative effects of input uncertainty and data variability. It models uncertainties in the inputs to an LCA and propagates them to results. The methodology can use either ranges or probability distributions do determine uncertainty (Jensen et al., 1997; Reap et al., 2008). IPCC (2000) recommends that uncertainty information shall not be intended to dispute the validity of the inventory estimates, but to help prioritise efforts to improve the accuracy of inventories in the future and guide decisions on methodological choice.
1.4.5. Result interpretation
2.
M
ETHODOLOGY2.1.
GOAL AND SCOPE
2.1.1. Goal definition
The goal of this study is to evaluate environmental advantages and disadvantages of Jatropha methyl ester through the identification and quantification of the major environmental impacts. It aims at contributing to the effort to clarify the Physic nut’s potential as an eligible biodiesel crop and supporting decision making, thus contributing to environmental optimization of the agricultural and conversion processes.
The intended audience is scientists and policy makers.
2.1.2. System function and functional unit
This study intends the estimation and quantification of energy balance and environmental impact of the Jatropha based biodiesel production system, being transportation its end use. Which means the basic function of the system is transportation.
The adopted functional unit (FU) corresponds to 100 km driven by a Toyota Hilux pickup truck with diesel engine on local dust roads fuelled by Jatropha biodiesel. According to Fobelets (2009), one FU corresponds to 18.65 L JME (calorific value of 39.096 MJ/kg and a density of 0.875 kg/L). The equivalent in fossil diesel is 18 L (calorific value of 42.66 MJ/kg and a density of 0.832 kg/L) (Vandenbempt, 2008).
2.1.3. System Boundaries and allocation
Figure 6 – Basic Jatropha biodiesel production system model (adapted from Achten et al., 2008)
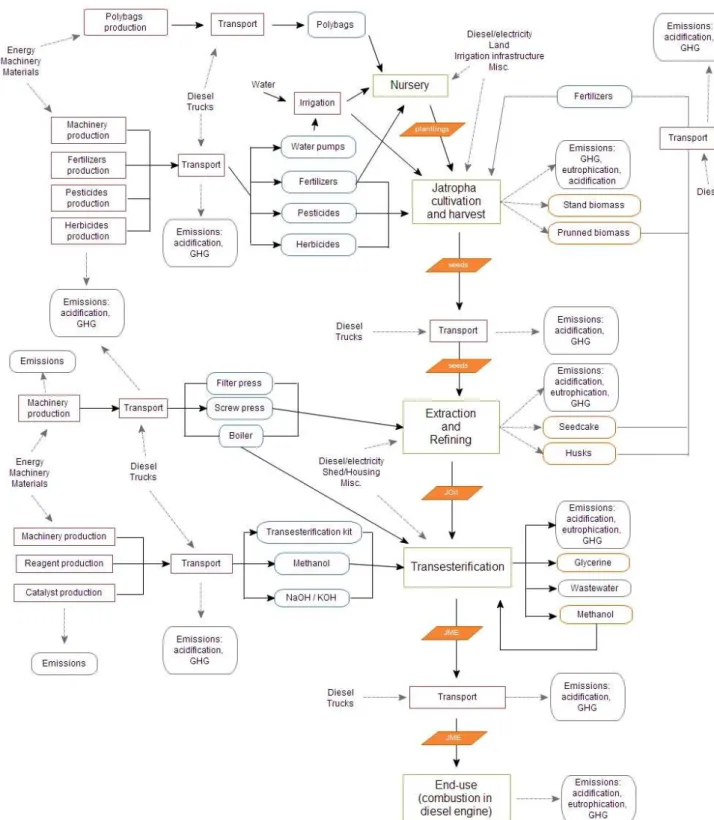
A broader production system model includes all inputs and outputs of the process and allows the mapping of the real boundaries (figure 7). The model was elaborated considering the following main aspects:
- axial processes from growing Jatropha plants to methyl ester production end use; - use of by-products;
Figure 7 – Classic full production system model for Jatropha based biodiesel production.
Figure 8 – Side-by-side comparison of the production system model (Jatropha biodiesel based) and the reference system model (fossil diesel based) (adapted from: Reinhardt et al., 2007).
Utilization of by products, either as energy carriers or not, displace other materials, having environmental impact implications. In the same way the reference system encloses the fossil fuel life cycle, it should include the reference substituted products. (Cherubini et al., 2009). Allocation was avoided by expanding system boundaries. Hence, by-products were kept in the system and the environmental burdens were compared with their equivalents. Thus, the production of seed cake as fertilizer subtracted the correspondent amount of artificial NPK (production and transport) and the production of glycerol discounts for the production of fossil based glycerine (figure 9).
2.1.4. Plantation model and scenarios
The base scenario corresponds to a small plantation and a decentralized production unit. The plantation lifetime mounts up to 20 years on continuous rotation. This means that the plantation is divided in parcels, each corresponding to an age block, i.e. each parcel bears trees of the same age and the tree’s ages decrease consecutively (figure 10).
0-1yr 1-2 yr 2-3 yr 3-4 yr 4-5 yr
6-7 yr 7-8 yr … … …
Figure 10 – Plantation system model.
The evolution of a Jatropha based biodiesel economy suggests an increased scale production and the widening of the market from local use to final product delivery and consumption. Increasing the complexity of the Jatropha biodiesel system adds up to the environmental importance of its by-products, namely the seed cake. These relevant aspects of the sustainability of Jatropha based biodiesel production suggested the following scenarios:
A. use of seed cake for biogas production and slurry to be used as fertilizer (decentralized perspective);
B. exporting biodiesel to Europe for final use (Antwerp and Lisbon);
C. transport of seeds from small farmers to centralized extraction and transesterification unit with pelletizing and combustion of seed cake for electricity production;
D. transport of seeds from small farmers to centralized extraction and transesterification unit with seed cake being for use as fertilizer;
E. transport of oil from farmers to centralized transesterification unit.
2.1.5. Data quality requirements, assumptions and limitations
Data sources vary from scientific literature, to on-field collected data and questionnaires proposed to companies and scientists working with Jatropha plantations and Jatropha biodiesel production units in several points of the world.
The main limitation appears to be data scarcity and geographical and temporal scale constraints. Gaps induce generalization and assumptions that lead to uncertainty. In addition, data from libraries (Ecoinvent, etc.) available from the LCA performing software have geography contingency not always coincident with the geographic span of this LCA. This leads to incongruence in technological level, energy mixes, etc..
Reap et al. (2008) suggest that site-generic LCA’s, such as this, admit inaccuracy for its lack of spatial information and the intrinsic assumption of globally homogeneous effects. Except for global warming and ozone layer depletion, the other analysed environmental stressors are influence by spatially variable phenomena. Regional scales require spatial information to accurately associate inputs with the variable sensitivity of environments.
Some basic assumptions were made, funded with on-field experience and literature: - weeding and harvesting are done manually;
- irrigation is merely life-saving;
- power sources follow the regional energy mix – liquid fossil fuels for transportation and industrial practices and coal for electricity generation (IEA, 2008);
- in the nursery stage seedlings are grown in polybags;
- collected data defined by an interval have a normal (Gaussian) distribution.
2.1.6. Environmental impact categories and impact assessment methods
This LCA focuses on five main environmental impact categories related to the two basic environmental fluxes in the production system – energy and emissions – and land occupation. Two methods were chosen to assess those categories, having each one of them different approaches to the inputs to the ecosystem and, therefore, different final categories. Choosing two distinct indicators allows knowing whether they influence the conclusions or not.
2.1.6.1. IMPACT2002+ Method
This methodology combines a midpoint/damage approach. Its framework groups life cycle inventory (LCI) results with similar impact pathways into midpoint categories. A midpoint indicator characterizes the elementary flows and other environmental interventions that contribute to the same impact. These are further ahead allocated to one or more damage categories, which represent quality changes of the environment. A damage indicator result is the quantified and simplified representation of this quality change (figure 11) (Jolliet et al., 2003).
Figure 11 – The IMPACT2002+ method framework (source: Jolliet et al., 2003)
Midpoint characterization scores are represented in kg-equivalents of a substance compared to the reference system. While damage characterization factors of any substance are obtained by applying a characterization factor to the midpoint characterization potentials. The yield is a damage score with a greater uncertainty than that of midpoint indicators (table 2). Its units vary according to the type of damage category: DALY’s (Disability Ajusted Life Years) regarding human health, PDFm2yr (Potentially Disappeared Fraction of species per m2 per year) to measure the impacts on ecosystems and MJ for resources. Interpretation can be made either at the midpoint or damage stage (Humbert et al., 2005).
Table 2 – IMPACT2002+ based analysed environmental impact categories at midpoint and damage assessment levels (source: Humbert et al., 2005).
Impact Category Midpoint
(characterization) unit
Damage assessment unit
Global Warming kg CO2eq kg CO2eq
Terrestrial Acidification/Nitrification kg SO2eq
Land Occupation m2eq org arable year
PDF.m2.yr
Ozone Layer Depletion kg CFC-11eq DALY
Non-Renewable Energy MJ primary fossil energy MJ
Global warming, terrestrial acidification/nitrification and ozone layer depletion are based on emissions to air only.
2.1.6.2. EcoIndicator99
This method also allocates impacts into damage categories (Human Health, Ecosystem Quality and Resources). They result from the addition of impact category indicator results are calculated in the characterisation step and added into damage categories (table 3). This damage assessment step precedes normalisation on a European level. The core of the EcoIndicator99 is, nevertheless, the weighting step (Goedkoop and Spriensma, 2001; www.pre.nl).
Table 3 – EcoIndicator99 analysed impact categories (source: Goedkoop and Spriensma, 2001).
Impact Category Damage assessment unit
Acidification/Eutrophication
Land Use PDF.m
2
.yr Ozone Layer
Climate Change DALY
Fossil fuels MJ surplus
2.1.6.3. Monte Carlo Uncertainty Analysis
correlated uncertainty) are dependent upon each other. However, being treated as independent in uncertainty analysis tends to overestimate the uncertainty level of the real process (Scipioni et al., 2009). In addition, raw data from libraries such as ecoinvent include cumulative uncertainty ranges which add up uncertainty of the practitioner inventory (Frischknecht and Rebitzer, 2005).
2.2.
INVENTORY ANALYSIS
2.2.1. Data collection
Gathered data proceeds from:
- literature, mainly from previously done Jatropha based biodiesel life cycle analysis; - questionnaires submitted to institutions currently planting Jatropha in several global
locations.
Data obtained from published scientific literature ended up being the main source for input and output modelling, since the few retrieved questionnaires were incomplete. For this reason, the information provided by the institutions served mainly to corroborate literature data and to give an insight on plantation practices taking place.
Transport, energy sources, land and infrastructures processes were inputted from libraries available in SimaPro®. The library inventoried data to which this analysis most frequently recurred are included in Ecoinvent (Swiss Centre for Life Cycle Inventories, Switzerland), BUWAL 250 (Swiss Department of the Environment, Transport, Energy and Communications, Switzerland) and ETH-ESU 96 (Swiss Federal Institute of Technology Zurich, Switzerland).
2.2.2. Data treatment
Conducting a generic LCA entailed generic data. Hence, collected data was statistically treated so as to obtain means and standard deviations.
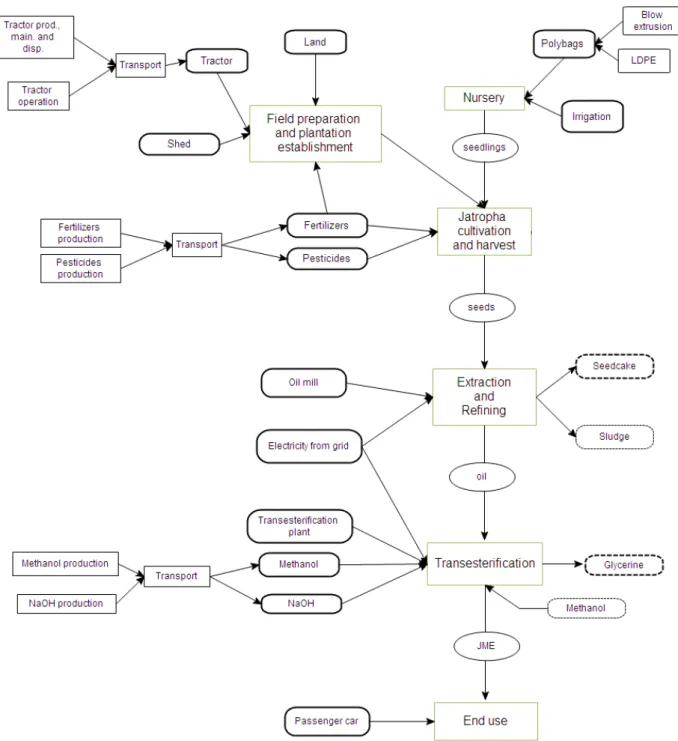
Translating the production model in a SimaPro® project implicated the building of blocks meaning unitary processes. Defining each unitary process required defining inputs of materials and/or energy and/or other processes, either obtained from collected data or contained in the libraries. Thus, data treatment was performed grouped into those interfeeding building blocks, (figure 12).
per hectare, nursery inputs were calculated per seedling, cultivation inputs were calculated per tonne of seed, etc.). The interconnection of the processes is chain-like and therefore relied on a process output being the input of the following process. In this way, calculations were simplified and the narrowing of the demanded amounts is only done when retrieving the final process (biodiesel use in the truck) that sums up the functional unit.
Figure 12 – Base production system model as defined in the SimaPro® project.
All infrastructure and machinery inputs, both at production and transport level, were retrieved from the available libraries in SimaPro®. Inputs defined by quantity (p) were inventoried according to their usage, i.e. their functional unit (either lifespan, capacity, etc.) was reduced to the product system’s aim.
For instance, the inventoried tractor has a 7000 h lifespan. The questionnaires indicated 6 h/ha of tractor usage for field preparation. Therefore, the inventory accounts for 8.6x10⁻⁴ p tractor/ha of prepared field. Analogous reasoning was made for every infrastructural and transportation equipment.
2.2.2.1. Polybags
Polybags are made of low density polyethylene (LDPE) and generally produced by blow extrusion (www.iqsnewsroom.com). This process (all inputs included) is depicted in the libraries.
Calculating the mass of one polybag:
− LDPE density = 0.93 g/cm3 (Klyosof, 2007); − Assumed thickness of 0,05 cm;
− 10 x 20 cm dimensions (Tewari, 2007).
2.2.2.2. Field
Field preparation practices were qualitatively well described in the questionnaires. Based on their information, operations such as levelling and ploughing taking 6 h/ha using a tractor were taken in account.
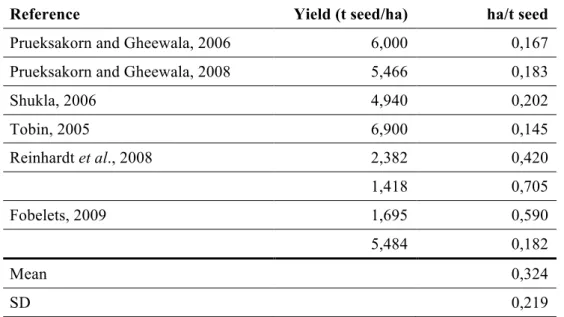
Table 4 – Reported productivities and correspondent land use needed to yield 1t of seeds.
Reference Yield (t seed/ha) ha/t seed
Prueksakorn and Gheewala, 2006 6,000 0,167
Prueksakorn and Gheewala, 2008 5,466 0,183
Shukla, 2006 4,940 0,202
Tobin, 2005 6,900 0,145
Reinhardt et al., 2008 2,382 0,420
1,418 0,705
Fobelets, 2009 1,695 0,590
5,484 0,182
Mean 0,324
SD 0,219
Land is inventoried in the databases.
2.2.2.3. Irrigation
As depicted in the stated assumptions, irrigation is merely life saving, however needed in the nursery. From literature and questionnaires, is possible to conclude that irrigation during the plantation life is not frequent and of difficult determination and is provided either by precipitation or, most commonly, by pumping. Therefore, one library entry that covers the irrigating process comprising equipment, energy expenditure and water quantities was used as an input on nursery stage.
2.2.2.4. Fertilizers
Table 5 – Nutrient content ratios of different fertilizers with documented use.
Fertilizer N P and K content factors Reference
NPK (x:y:z)
%N = x
%P2O5 = y P = 0.44xy
%K2O = z K = 0.83xz
DAP N/DAP = 0.18
P/DAP = 0.2
Jenssen, 2003; Wood and Cowie, 2004
Urea N/Urea = 0.46 Jenssen, 2003; Wood and Cowie,
2004
Rock phosphate P/Rock phosphate = 0.15 Pierzynkski et al., 2005
KCl K/KCl = 0.61 Alley and Wyser, 2005
Whenever mentioned, seed cake was equated as NKP, being 1 kg of seed cake equivalent to 0.15 kg of NPK (Prueksakorn and Gheewala, 2008).
Emissions resulting from N fertilizer application both in the plantation establishment and the cultivation phases were attained and included in the product system designed in SimaPro® as emissions to air and to water (table 6). Thus, nitrate leaching and ammonia volatilization were accounted as emissions to water and air, respectively (IPCC, 2006).
Table 6 – Nitrate leaching and ammonia volatilisation and emission factors (kg/t seed) from artificial fertilizer application.
Emission factor Reference
Water NO3 0.3 IPCC, 2006
Air NH3 0.1 IPCC, 2006
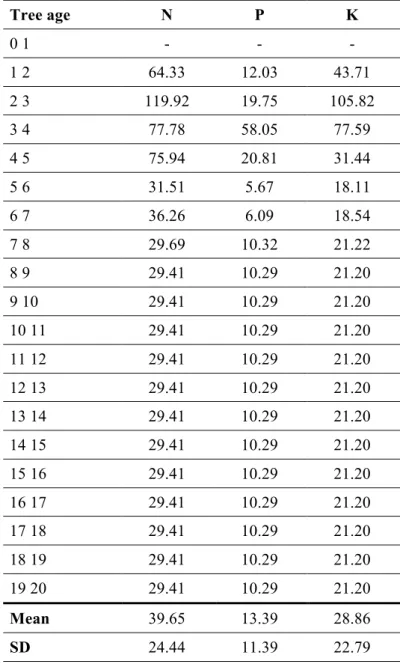
Table 7 – Average fertilizer input per age sector (kg/t of seed) (Prueksakorn and Gheewala, 2008; Prueksakorn and Gheewala, 2006; Reinhardt et al., 2008; questionnaires).
Tree age N P K
0 1 - - -
1 2 64.33 12.03 43.71
2 3 119.92 19.75 105.82
3 4 77.78 58.05 77.59
4 5 75.94 20.81 31.44
5 6 31.51 5.67 18.11
6 7 36.26 6.09 18.54
7 8 29.69 10.32 21.22
8 9 29.41 10.29 21.20
9 10 29.41 10.29 21.20
10 11 29.41 10.29 21.20
11 12 29.41 10.29 21.20
12 13 29.41 10.29 21.20
13 14 29.41 10.29 21.20
14 15 29.41 10.29 21.20
15 16 29.41 10.29 21.20
16 17 29.41 10.29 21.20
17 18 29.41 10.29 21.20
18 19 29.41 10.29 21.20
19 20 29.41 10.29 21.20
Mean 39.65 13.39 28.86
SD 24.44 11.39 22.79
First year fertilizer application was included in the establishment phase and calculated based on documented NPK inputs for first year (table 8).
Table 8 - Average fertilizer input for plantation establishment (kg/ha) (Prueksakorn and Gheewala, 2008; Prueksakorn and Gheewala, 2006; Reinhardt et al., 2008)
N P K
112.05 49.30 93 64 14.08 13.28
48 8.36 43.99
2.2.2.5. Pesticides
Pesticide use was not documented in the collected literature, but thoroughly mentioned in the questionnaires. Different commercial products were mentioned such as Kung Fu, Karate and λ -cyhalothrin. All of these compounds are pyrethrins (WHO, 2003) and were, therefore, defined in the production model as pyrethroid compounds.
2.2.2.6. Extraction
The extraction phase takes place in an oil mill listed in the databases. Its use was gauged adapting its capacity to the intended size, as previously described. The mills functioning uptakes 0.614 kWh/kg JME of electrical power (Reinhardt et al., 2008). Cold pressing was assumed, which avoids the need for steam generation.
Documented oil extraction efficiency is 16.32% (Achten et al., 2008).
2.2.2.7. Transesterification
It was consider that this part of the product system took place in a facility represented by a vegetable oil transesterification plant from the ecoinvent database. Its use was gauged adapting its capacity.
Establishing inputs of reagents and energy at the transesterification was funded on the following data:
− methanol/oil ratio = 0.2 (Achten et al., 2008); − methanol recovery ratio = 0.739 (Fobelets, 2009); − NaOH/oil ratio = 0.0084 (Fobelets, 2009);
− transesterification efficiency = 97% (Achten et al., 2008); − glycerol output = 180.247 kg (SD=56.52) (Fobelets, 2009);
− electricity expenditure in transesterification process = 0.42 kWh/kg JME (Reinhardt et al., 2008).
2.2.2.8. End use
End use includes exhaust emissions and the life cycle of the vehicle. Vehicle and emissions data were use both in the end use phase of the product system and the reference system.
The most approximate vehicle to a Toyota Hilux® listed in the libraries was a passenger car. Its inventory was affected to the lifespan of 1FU (100 km), considering:
2.2.2.9. Exhaust emissions
Exhaust emissions are the main contributors for GHG emission during a vehicles life cycle (Chapman, 2007). Hence, generic biodiesel exhaust emissions where calculated for CO, CO2, CH4, N2O, hydrocarbons (HC), NOx and particulates (PM). CO, HC, NOx and PM emissions were admitted as the standards for the considered vehicle (tables 9). In addition, IPCC (2006) supplies emission factors for use of fossil diesel in diesel engine for CO2, CH4 and N2O (table 10).
Carbon derived emissions were excluded from the production system analysis, seeing that biomass development uptake in the cultivation phase should neutralize them, i.e., the carbon neutral perception of the biomass lifecycles.
Table 9 – Data for calculating exhaust emissions of driving a Toyota Hilux® for 100Km with biodiesel.
Fossil diesel standard emission for Toyota Hilux® (g/km)
Change to biodiesel
CO 0.013
HC 0.001
NOx 0.312 +10%
PM 0.039 -45%
Reference www.toyota-europe.com Dermibas, 2007
Table 10 – Emission factors of GHG in fossil diesel combustion (source: IPCC, 2006).
Emission factor
(kg/TJ)
CO2 74100
CH4 3.9
N2O 3.9
2.2.2.10. Transport
Being a generic life cycle assessment, referring not to any sole specific cultivation and biodiesel production location but to a general model, the transportation distances taken into account in this study deserved special attention. In this sense, a protocol was elaborated in order to establish generic transport data to include in the LCI (figure 13).
Figure 13 – Input transport distance estimation protocol.
This study focused transport issues mainly on input transportation from production/distribution points to plantation sites. The considered inputs were: fertilizers, pesticides, cultivation machinery, methanol and sodium hydroxide.
The protocol ran as follows:
1. Several known significant Jatropha plantation were located and visualized through geographic information systems software and grouped by countries.
2. For each country, the local availability of each input was verified through FAO (2006) statistical services and extensive Internet search (see annex for tables).
b. If not produced locally, the nearest main international seaport was considered the first order provenance of the input and localized (www.worldportsource.com). 3. For inputs not produced locally, an extensive Internet search was made in order to
determine the world’s main producer/supplier and where its main production facility is located. Its nearest seaport (often coincident with the production facility location) served as the second order provenance of the input (see appendices for tables).
4. Distances were calculated between plantation sites and the provenance sites for each output or the nearest main city/sea port.
a. Road distances were calculated through web mapping services. The Google Earth© (Google Inc., California, USA) and the Microsoft Visual Earth© (Microsoft Corporation, Washington, USA) frameworks were both used, although Microsoft’s tool was preferred due to worldwide availability of information, which Google Earth© did not provide (maps.live.com; maps.google.com).
b. Sea distances were calculated by World Shipping RegisterTM online distance calculator tool (e-ships.net/dist.htm).
5. The Physic nut is the main feedstock for biodiesel production in India (Gonsalves, 2006) and many of the known plantations are located there. In that nation, rail transport is the most representative of the modal split (www.indianrail.gov.in). Hence, the distances measured within its borders were attributed to rail freight transport and each input was considered to travel both by rail and road in the same percentage as the sum of Indian distances take in the sum of the total measured distances:
2.2.2.11. Fossil diesel
Defining in SimaPro® the fossil diesel consumption required to fulfil 1FU was served by the available libraries. The selected processes for fossil diesel chain modelling were:
− crude oil production and transport; − diesel production in refinery;
− diesel distribution and local storage.
2.2.3. Scenarios
2.2.3.1. Scenario A
This scenario modelled the production of biogas from J. curcas seed cake by anaerobic digestion and the return of the resulting slurry to the field to serve as fertilizer. This motivates redefinition of system and reference systems’ boundaries in order to embrace the added process. Hence, the by-products, biogas and slurry, and their functionally equivalent products were included to the systems’ expanded boundaries (figure 14).
Figure 14 – System boundaries for scenario A production model.
It was estimated that the anaerobic digestion of 1kg seed cake yields an average of 0.394 m3 of biogas (SD = 0.14) (Chandra et al., 2006; Achten et al., 2008) and 0.25 kg of slurry (Fobelets, 2009). The yielding biogas should be expected to exhibit circa 55% methane (Visser and Adriaans, 2007), fitting the admittedly normal characteristics of biogas with density = 1.2 kg/m3 and low heating value (LHV) = 5-7 kWh/m3 (Speight, 2008).
It was, therefore, determined that the biogas production of seed cake yields: − 1038.9 m3 biogas/t oil;
− 659.7 kg slurry/t oil.
Figure 15 – Seed cake to biogas and slurry process scheme.
Biogas production from seed cake implies avoiding the production of biogas and slurry functionally equivalent products: natural gas and artificial fertilizer (NPK), respectively. It is assumed that the slurry has approximately the same nutrient content as the seed cake (Fobelets, 2009), which means that 1 kg of slurry equals 0.15 kg of NPK. Moreover, the natural gas should be energetically equivalent to the produced biogas and it is know that its LHV is 34.6 MJ/m3 (bioenergy.ornl.gov). Hence, the amounts of avoided NPK and natural gas were calculated as follows:
2.2.3.2. Scenario B
This scenario replaced local consumption of J. curcas biodiesel for a situation of biodiesel exporting and consumption in Europe. Two end-use European locations were chosen: Belgium and Portugal.
Hence, the transport steps protocol previously described (see section 2.2.2.10) was resumed with the subsequently described steps.
The biodiesel should take the three forms of transportation to reach its destination. The environmental burdens of transporting the biodiesel to Europe were attributed to the end-use phase.
2.2.3.3. Scenario C
Centralized production, assessed in this scenario, implied the transport of seeds to a main city for oil extraction and refining and JME production. The energy content is used through pelletizing and combustion for electricity generation (figure 16).
Figure 16 – Scenario C system boundaries. The pelletizing of seed cake for electricity generation purposes brings up a different reference system equivalent: electricity from coal.
Once again, the same judgment and tools described in the transport steps protocol were used in order to calculate road and rail distances between the plantations and the main cities in their countries/states. Oil extraction is, in this manner, burdened with the seed’s haulage from the field to the mill.