Optimizing Lifetime Condition and Reliability of Deteriorating Structures
with Emphasis on Bridges
Aruz Petcherdchoo1, Luis C. Neves2, and Dan M. Frangopol3, Fellow ASCE 1
PhD, Formerly, Department of Civil, Environmental, and Architectural Engineering, University of Colorado, Boulder, CO 80309-0428, [email protected]
2
Assistant Professor, Department of Civil Engineering, University of Minho 4800-058 Guimares, Portugal, [email protected]
3
Corresponding Author; Professor, Department of Civil, Environmental, and Architectural Engineering, University of Colorado, Boulder, CO 80309-0428, [email protected]
ABSTRACT: Deterioration mechanisms of existing structures have been identified and studied over the last decades. Uncertainties associated with mechanical loadings and environmental
stressors make it difficult to accurately predict the life-cycle performance of these structures. In
general, deteriorating structures are maintained by periodical interventions based on their
condition states. Available resources are limited and maintenance decisions resulting from
management systems concentrating on condition states of deteriorating structures are not always
cost-effective. Therefore, the need for reliability-based structure management is evident. Models
for time-based and performance-based (condition-based or reliability-based) maintenance
strategies are applied in this study to a deteriorating bridge in Colorado. Several maintenance
interventions are considered and combined. Realistic data consisting of condition, reliability, and
cost of maintenance actions are used. Finally, the optimum maintenance strategy considering
condition, reliability and cost is selected based on different criteria.
Keywords: condition, reliability, deteriorating structures, bridges, maintenance, optimization
INTRODUCTION
In March 2001, ASCE released a Report Card for America's Infrastructure (ASCE 2001) grading
12 infrastructure categories at a discouraging D+ overall and estimating the need for a $1.3
trillion investment to bring conditions to acceptable levels. The 2001 ASCE’s Report Card for
America’s Infrastructure (ASCE 2001) estimated that it will cost $10.6 billion per year for 20
years to eliminate all bridge deficiencies. Similar statements were made in the 2005 ASCE’s
Report Card where the nation’s infrastructure received a discouraging D. As a result of the state
of existing structures, in particular bridges, bridge management systems (BMS) became a active
field of research in the last decade. The objective of BMS is to assist decision-makers in the
process of selecting the minimum expected life-cycle cost solution, maintaining the desired
levels of reliability and serviceability of existing bridges. In this manner, the limited available
budgets can be put to the best possible use.
In this paper, a model for the analysis of deteriorating structures under maintenance,
considering the uncertainties in deterioration, effects of maintenance actions, and times of
applications of maintenance actions is used. This model, originally developed by Frangopol
(1998) and enhanced by Frangopol et al. (2001) and Neves and Frangopol (2005) defines the
performance of structures in terms of the time-dependent condition, reliability, and cumulative
cost profiles. Each of these profiles is characterized by a set of random variables, including the
effects of deterioration and maintenance actions on structural performance indicators. In this
manner, it is possible to apply a common model to a wide variety of deteriorating structures by
approach results in a model capable of taking into account, in a consistent manner, incomplete
and/or inaccurate information.
The model is applied to an existing bridge in Colorado. The detailed analysis performed by
Akgül (2002) and Akgül and Frangopol (2004) along with information provided by CDOT
(1998), Denton (2002), and Maunsell (1999), allows the adequate use of the performance
deterioration model, as well as the quantification of the effects of maintenance actions.
CONDITION, RELIABILITY, AND COST INTERACTION
In this paper, the performance is defined in terms of condition, reliability, and cumulative
costs, based on the model proposed by Frangopol (1998) and enhanced by Frangopol et al.
(2001) and Neves and Frangopol (2005). Performance under no maintenance is defined in terms
of (a) initial condition index and initial reliability index; (b) time of initiation of deterioration of
condition and time of initiation of deterioration of reliability; and (c) deterioration rate of
condition index and deterioration rate of reliability index. The effects of maintenance actions are
modeled considering (a) improvement in condition index and improvement in reliability index
immediately after application of maintenance; (b) a period after maintenance application during
which there is no deterioration of condition index and no deterioration of reliability index: and
(c) a period after maintenance application during which the deterioration rate of condition index
and the deterioration rate of reliability index are reduced compared to the no maintenance case.
This model is defined by a set of random variables described in Neves and Frangopol (2005).
The model is able to consider based, performance-based, and a combination of
applied at regular time intervals, irrespective of performance at time of application.
Performance-based maintenance actions are applied when a performance threshold is reached.
Two sets of data (performance profiles and maintenance data) are necessary for the
application of the developed model. The reliability index profile is adopted from Akgül (2002),
and the condition index profile is assumed consistent with the reliability index profile,
considering the condition states defined in Pontis (CDOT 1998). The maintenance data is based
on Maunsell (1999), Denton (2002), Pontis (CDOT 1998), and Furuta et al. (2004). With these
two sets of data, the applicability of the developed concept to an existing bridge in Colorado
(Bridge E-17-LE) will be demonstrated. The results in terms of condition index profiles,
reliability index profiles, and both mean values and percentiles of total maintenance cost are
provided.
RELIABILITY INDEX PROFILES FOR SLAB AND GIRDER OF AN
EXISTING BRIDGE
A detailed description of Colorado Highway Bridge E-17-LE can be found in Akgül (2002). The
bridge was constructed in 1972, and is located over Interstate Highway 25 on 88th Avenue,
between US Highway 36 and State Highway 128, in Adams County. It is designated as a two
span Welded Girder Continuous Composite type in the Colorado Department of Transportation
Field Log of Structures. The total length of the bridge is 68.62m (225 ft) between centerlines of
the abutment bearings, and the total width is 19.67m (64.5 ft) which includes a clear roadway
opening of 15.86m (52 ft) from curb to curb. The deck carries the traffic on a reinforced concrete
reinforced concrete slab is supported by eleven steel welded composite plate girders. The
superstructure of this bridge is composed of two types of components (i.e., slab and girder). The reliability of the slab is estimated based on considering only a flexural failure mode at a
critical section, and the reliability of the girder is estimated based on considering both flexural
and shear failure modes at their critical sections. The system reliability of the girder is estimated
based on flexure, shear, or a combination of flexure and shear. Using these assumptions and
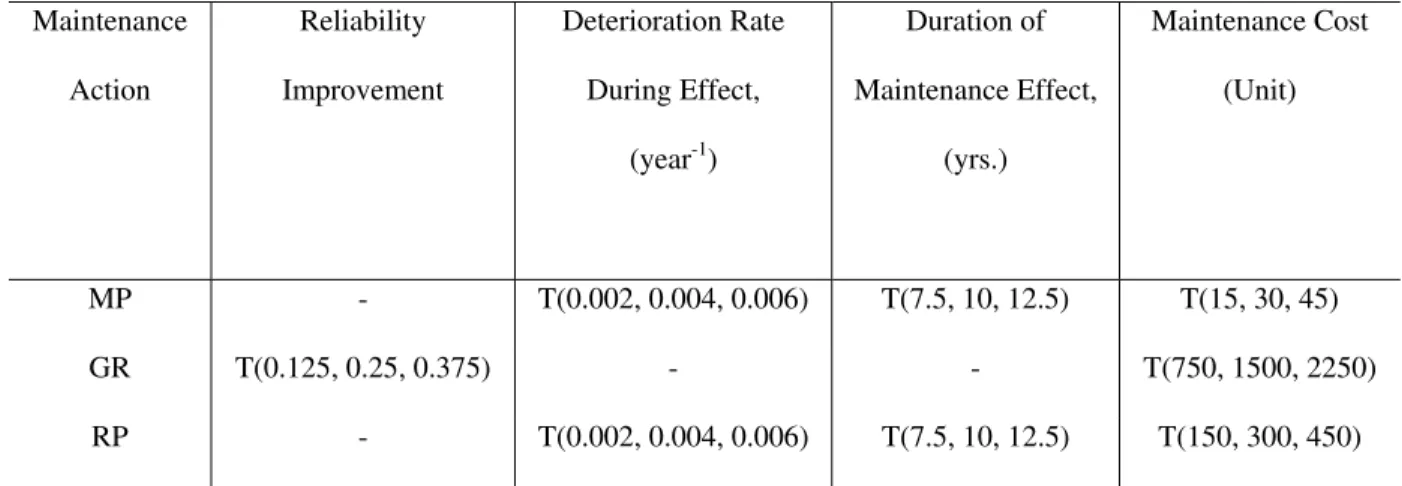
sources of data, Akgül (2002) calculated the reliability index profile of slab and girder for 50
years as shown in Figure 1. The white circle and the dark square represent the calculated
reliability indices of slab and girder, respectively, reported in Akgül (2002). The solid and the
dashed lines represent the reliability index profiles of slab and girder, respectively, considered in
this study, obtained using linear regression. In approximating the profiles, the data from the
analysis at the beginning of the life is conservatively ignored. These points reflect the evolution
over time of the maximum likely load. Therefore, they are not associated with the deterioration
process under analysis herein. Figure 1 shows that the reliability index deterioration profiles of
the slab and the girder without maintenance are close to linear and can be approximated,
respectively, as:
t 2.880.077t, S
t0 (1)
t 2.900.005t, G
t0 (2)
where S
tand G
trepresent the reliability index at time t for slab and girder, respectively.
In a general form, (1) and (2) can be written as
t 0S St,S
t0 (3)
t 0 t,G G
G
where S
0
and G
0
represent the initial (at time t = 0) reliability index for slab and girder,
respectively, and S and G represent the reliability index deterioration rate (year-1) for slab
and girder, respectively.
The target reliability index, which is a value indicating the urgent need for application of an
essential maintenance, is assumed to be 2.0 for both slab and girder, approximately indicating the
probability of failure of 2.28%. Therefore, the reliability index profile for the slab crosses its
target value at year 11.43, and that for girder will never cross its target value during the 50 year
time horizon.
C
ONDITIONI
NDEXP
ROFILES FORS
LAB ANDG
IRDER OF ANE
XISTINGB
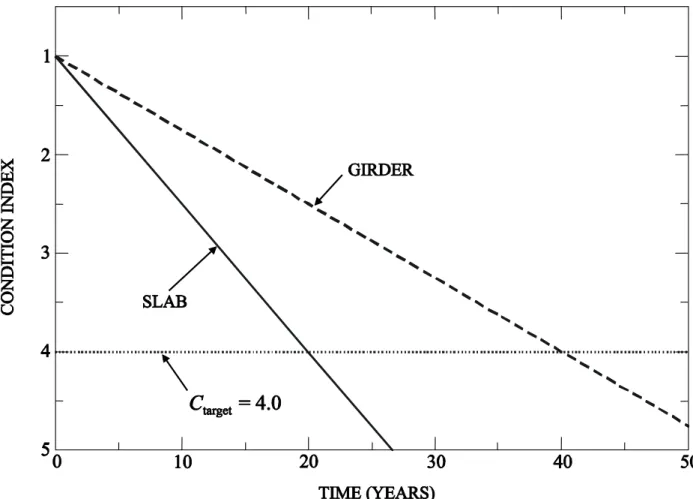
RIDGESimilarly to the reliability index profile, two condition index profiles of the bridge (i.e., the
profiles for slab and girder) are considered. The condition indices for the slab and the girder of
the bridge are similar to the corresponding states defined in Pontis (CDOT 1998).
The steel girder (or Element 107) in Pontis (CDOT 1998) describes painted open girders. For this
component, the condition and the feasible maintenance actions are defined in CDOT (1998).
The time-dependent condition index profiles for slab and girder are assumed linear and can
be expressed in a general form as
( )
0 ,S S S
C
C t =C +a t
t0 (5)
( )
0 ,G G G
C
where S
tC and G
tC represent the condition index at time t for slab and girder, respectively,
S
C0 and G
C0 represent the initial (at time t = 0 ) condition index for slab and girder, respectively,
and S C
and G C
represent the condition index deterioration rate (year-1) for slab and girder,
respectively.
According to Pontis (CDOT 1998), the initial condition index for slab and girder can be
assumed equal to 1. The target condition index, which is a value indicating the need for urgent
application of an essential maintenance, is assumed to be 4.0 for slab and girder. The condition
index deterioration rate for slab is assumed to be 0.15 per year so that the condition index profile
crosses the target condition index later than the reliability index. Hence, the condition index
profile for slab crosses its target value at year 20. The condition index deterioration rate for
girder is assumed to be 0.075 per year so that the condition index profile crosses the target
condition index earlier than the reliability index does. Hence, the condition index profile for
girder crosses its target value at year 40. Therefore, the condition index profile for slab and
girder can be written, respectively, as
( )
1 0.15 ,S
C t = + t
t0 (7)
( )
1 0.075 ,G
C t = + t
t0 (8)
The condition index profiles of slab and girder for 50 years are shown in Figure 2.
The reliability index and condition index profiles for slab and girder presented in Figures 1
and 2 are deterministic. However, due to the presence of uncertainties, these profiles must be
defined in a probabilistic framework. It is assumed that the values defining the profiles in (1),
and safety index of existing structures in the United Kingdom (Denton 2002) suggest that
triangular probability density functions are the most adequate to model the parameters of the
proposed method (Neves and Frangopol 2005). By assuming that the coefficient of variation of
the variables is 10%, the probabilistic indicators of the parameters defining the performance of
slab and girder can be estimated as shown in Tables 1 and 2, respectively. It is noted that the
initial condition index for slab and girder is assumed deterministic, 0S 0G 1 C
C .
MAINTENANCE DATA
In this section, the maintenance data for the slab and the girder of the bridge E-17-LE is
presented.
Maintenance Data for Slab
There are three fundamental maintenance actions for slab (i.e., Silane Treatment, Slab Repair,
and Slab Replacement) as shown in Table 3. The Silane Treatment is defined in Maunsell (1999)
and Denton (2002), and Slab Repair and Slab Replacement are defined in Pontis (CDOT 1998).
Slab Repair is defined in accordance with the feasible action in the condition state between 3 and
5 in Pontis (CDOT 1998). Slab Replacement is defined in accordance with the feasible action in
condition state 5 in Pontis.
The times of application of the three maintenance actions considered are shown in Table 3.
Silane treatment is defined as a preventive maintenance action, applied at regular time intervals
slab replacement (SRL) are defined as essential maintenance actions, applied with the
performance violates pre-defined thresholds. SRA is applied with the condition index reaches C
= 4.0 and SLR is applied when the reliability index reaches = 2.0. The application of the first
of these essential maintenance actions guarantee that the probability of the condition index being
higher (i.e., worst) than the defined threshold is null. The second essential maintenance action
reduces to zero the probability of the reliability index reaching values lower than the threshold.
The time interval between applications of silane is selected considering that, for economical
reasons, maintenance should rarely be applied before the end of the effect of the previous
application. Slab repair is defined as a more frequent maintenance action, performed before the
safety of the structure decreases significantly. The replacement of the slab is, on the other hand, a
maintenance action applied less frequently, and only when the reliability of the structure is at
stake.
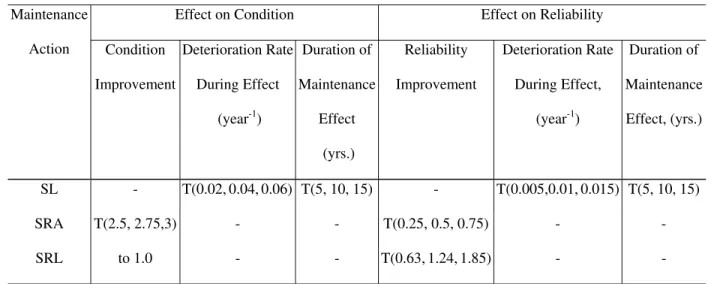
The effects of each of the above three maintenance actions on the condition index and on the
reliability index are shown in Table 4.
The application of Silane results in a reduction of the deterioration rate of both condition and
safety. No improvement in the condition index or safety index is considered, as Silane does not
improve the resistance of the slab, or correct existing defects.
The repair of the slab (SRA) causes a significant improvement of the condition of the slab.
This repair is assumed to occur only at the surface of concrete, not including replacement of all
reinforcement bars. For this reason, there is only a small improvement in the safety of the
structure. Since this replacement corrects existing cracks and reduces the chloride contamination
Using the three maintenance actions previously defined (i.e., SL, SRA and SRL), six
maintenance strategies for slab are proposed. These include strategies consisting of one
maintenance action (SL, SRA and SRL), the combination of silane with one essential
maintenance action (SL+SRA and SL+SRL), and the combination of the three maintenance
actions (SL+SRA+SRL).
Maintenance Data for Girder
There are three fundamental maintenance actions for girder (i.e., Minor Painting, Girder Repair,
and Replace Painting) as shown in Table 5. Minor Painting(MP) and Replace Painting(RP) are
based on the feasible action recommended for Element 107 in Pontis (CDOT 1998). Girder
Repair (GR) is based data presented in Furuta et al. (2004). Minor Painting is defined in a similar
manner to the feasible action in the condition states 2 to 4 in Pontis (CDOT 1998).
The times of application of these maintenance actions are also shown in Table 5. MP is a
time-based preventive maintenance action and GR and RP are condition-based maintenance
actions. In fact, the reliability index profile of girder is very high and, consequently, the
probability of the reliability profile down-crossing the defined threshold during the 50 years time
horizon is very small, severely reducing the impact of any reliability-based maintenance action.
The two condition-based maintenance actions are very different in terms of their impact on
the performance of the structure as well as of their cost. Replacing the painting system causes a
smaller impact on condition and is associated with no improvement in the reliability index at
On the other, the repair of the girder causes a more significant improvement in condition, as
well as an increase in the reliability index. It is also associated with a higher application cost.
The effects of the maintenance actions on the condition index, reliability index and the
maintenance cost are indicated in Tables 6 and 7 (Petcherdchoo 2004). The maintenance effects
and the costs of Minor Painting, Girder Repair, and Replace Painting are assumed (Petcherdchoo
2004) based on engineering judgments and the information obtained from Denton (2002).
Based on the three maintenance actions considered (i.e., MP, GR, and RP), five maintenance
strategies for girder are defined, including MP, GR, RP, MP+GR and MP+RP. It is observed that
each of those five maintenance strategies consists of one maintenance actions or the combination
of two actions.
The maintenance data for slab and girder of the E-17-LE bridge is estimated based on
engineering judgment and available references including Maunsell (1999), Denton (2002), Pontis
(CDOT 1998), and Furuta et. al. (2004). This data is combined with the data on condition and
reliability index profiles under no maintenance for obtaining the condition and reliability index
profiles under maintenance, as well as the cumulative maintenance cost profile are presented in
the next section.
RESULTS
In the previous sections, the condition index and the reliability index deterioration profiles and
the maintenance data for slab and girder of the bridge E-17-LE were described. The condition
index, reliability index and cumulative cost profiles are computed using Monte Carlo simulation
there are two bridge components considered (i.e., slab and girder), the results are separated into
two parts as follows.
Condition and Reliability Index Profiles and Maintenance Cost for Slab
For the slab, the mean of condition index and the mean of reliability index profiles without
and with maintenance are shown in Figure 3 and Figure 4, respectively. Under no maintenance,
the mean values of condition and reliability index profiles cross the target condition index of 4.0
close to year 20 and the target reliability index of 2.0 near year 12, respectively.
Under maintenance, the condition and reliability index profiles improve significantly. Silane
alone causes a reduction in the deterioration rate of the mean condition index and mean safety
index. However, even considering application of silane, the mean condition and safety indices
violate the prescribed thresholds very early. All other strategies lead to a much higher
improvement in the mean condition index, resulting in mean profiles that do not violate the
defined thresholds.
Slab replacement, applied alone, causes a significant improvement in the condition index. As
stated previously, under no maintenance, the mean condition index profile violates the condition
threshold after only 20 years. However, since the parameters considered in the model are
probabilistic, the threshold has a positive probability of being violated between years 15 and 23.
Consequently, it is during this period that slab repair is applied for the first time, causing a more
significant impact on the condition index and safety index profiles. After this application of slab
repair, there will a period during which the threshold is not violated. After 31 years, slab repair is
profiles. The life-cycle performance of the structure under application of slab replacement
follows a similar trend. However, since the reliability threshold is reached earlier in the life of
the structure, the improvement in the performance profiles occur earlier.
When Silane is combined with slab repair, the reduction in the deterioration rate caused by
the preventive maintenance action postpones the application of slab replacement. This can be
observed in the later improvement of the condition index, if Silane and SRA are applied
simultaneously.
Analysis of the life-cycle reliability index profiles yields similar results. However, since all
maintenance actions have a smaller impact on the reliability of the structure, the effects of all
strategies of the life-cycle performance are less dramatic than those observed for the condition
index profile.
The cost of maintenance actions can be represented in terms of the mean and the percentiles
of cumulative maintenance cost for 0% and 6% discount rates of money as shown in Figure 5.
The use of the mean cumulative cost is usually preferred in optimizing maintenance strategies.
This is often an adequate choice since, when a large set of structures is being analyzed, the total
cost associated with all bridges converges to the sum of the mean costs.
However, if a small set of structures is being analyzed, the final cost can be significantly
higher than the sum of the mean of all costs, as a result of the uncertainty in all the parameters
considered. For this reason, the life-cycle cumulative costs are, in this work, compared not only
in terms of their mean, but also of their percentiles. These provide the bridge manager a tool to
make decisions considering the level of risk, in terms of costs.
For selecting an optimum maintenance strategy for slab, the condition and the reliability
First of all, Silane (SL), Slab Repair (SRA), and SL+SRA are unsatisfactory from the condition
or reliability viewpoints. Therefore, they will not be taken into consideration for the optimum
maintenance strategy. Therefore, based on the mean and 50-percentile of cumulative
maintenance cost, the optimum maintenance strategy for the slab is SL+SRL for both 0% and 6%
discount rates. Based on 95-percentile of cumulative maintenance cost, the optimum
maintenance strategy is SL+SRA+SRL for 0% discount rate, and that is SL+SRL for 6%
discount rate. This shows the importance of the discount rate which may change the optimum
strategy.
In other words, although SL + SRL is, in general, the optimal solution, it is also associated
with a larger dispersion of the life-cycle cost. If the decision maker prefers a strategy with a very
low probability of exceeding a certain budget, the use of other strategy (e.g., SL + SRA + SRL)
might be more adequate.
Condition and Reliability Index Profiles and Maintenance Cost for Girder
For the girder, the mean condition index and mean reliability index profiles under no
maintenance, preventive maintenance and essential maintenance are shown in Figure 6 and
Figure 7, respectively. Under no maintenance, the mean of the condition index profile crosses the
target condition index of 4.0 close to year 40, and that of the reliability index profile never
crosses the target reliability index of 2.0 within the 50 years time horizon.
Under maintenance there is a significant improvement on the condition index profiles. Being
early, as can be observed in the profiles associated with maintenance strategies that include this
action (MP, MP + GR, and MP + RP).
The effect of GR and RP is only significant at a later stage, since the probability of violating
the condition threshold is only positive after year 31. Since each application of GR causes a more
significant improvement in condition, strategies including this maintenance action cause a more
dramatic change in the condition index profile. In terms of mean condition, all strategies except
minor painting, keep the mean profile from violating the prescribed thresholds.
Considering the small deterioration of reliability over the entire time horizon under no
maintenance, all strategies have a small impact of this performance indicator, in the case of the
girder.
The cost of maintenance actions can be represented in terms of the mean and the percentiles
of cumulative maintenance cost for 0% and 6% discount rates as shown in Figure 8.
For selecting an optimum maintenance strategy for girder, the condition and the reliability
index profiles, and the mean and the percentiles of cumulative maintenance cost must be
considered. First of all, it should be noted that all maintenance strategies are considered
acceptable (except Minor Painting), although some of them do not satisfy condition or reliability
thresholds in a sample-level sense. Therefore, the optimum maintenance strategy for girder with
0% discount rate is MP+RP based on the mean and 50-percentile, or RP based on 95-percentile.
This implies that both the mean and the percentiles of cumulative cost should play an important
role in considering an optimum strategy. For 6% discount rate, RP is the optimum strategy.
CONCLUSIONS
1. Deteriorating structures can be assessed in terms of condition and reliability. This requires a
careful consideration and evaluation of the associated uncertainties. Available data and
engineering judgment provide valuable information for the evaluation of these uncertainties.
2. Optimizing lifetime condition and reliability of deteriorating structures under uncertainty and
budget constraints is an active field of research. The purpose is to minimize the total expected
maintenance cost of deteriorating structures over a prescribed time horizon by finding the best
maintenance strategy.
3. To insure that the condition and reliability are not violating prescribed thresholds during a
specified time horizon a complex time-dependent probabilistic analysis is necessary including
probabilistic description of maintenance actions.
4. The use of only a single-type of maintenance action within each strategy is, in general, not
cost-effective and can also lead to inadmissible results. For this reason, the combination of
different maintenance types within each strategy is, in general, recommended.
ACKNOWLEDGMENTS
The partial financial support of the UK Highways Agency, the US National Science Foundation
through grants CMS-0217290 and CMS-0509772, and the Netherlands Ministry of Transport,
conclusions presented in this paper are those of the writers and do not necessarily reflect the
views of the sponsoring organizations.
REFERENCES
Akgül, F. (2002). “Lifetime System Reliability Prediction of Multiple Structure Types in a
Bridge Network,” PhD Thesis, University of Colorado at Boulder, Boulder, Colorado.
Akgül, F., and Frangopol, D.M. (2004). “Lifetime Performance Analysis of Existing Steel Girder
Bridge Superstructures,” Journal of Structural Engineering, ASCE, 130(12), pp. 1875-1888.
American Society of Civil Engineers (ASCE) (2001). “2001 Report Card for America’s
Infrastructure,” Reston, Virginia, www.asce.org/reportcard.
Colorado Department of Transportation (CDOT) (1998). “Pontis Bridge Inspection Guide,” Staff
Bridge Branch, Colorado Department of Transportation.
Denton, S. (2002). “Data estimates for different maintenance options for reinforced concrete
cross-heads,” (Personal communication for Highways Agency, U.K.). Parsons Brinckerhoff Ltd.,
Bristol, U.K.
Frangopol, D.M. (1998). “A Probabilistic Model Based on Eight Random Variables for
Preventive Maintenance of Bridges,” Presented at the November 21, 1998, Progress Meeting on
Frangopol, D.M., Kong, J.S., and Gharaibeh, E. S. (2001). “Reliability-based Life-cycle
Management of Highway Bridges, ”J Comput Civil Engng, ASCE, Vol. 15 (1), pp. 27–34.
Furuta, H., Kameda, T., Fukuda, Y., and Frangopol, D.M. (2004). “Life-cycle cost analysis for
infrastructure systems: Life cycle cost vs. safety level vs. service life.” Keynote paper in
Life-Cycle Performance of Deteriorating Structures: Assessment, Design and Management, D.M.
Frangopol, E. Brühwiler, M.H. Faber and B. Adey, eds., ASCE, Reston, Virginia, 19-25.
Maunsell Ltd. (1999). “Serviceable Life of Highway Structures and Their Components,” Report
to the Highways Agency, London U.K.
Neves, L.C. and Frangopol, D.M. (2005) “Condition, Safety and Cost Profiles for Deteriorating
Structures with Emphasis on Bridges,” Reliability Engineering and System Safety, Elsevier,
89(2), pp. 185-198.
Petcherdchoo, A., (2004) “Maintaining Condition and Safety of Deteriorating Bridges by
Probabilistic Models and Optimization,” PhD Thesis, University of Colorado at Boulder,
Boulder, Colorado.
van Noortwijk, J.M. and Frangopol, D.M. (2004). "Two Probabilistic Life-Cycle
MaintenanceModels for Deteriorating Civil Infrastructures," Probabilistic Engineering
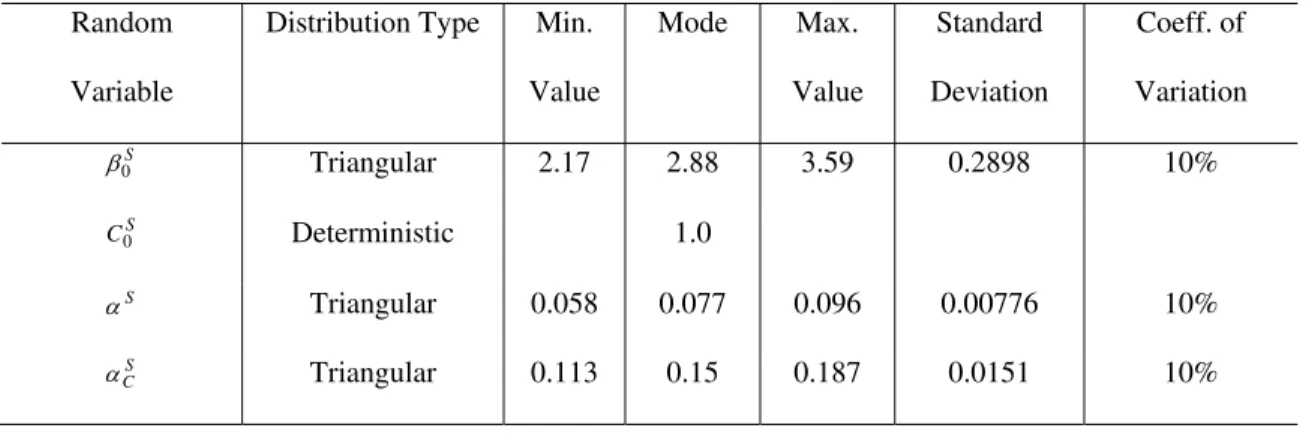
Table 1 Descriptors of random variables for reliability and condition indices of slab
Random
Variable
Distribution Type Min.
Value
Mode Max.
Value
Standard
Deviation
Coeff. of
Variation
S
0
Triangular 2.17 2.88 3.59 0.2898 10%
S
C0 Deterministic 1.0
S
Triangular 0.058 0.077 0.096 0.00776 10%
S C
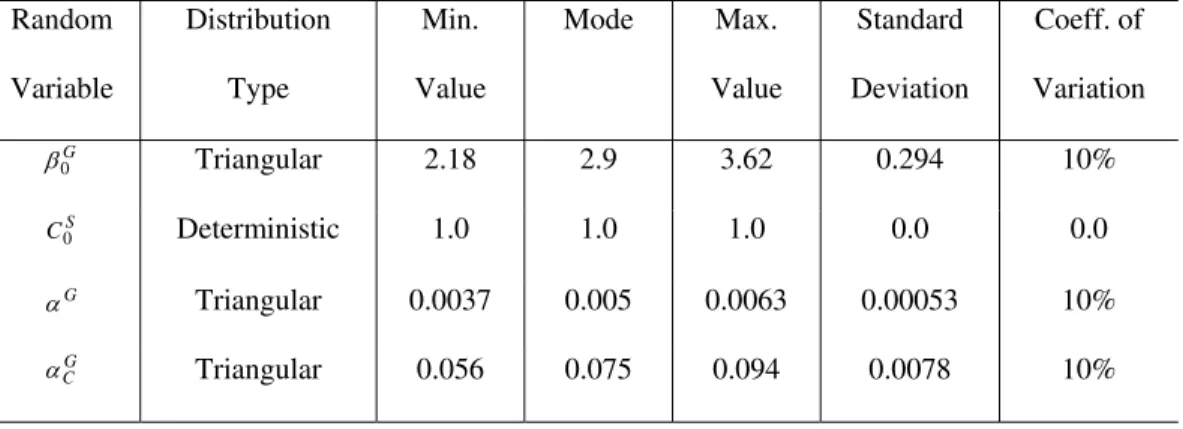
Table 2 Descriptors of random variables for reliability and condition indices of girder
Random
Variable
Distribution
Type
Min.
Value
Mode Max.
Value
Standard
Deviation
Coeff. of
Variation
G
0
Triangular 2.18 2.9 3.62 0.294 10%
S
C0 Deterministic 1.0 1.0 1.0 0.0 0.0
G
Triangular 0.0037 0.005 0.0063 0.00053 10%
G C
Table 3 Cost and time of first and subsequent applications of maintenance actions for slab
Maintenance
Action
Notation Definition of Maintenance
Action
Time of First
Application
(yrs.)
Time of
Subsequent
Application (yrs.)
Maintenance Cost
(Unit)
Silane
Treatment
SL
Chemical maintenance actions
to prevent contamination to
concrete (Denton 2002, Furuta
et al. 2004)
T(0, 7.5, 15) T(10, 12.5, 15) T(5, 10, 15)
Slab Repair SRA
Repair and/or replace substrate
and/or overly (CDOT 1998)
when C = 4.0 when C = 4.0 T(500, 1000, 1500)
Slab
Replacement
SRL Replace deck (CDOT 1998) when = 2.0 when = 2.0 T(1000,2000, 3000)
Note: C = Condition Index, and = Reliability Index
Table 4 Effect of maintenance action on condition index and reliability index of slab
Maintenance
Action
Effect on Condition Effect on Reliability
Condition
Improvement
Deterioration Rate
During Effect
(year-1)
Duration of
Maintenance
Effect
(yrs.)
Reliability
Improvement
Deterioration Rate
During Effect,
(year-1)
Duration of
Maintenance
Effect, (yrs.)
SL - T(0.02,0.04,0.06) T(5, 10, 15) - T(0.005,0.01,0.015) T(5, 10, 15)
SRA T(2.5, 2.75,3) - - T(0.25, 0.5, 0.75) - -
SRL to 1.0 - - T(0.63, 1.24, 1.85) - -
Table 5 Definition and maintenance actions for girder
Maintenance
Action
Notation Reference Defining
Maintenance Action
Definition of Maintenance
Action
Time of First
Application
(yrs.)
Time of
Subsequent
Application
(yrs.)
Minor Painting MP Pontis (CDOT 1998) Spot Blast, clean, and paint T(0, 7.5, 15) T(10, 12.5, 15)
Girder Repair GR Furuta et. al. (2004) Steel plate attaching when C = 4.0 when C = 4.0
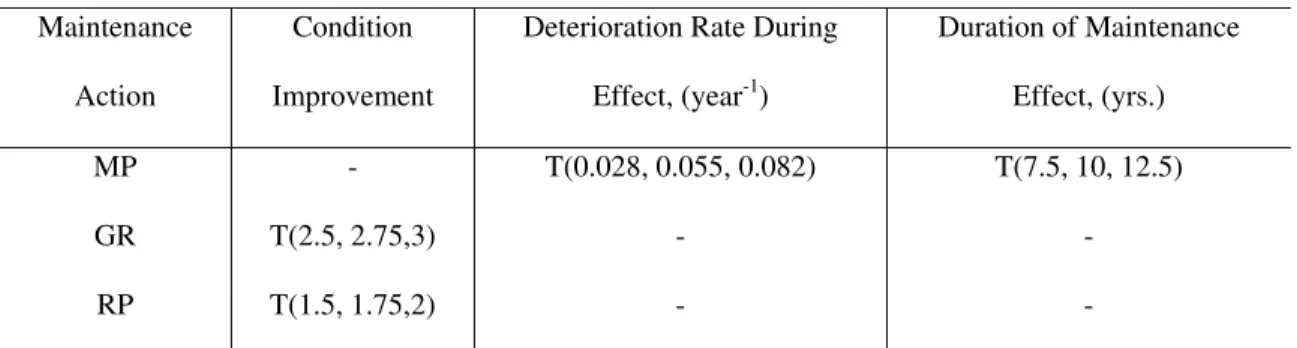
Table 6 Effect of maintenance action on condition index of girder
Maintenance
Action
Condition
Improvement
Deterioration Rate During
Effect, (year-1)
Duration of Maintenance
Effect, (yrs.)
MP - T(0.028, 0.055, 0.082) T(7.5, 10, 12.5)
GR T(2.5, 2.75,3) - -
RP T(1.5, 1.75,2) - -
Table 7 Cost and effect of maintenance action on reliability index of girder
Maintenance
Action
Reliability
Improvement
Deterioration Rate
During Effect,
(year-1)
Duration of
Maintenance Effect,
(yrs.)
Maintenance Cost
(Unit)
MP - T(0.002, 0.004, 0.006) T(7.5, 10, 12.5) T(15, 30, 45)
GR T(0.125, 0.25, 0.375) - - T(750, 1500, 2250)
RP - T(0.002, 0.004, 0.006) T(7.5, 10, 12.5) T(150, 300, 450)
FIGURECAPTIONS
Figure 1 Reliability index profile for slab and girder without maintenance
Figure 2 Condition index profile for slab and girder without maintenance
Figure 3 Mean of condition index of slab for all strategies
Figure 4 Mean of reliability index of slab for all strategies
Figure 5 Mean, 50-, and 95-percentiles of cumulative maintenance cost with (a) discount rate =
0% and (b) discount rate = 6% at year 50 for slab
Figure 6 Mean of condition index of girder for all strategies
Figure 7 Mean of reliability index of girder for all strategies
Figure 8 Mean, 50-, and 95-percentiles of cumulative maintenance cost with (a) discount rate =
0 10 20 30 40 50 TIME (YEARS)
0 1 2 3 4 5
RELIABILITY INDEX
GIRDER :
ANALYSIS [AKGUL(2002)] APPROXIMATION
SLAB :
APPROXIMATION
ANALYSIS [AKGUL(2002)] [β(t) = 2.9 - 0.005t]
[β(t) = 2.88 - 0.077t]
0 10 20 30 40 50 TIME (YEARS)
1
2
3
4
5
MEAN OF CONDITION INDEX Ctarget= 4
MEAN OF CONDITION INDEX
NO MAINTENANCE
SL : SILANE
SRA : SLAB REPAIR
SRL : SLAB REPLACEMENT
SL
SRA SRL
SL + SRA SL + SRL SL + SRA + SRL 50,000 SAMPLES
0 10 20 30 40 50 TIME (YEARS)
0 1 2 3 4
MEAN OF RELIABILITY INDEX
βtarget = 2
MEAN OF RELIABILITY INDEX
NO MAINTENANCE
SL : SILANE
SRA : SLAB REPAIR
SRL : SLAB REPLACEMENT
SL + SRL
SL + SRA
SL + SRA + SRL
SL SRA
SRL 50,000 SAMPLES
SL SRA SRL SL+SRA SL+SRL SL+SRA+SRL 0
2000 4000 6000 8000 10000 12000
Cum
u
lat
ive Maint
e
nance Cost
Maintenance Strategy
Mean
50-Percentile
95-Percentile
Discount rate = 0%
SL SRA SRL SL+SRA SL+SRL SL+SRA+SRL 0
1000 2000 3000
Cu
mu
la
ti
ve Ma
inten
ance
Co
st
Maintenance Strategy Mean
50-Percentile 95-Percentile Discount rate = 6%
(b)
Figure 5 Mean, 50-, and 95-percentiles of cumulative maintenance cost with (a) discount rate =
0 10 20 30 40 50 TIME (YEARS)
1
2
3
4
5
MEAN OF CONDITION INDEX Ctarget= 4
MEAN OF CONDITION INDEX
NO MAINTENANCE
MP : MINOR PAINTING GR : GIRDER REPAIR RP : REPLACE PAINTING
MP GR
RP
MP + GR MP + RP
50,000 SAMPLES
0 10 20 30 40 50 TIME (YEARS)
0 1 2 3 4
MEAN OF RELIABILITY INDEX
βtarget = 2
MEAN OF RELIABILITY INDEX
NO MAINTENANCE
MP : MINOR PAINTING GR : GIRDER REPAIR RP : REPLACE PAINTING
MP + RP
MP + GR MP
GR
RP
50,000 SAMPLES
MP GR RP MP+GR MP+RP 0
1000 2000 3000
Cumulat
ive Maint
enance Cost
Maintenance Strategy Mean
50-Percentile 95-Percentile Discount rate = 0%
MP GR RP MP+GR MP+RP 0
100 200 300 400
Cumulat
iv
e
Maint
enance Cos
t
Maintenance Strategy
Mean
50-Percentile
95-Percentile
Discount rate = 6%
(b)
Figure 8 Mean, 50-, and 95-percentiles of cumulative maintenance cost with (a) discount rate =