Pedro Garcia Ferreira
Degree in Pharmacy
Insights into human carboxylesterase 2
stability and activity
in vivo
and
in vitro
Dissertation to obtain a Master Degree in Biotechnology
Supervisor: Ana Luisa Simplício, Ph. D, IBET/ITQB-UNL
Júri:
Presidente: Prof. Doutor Carlos Alberto Gomes Salgueiro
Arguente: Prof. Doutor Pedro Miguel Ribeiro Viana Batista
Vogal: Doutora Ana Luisa Simplício
September 2012
“Insights into human carboxylesterase 2 stability and activity in vivo and in vitro”
Copyright Pedro Garcia Ferreira, FCT/UNL, UNL
i
Acknowledgments
Em primeiro e principal lugar gostaria de agradecer à Dra. Ana Luisa Simplício, responsável pelo laboratório de Farmacocinética e Analise Biofarmacêutica, por uma vez mais me ter dado a oportunidade de levar a cabo um trabalho académico essencial para a minha formação, e principalmente pela grande disponibilidade para ajudar, dar conselhos ou mesmo motivação e incentivo para continuar o trabalho.
Agradeço também à Joana Lamego e Bárbara Cunha, pelo tempo despendido a ajudar-me e a explicar tudo o que fosse necessário, e até pelas perguntas incisivas que fazem mesmo uma pessoa pensar!
À equipa do laboratório de Nutracêuticos e Libertação Controlada, nomeadamente Dra. Teresa Serra, Sara Nunes, Joana Poejo e Ana Nunes, onde parte do trabalho foi realizado, agradeço também a grande disponibilidade, ajuda e sempre bom ambiente.
Aos amigos ITQBianos André, Daniel, João e Rita pela companhia, momentos de descontracção e distração do trabalho.
E à minha família e amigos, especialmente pais e irmão pela constante motivação para concluir o trabalho e por nunca duvidarem que os meus objectivos seriam atingidos.
iii
Abstract
Due to its role in ester containing xenobiotics metabolization, such as the activation of pro-drugs, carboxylesterase 2 (CES2) has become an attractive enzyme, with potential applications
in the field of chemotherapy. Still, it hasn’t been as thoroughly characterized as the other main
human carboxylesterase, the carboxylesterase 1 (CES1), having no described structure yet.
The original hypothesis being tested in this work was the possibility of enzyme-enzyme interaction that had been suggested from previous work in the host laboratory.
The initial task of this project was therefore to further assess CES2 stability and to test possible enzyme-enzyme interaction with CES1, by characterizing enzyme hydrolytic kinetics in different assay conditions and evaluating the behaviour of enzyme mixtures.
Different CES2 activity rates were observed when tested in different reaction conditions suggesting a stabilizing/destabilizing effect on the enzyme, but evidence of in vitro interactions
was not confirmed.
Considering the dependence of conclusions on test methods as well as the extreme care measures that have to be taken for avoiding enzyme degradation during the preparation of cell extracts, a second goal was envisaged for this project. This consisted in the development of a new method capable of determining CES activity in conditions closer to those that are found physiologically.
A new spectrofluorometric method able to assess carboxylesterase activity in intact living cells, using loperamide as a specific CES2 inhibitor and Bis(4-nitrophenyl) phosphate as a total carboxylesterase inhibitor was therefore developed and applied to Caco-2, HT-29. Hep G2 and HEK-293T cell lines.
The method proved itself capable of detecting CES total activity in living cells, as well as to differentiate between CES2 and other CES activities. Differences were shown between this and the traditional methods using cell extracts, suggesting that the latter may not be the best option when trying to predict in vivo CES behavior.
Keywords: Carboxylesterase 2, enzymatic activity, enzymatic stability, whole living cells
v
Resumo
Devido ao seu papel na metabolização de xenobióticos, tal como a activação de pro-fármacos, a carboxylesterase 2 (CES2) tem vindo a ganhar interesse, com potenciais aplicações no campo da quimioterapia. No entanto ainda não foi tão extensivamente caracterizada como a outra principal carboxilesterase humana, a carboxylesterase 1 (CES1), não tendo ainda sido descrita a sua estrutura.
A hipótese original a ser testada no projecto foi a possibilidade de uma interação enzima-enzima, sugerida por um trabalho anterior realizado no laboratório.
O objectivo deste projecto foi a caracterização da estabilidade da CES2 e testar uma possível interacção enzima-enzima com a CES1, através da caracterização dos parâmetros cinéticos de em diferentes condições e do comportamento de misturas de ambas as enzimas.
Observaram-se diferentes taxas de actividade de CES2 quando testada em diferentes condições, sugerindo um efeito estabilizador/desestabilizador na enzima, mas não foi confirmada a evidência de uma interacção in vitro.
Tendo em conta a dependência dos resultados nos respectivos métodos analíticos, assim como o cuidado extremo necessário para evitar a degradação enzimática durante a preparação de extractos celulares, surgiu um segundo objectivo para este projecto, consistindo no desenvolvimento de um novo método capaz de determinar actividade de CES em condições mais próximas às fisiológicas.
Foi desenvolvido um método espectrofluorimétrico capaz de avaliar as CES em células vivas intactas, usando loperamida como inibidor especifico da CES2 e Bis(4-nitrophenyl) phosphate como inibidor total de CES, usando as linhagens celulares Caco-2, HT-29, Hep G2 e HEK-293T.
O método provou ser capaz de detectar CES em células vivas e diferenciar a actividade de CES2 de outras CES. Foram observadas diferenças entre este método e os métodos tradicionais com extractos celulares, sugerindo que os últimos podem não ser a melhor opção quando o objectivo seja a previsão do comportamento in vivo de CES.
Palavras-chave: Carboxilesterase 2, actividade enzimática, estabilidade enzimática, método
vii
Index
1.
Introduction
... 1
1.1.
Carboxylesterases ... 1
1.2.
Enzymatic activity ... 2
1.3.
Analytical methods ... 4
1.4.
In vitro-in vivo correlations ... 5
1.5.
Animal cell cultures ... 6
2.
Goals
... 9
3.
Material and Methods
... 11
3.1.
Reagents ... 11
3.2.
Enzymatic activity assays ... 11
3.3.
Cell manipulation ... 13
3.3.1.
Caco-2 ... 13
3.3.2.
HT-29 ... 13
3.3.3.
Hep G2 ... 14
3.3.4.
Transfected HEK-293T ... 14
3.4.
Whole living cells spectrofluorometric method for enzymatic activity ... 14
3.5.
Measurement of cell concentration and viability ... 15
3.6.
Citotoxicity assay ... 15
3.7.
Protein quantification... 16
4.
Results and discussion
... 17
4.1.
Enzyme characterization ... 17
4.1.1.
Kinetic parameters ... 17
4.1.2.
Effects of the reaction media in ces activity ... 18
4.1.3.
Assessment of ces1 and CES2 possible interactions ... 23
4.2.
Whole living cells spectrofluorometric method ... 26
4.2.1.
Method development and optimization ... 27
4.2.2.
Caco-2 and HT-29 cells ... 30
4.2.3.
Hep G2 cells
–
a cell line intrinsically expressing CES2 ... 33
4.2.4.
HEK-293T suspension adapted cells ... 34
ix
Index of figures
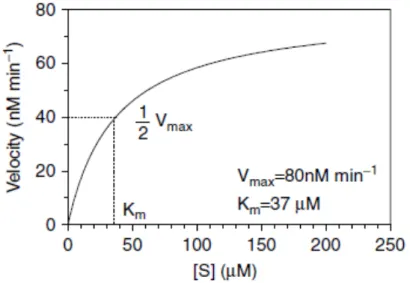
Figure 1.1 Exemplificative Michaelis-Menten plot 3
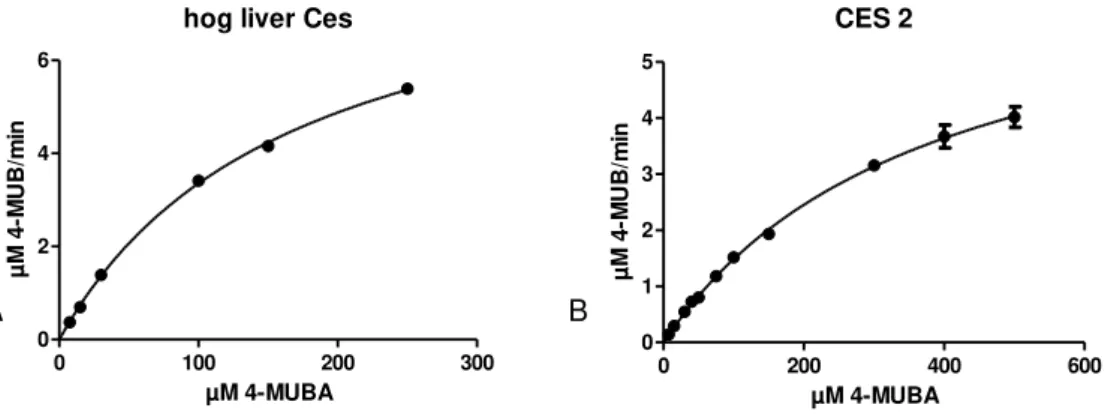
Figure 4.1.1 Hog liver ces and CES2 Michaelis-Menten plots 15
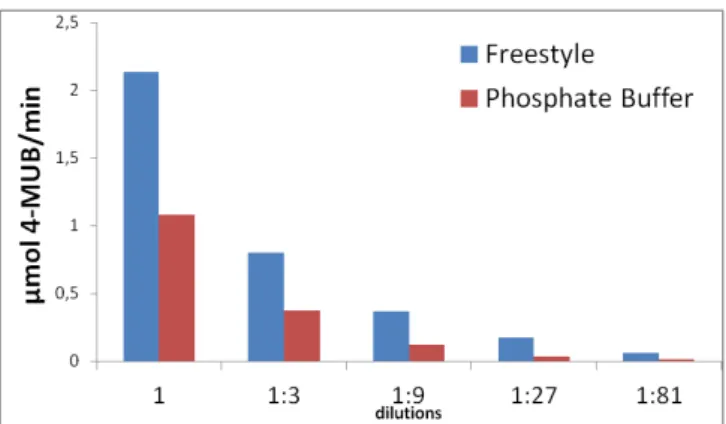
Figure 4.1.2 Purified CES2 4-MUB formation rate in phosphate buffer and FreeStyle 17
Figure 4.1.3 Purified CES2 activity in phosphate buffer, FreeStyle and phosphate
buffer diluted to FreeStyle 17
Figure 4.1.4 CES2 supernatant activity comparison in different buffers and at two
different 4-MUBA concentrations 19
Figure 4.1.5 CES2 supernatant 4-MUB formation rate as a function of enzyme
amount (µL) 19
Figure 4.1.6 CES2 supernatant 4-MUB formation rate comparison in phosphate buffer and Tris-HCl pH 7.3 and 8, DMEM and FreeStyle 20
Figure 4.1.7
Amount of 4-MUB formed by isolated ces1 and CES2 and a Ces1 and CES2 mixture and comparison with the theoretical total activity through spectrophotometry
21
Figure 4.1.8
Amount of 4-MUB formed by isolated Ces1 and CES2 and a ces1 and CES2 mixture and comparison with the theoretical total activity through spectrofluorometry
22
Figure 4.1.9
Amount of 4-MUB formed by isolated Ces1 and CES2 and a ces1 and CES2 mixture and comparison with the theoretical total activity through spectrofluorometry
x
Figure 4.2.1 Cytotoxic effect of four different 4-MUBA concentrations towards Caco-2 cells
24
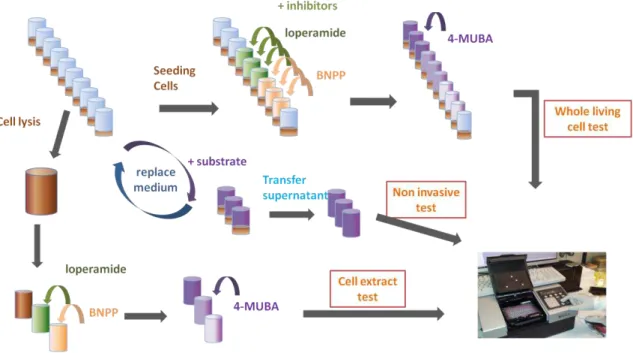
Figure 4.2.2 Schematic illustration of the whole living cells, non invasive and cell extract methods
26
Figure 4.2.3
Caco-2 whole living cells CES activity towards 4-MUBA, in the presence and absence of inhibitors (BNPP and loperamide) along the differentiation period
26
Figure 4.2.4
Caco-2 activity towards 4-MUBA along the differentiation period, evaluated through the non-invasive method. Comparison of new and re-used cells (A) activity and the respective correlation (B).
27
Figure 4.2.5
Correlation between the non-invasive and the whole living cell methods in the determination of CES activity through the amount of 4-MUB produced along the differentiation period of Caco-2 and HT-29
28
Figure 4.2.6
Caco-2 whole living cells and extracts CES activity towards 4-MUBA in the presence and absence of inhibitors (BNPP and loperamide) throughout the differentiation period
29
Figure 4.2.7
HT-29 whole living cells and extracts CES activity towards 4-MUBA in the presence and absence of inhibitors (BNPP and loperamide) throughout the differentiation period
30
Figure 4.2.8 Hep G2 whole living cells and extracts CES activity towards 4-MUBA in the presence and absence of inhibitors (BNPP and loperamide). 31
Figure 4.2.9
xi
Figure 4.2.10
HEK-293T transfected and non-transfected extracts CES activity towards 4-MUBA, in the presence and absence of inhibitors (BNPP and loperamide).
32
Figure 4.2.11
Transfected Caco-2 living cells CES activity towards 4-MUBA. in the presence and absence of inhibitors (BNPP and loperamide) without and with procaine at the 21st day post-seeding
33
xiii
Index of tables
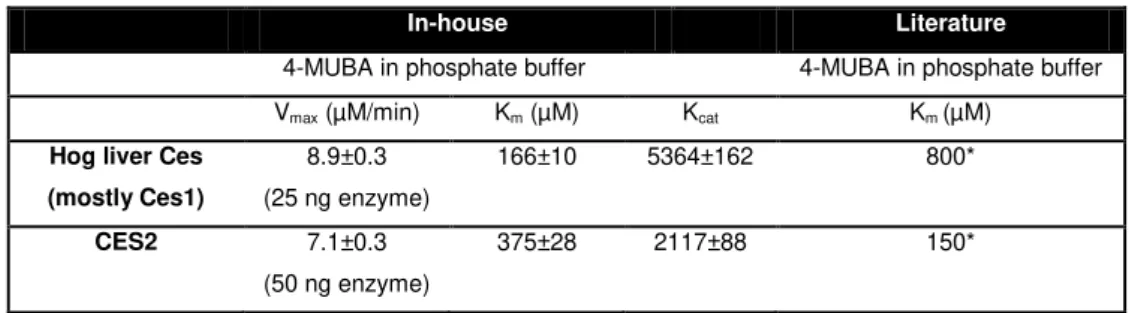
Table 4.1 Determined and literature values for the kinetic parameters of the hydrolysis of 4-MUBA by CES2 and Ces1/CES1 by spectrophotometry
16
Table 4.2
Determined values for the kinetic parameters of the hydrolysis of ces1 by
spectrofluorometry 18
Table 4.3
CES relative activities in Caco-2 living cells and extracts along the
differentiation period 29
Table 4.4 CES relative activities in HT-29 living cells and extracts along the differentiation period
xv
Abbreviations
4-MUB - 4-methylumbelliferone
4-MUBA - 4-methylumbelliferyl acetate
ATCC - American Type Culture Collection
BNPP - Bis(4-nitrophenyl) phosphate
BSA - Bovine Serum Albumin
CES/Ces –Carboxylesterases (human/non human)
CES1/Ces1 - Carboxylesterase 1 (human/non human)
CES2 /Ces2 - Carboxylesterase 2 (human/non human)
CES3 /Ces3 – Carboxylesterase 3 (human/non human)
CES5 /Ces4 – Carboxylesterase 5 (human/non human)
CES6 /Ces5 – Carboxylesterase 6 (human/non human)
CES7/Ces6– Carboxylesterase 7 (human/non human)
CPT-11 - Camptothecin-11
DMEM - Dulbecco’s Modified Eagle’s Medium
DMSO - Dimethyl sulfoxide
DSMZ - Deutsche Sammlung von Mikroorganismen und Zellkulturen GmbH
EDTA - Ethylenediaminetetraacetic acid
ER - Endoplasmic reticulum
FBS - Fetal Bovine Serum
HBSS - Hanks Balanced Salt Solution
HEK-293 (T) - Human embryonic kidney cells
xvi
IVIVC - in vitro – in vivo correlations
MEM - Minimum Essential Medium
MEM NEAA - MEM non essential amino acid
M-PER - Mammalian Extraction Reagent
MTS - 3-(4,5-dimethylthiazol-2-yl)-5-(3-carboxymethoxyphenyl)-2-(4-sulfophenyl)-2H-tetrazolium
PBS - phosphate buffer Saline
ρ-NPA - ρ-nitrophenyl acetate
1
1. Introduction
1.1.
Carboxylesterases
Carboxylesterases (Ces) (EC 3.1.1.1) are enzymes of the serine hydrolase family (1) and members of the esterase class of proteins (2). These enzymes catalyze the conversion of carboxylic esters to the corresponding alcohols and carboxylic acids and are categorized as phase-I drug metabolizing enzymes (2). Other classes of esterases that can be mentioned are phosphatases, sulphatases, lipases and cholinesterases among others.
Recently a novel nomenclature has been proposed for carboxylesterases, starting by differentiating human and non-human carboxylesterases with the root CES and Ces respectively, followed by the family number (3) and this is the rationale used in the present work. Thus, five families of mammalian carboxylesterases were described, including carboxylesterase 1 (Ces1), the major liver enzyme, carboxylesterase 2 (Ces2) mainly expressed in the small intestine, carboxylesterase 3 (Ces3) expressed in brain, liver and colon, carboxylesterase 5 (Ces5), a major urinary protein of the domestic cat also present in human tissues and carboxylesterase 6 (Ces6) a predicted Ces-like enzyme in the brain (3, 4). Among human carboxylesterases, two major forms (CES1 and CES2) are the most studied and the most relevant.
Esterases are known to be involved in the biotransformation of several ester-containing drugs and prodrugs such as angiotensin-converting enzyme inhibitors (temocapril, cilazapril, quinapril and imidapril), anti-tumor drugs (Irinotecan, also known as Camptothecin-11 (CPT-11) and capecitabin) and narcotics (cocaine, heroin and meperidine) (5).
Being remarkable catalysts, due to its wide and overlapping substrate specificities, CES contribution to the metabolism of ester xenobiotics has been thoroughly evaluated (6). The possibility to metabolize a variety of compounds comes from a large and flexible binding pocket, facilitating multiple binding sites (7). Still, the endogenous functions of CES are not well established.
While the prodrug activation function of CES promotes a pharmacological effect, these enzymes are also involved in detoxifying reactions, mainly by the formation of more polar, readily excreted products, by hydrolysis of lipophilic toxic esters to carboxylic acids (6, 8). One of the major applications of CES is therefore the detoxification of pyrethroid insecticides (9), but they are also used for accelerating the metabolism of narcotics, as cocaine and heroin (10).
2
as a topoisomerase I inhibitor than Irinotecan (12). Although hydrolyzed by various CES, it was shown that CES2 has a 64-fold higher catalytic efficiency (Kcat/Km) for CPT-11 than CES1 (11).
Taking into account the expression of each CES in different organisms, each tissue present different functions, with mammalian liver being responsible for detoxification due to a higher expression of CES1, and mammalian intestine, with higher expression of CES2, being involved in the first-pass clearance of several drugs (3, 5).
Depending on the species, CES may exist in different relative levels and be secreted or exclusively intracellular. In several species such as mouse, rat, rabbit, horse and cat (3, 4), both forms exist but it has been demonstrated that human CES are not found freely in the plasma (13).
The exclusive intracellular location of human CES1 and 2 is due to the existence of a C-terminal retention sequence which enables the anchoring of CES in the Endoplasmatic Reticulum (ER) luminal site (3, 4). This limits the use of human serum for studies of carboxylic ester hydrolysis, contrary to what happens with butyrylcholine esters, for example.
In addition, interspecies differences also pose limitations to the use of preclinical animals for evaluation of the pharmacokinetics of carboxylic acid esters and extrapolating to humans.
Among human carboxylesterases, only CES1 tertiary structure has been confirmed (7, 14), revealing a α/β-hydrolase-fold, typical of serine esterases, but also containing a large substrate binding area with both rigid and flexible pockets (14). CES1 is found in trimers formed by approximately 60 kDa monomers. It can also be found as hexamers, formed by two trimers stacked together (7).
Human CES2 is described as a much more unstable than CES1, 60 kDa protein (1) with only 48% sequence homology with CES1 (15) but a further study on this enzyme is needed such as its crystallographic characterization. Some homology models of CES2 have been proposed (16) but this protein has never been crystallized.
Due to this lack of information on CES2, one of the focuses of the Laboratory of Pharmacokinetics and Biopharmaceutical Analysis of ITQB/IBET has been the production and purification of a recombinant human CES2 and its characterization, having already been able to demonstrate that CES2 is active in structural forms other than monomers. (17)
1.2.
Enzymatic activity
3
involving a substrate binding to an enzyme active site and being converted into a product. The profiles thus obtained for different enzyme and substrate concentrations allow to determine kinetic parameters of the enzyme reaction (18).
Specifically, the kinetics of an enzymatic reaction in its steady-state can be analyzed through the measurement of initial rates of product formation (before significant reduction of the substrate concentration) as a function of varying substrate concentrations and at a fixed enzyme amount. Calculating initial rates also overcome some possible factors that can affect enzymatic activity such as product inhibition, pH changes and enzymatic denaturation (18).
A typical plot of initial rates against substrate concentrations (figure – 1.1) is described by the Michaelis-Menten enzymatic model from which Vmax and Km values can be obtained, being Vmax
the maximum velocity at saturated substrate conditions and Km the substrate concentration at
which V is half of Vmax. (19)
Since Vmax represents the maximum rate achieved by the system, when all the enzyme is bound
to the substrate, Km is considered as an inverse measurement of substrate’s affinity to the
enzyme. With lower Km values, the rate of the reaction will approach Vmax more quickly, thus
indicating a higher affinity (19)
Figure 1.1– Example of a velocity versus substrate concentration Michaelis-Menten plot for an enzyme
with Vmax =80 nM min−1 and Km = 37 μM (19).
The model equation is given by:
4
Through a linear or non-linear fit of the obtained curve, both Vmax and Km can be calculated.
Another used kinetic parameter is Kcat, the overall catalytic rate of an enzyme and is obtained by
dividing Vmax by the total enzyme concentration.
Being enzymes with a broad substrate overlapping, competitive reactions are a possibility due to different substrates competing for the same active site of the enzyme (19). On the other hand, protein-protein interactions leading to alterations in enzyme activity have been less described.
1.3.
Analytical methods
Depending on the goal of the reaction, different analytical methods can be used to evaluate the enzymatic activity. Taking into account the focus on carboxylesterases of this project, several instrumental methods of analysis have been used for quantification of the substrates and products of enzymatic reactions.
The most traditionally used UV absorbance spectrophotometric methods, allow the quantification of total CES activity by measuring the absorbance of the formed product. Nonetheless, when absorbance overlapping occurs between substrates, products and/or inhibitors or other matrix components, it may be difficult to differentially quantify each specific CES activity in complex biological samples or enzyme mixtures (1, 20).
Using fluorescent substrates or products, this problem may be overcome. For example, 4-methyl-umbelliferyl acetate (4-MUBA) is a non-fluorescent substrate that is hydrolyzed to the fluorescent product, 4-methyl-umbelliferone (4 –MUB) (1) and therefore, selective quantification of the product is possible by fluorometry. In this technique, the molecules of the analyte are excited with radiation at a certain wavelength and emit radiation at a different wavelength (21).
Separation techniques like chromatography or electrophoresis have the potential for reducing interference due to absorbance or emission overlapping, by previously separating the matrix components.
Chromatographic methods have been described, such as a discontinuous High performance liquid chromatography (HPLC)-based assay to measure CES activity, however it´s a more expensive method, using more reagents and more time consuming (1).
5
Techniques such as native electrophoresis followed by in-gel hydrolysis and Western Blot are alternatives that allow the detection of each CES. With native in-gel hydrolysis one can distinguish different CES in biological samples. Using Western Blots specific proteins can be detected using appropriate antibodies. However these methods are not quantitative (20).
Another issue to take into account when choosing an analytical method for evaluation of enzyme activity is the sample preparation step. Several aspects must be considered, the most important being the stability of the enzyme itself, but also of substrates and products. When separating the enzymes from the rest of the biological matrix components, for example, several methodologies can be used, ranging from full purification from producing cells or tissues, to the separation of subcellular fractions, such as microsomes and cytosol (1). An approach on closer to physiological conditions was already made in the laboratory when testing the hydrolysis of
ester drugs different animal’s serum through an electrophoretical mediated microanalysis
method (22).
1.4.
In vitro-in vivo correlations
The major goal of an in vitro method is trying to mimic in vivo conditions, so that the
characteristic of the drug being tested can be predicted and correlated to what happens in vivo.
The previously described methods allow determining CES activity from purified enzymes, mixtures or cellular extracts but they may not truly reflect CES activity in vivo. This is more
important in the case of human CES because they are immobilized within the cell, bound in the luminal side of the ER. The tertiary structure can be affected by contact with extraction buffers, or also the enzyme may suffer a change in solubility when taken out of its cell environment.
Another aspect to take into consideration is the ability of the substrate to reach the enzyme in its cellular location, often protected by biological barriers with selective permeability.
Animal experiments (in vivo, or ex vivo) can be used to better predict CES behaviour in a
biological system, nonetheless regulatory authorities are increasingly trying to limit these experiments, thus surfacing a need of new in vitro methods that better predict their role in the
human organism.
During drug development, in vitro – in vivo correlations (IVIVC) are an efficient tool in order to
6
IVIVC is defined as a predictive mathematical model describing the relationship between an in-vitro property of a dosage form and an in-vivo response, (25) the majority being related to the
use of cellular models to evaluate drug permeability and thus predict its in vivo absorption.
Nonetheless, when it comes to predict CES2 metabolism with cellular models, no work is found. Even though several approaches are described, mainly provoking CES inhibition in the study of the permeability of ester drugs (26, 27), the enzymatic metabolism has not been characterized using cellular models.
1.5.
Animal cell cultures
Living tissue culture initiated at the beginning of the twentieth century as a method for studying the behaviour of animal cells without being exposed to systemic variations that could arise in vivo both during normal homeostasis and under the stress of an experiment (28).
The development of cell cultures in the 1950’s, was initially due to two branches of medical
investigation, the production of vaccines and the study of neoplasia (28, 29).
Through a standardization of procedures, cell lines and other technical improves such as a large range of different commercial culture media have made animal cell culture accessible to a wide range of interests (28).
Depending on the type of assay being made, several cell lines can be chosen, the majority being originated from authenticated stocks of continuous cell lines and acquired from cell repositories such as the American Type Culture Collection (ATCC) or the Deutsche Sammlung von Mikroorganismen und Zellkulturen GmbH (DSMZ) (30).
Cell lines have become a common tool in drug development for efficacy, metabolism and permeability evaluation of newly developed drugs but also for the production of biological drugs.
The cell line most extensively used in in vitro permeability experiments, Caco-2, is derived from
a human colon adenocarcinoma and when in culture, it undergoes a process of spontaneous differentiation leading to the formation of a cellular monolayer, expressing morphological and functional characteristics of the mature enterocyte (31, 32).
This enterocyte-like cell line reaches confluency within 3-6 days and, a stationary growth after 10 days in culture and has a differentiation period of 20-21 days, expressing many enzymes and transporters present in the small intestine (33).
7
phenotype or as incomplete conversion from the proliferative to the differentiated phenotype. (34)
Nonetheless, regarding CES expression, Caco-2 phenotype differs from the small intestine one, with a higher CES1 and lower CES2 expression (35) and this presents a drawback of this cell line for modeling the fate of ester drugs.
Also originally derived from a colon adenocarcinoma, HT-29 cellular line is a useful in vitro
model to study cell differentiation, due to the possibility of modeling its differentiated state under specific culture conditions (36). It has also been used in co-cultures with Caco-2 for permeability studies.
When grown in standard conditions in with glucose, present in most commercially available culture media, HT-29 cells grow as a multilayer of unpolarised, undifferentiated cells without expression of any characteristic of enterocytes (33, 37). However, when the sugar source is changed to galactose the cells express a moderate enterocytic differentiation (33, 37). After 10 days in culture, cells show morphological and biochemical changes, namely cell polarization and changes in genes expression, indicating an epithelial differentiation (36). Although having a higher expression of CES2 compared to CES1, its activity is very low (39).
Hep G2 cellular line is derived from a liver tissue with hepatocellular carcinoma, and frequently used in vitro as a hepatic model, being able to carry out biotransformation of xenobiotics
compounds (40). It’s an easier to handle cell model, however with lower basal gene expression levels of phase I and II biotransformation enzymes, when compared with primary human hepatocytes (40).
Nonetheless, both CES1 and CES2 are expressed in Hep G2 cells, as expected from a liver derived cell line, with predominance for CES1 (41, 42).
To overcome the differences in CES expression between in vivo tissues and cellular cultures,
some cellular models are improved in order to express a desired protein in higher amounts.
In this project’s host laboratory, a CES2 transfected Caco-2 cell line was produced in order to present higher CES2 expression levels and improve its relevance as in vitro model, through a
better mimicking of intestinal epithelia.
Another cellular line, the Human Embryonic Kidney (HEK-293 T cells) was also transfected with human CES2 gene for protein production followed by its purification. CES2 purification was not easily achieved, raising questions about its stability.
Although cellular cultures are mainly classified as ex vivo methods, being living tissues, they
can be used as a first approach to simulate a living organism thus providing insights of in vivo
8
9
2. Goals
The main goal of the present work was to acquire insights into CES2 stability and possible enzyme-enzyme interactions with CES1. This was particularly relevant due to inconsistent results detected on the determination of enzyme activity during recombinant productions and also when mixtures of enzymes were analyzed.
Starting with the premise of an eventual interaction between CES1 and CES2, several initial tasks were developed in order to characterize the activity of both enzymes:
The kinetic characterization of each isolated enzyme and calculation of the respective kinetic parameters (Vmax and Km)
Assessment of the effect of different assay conditions (media, pH, additives) in the enzymatic activity
Evaluation of the effect on activity in enzyme mixtures
In fact it was observed that several parameters contributed to obtaining different responses in enzyme activity measurements which should be related both to enzyme stability/instability or degradation in different reaction conditions, but no evidence of in vitro enzyme interactions was
found.
These observations lead us to rethink the relevance of the methods that we were using for the study of the metabolism of ester xenobiotics, since bringing the enzymes out of their cellular environment was likely to introduce significant changes in their behavior.
Taking into account the possible applications of carboxylesterases as drug metabolizers, and mainly prodrug activators, the development of new analytical methods able to predict its behavior in closer to physiological conditions becomes relevant.
In order to face this problem and to achieve another goal of this project, the strategy consisted in the development of a spectrofluorometric method able to assess carboxylesterases activity in intact living cells, using loperamide as a specific CES2 inhibitor and bis-p-nitrophenyl phosphate (BNPP) as a total carboxilesterase inhibitor.
11
3. Material and Methods
3.1.
Reagents
Hog liver Ces (mostly composed by Ces1, 131 U/mg, Fluka), in house produced and purified CES2 (9.3 ng/µL, quantified by Bradford method), and the cells supernatant from the production were used in enzymatic assays.
4-methyl-umbelliferyl acetate (4-MUBA≥ 98%,), 4-methyl-umbelliferone (4-MUB, ≥98%), potassium chloride (KCl, >99%), potassium di-hidrogen phosphate (KH2PO4, >99%), sodium
chloride (NaCl, >99.5%), Ethylenediaminetetraacetic acid (EDTA, >98,5%), Triton X-100,
loperamide hydrochloride (≥99,8%), Bis(4-nitrophenyl) phosphate (BNPP, 99%), Trizma Hydrochloride (>99%), Trizma Base (>99,9%), Bradford Reagent, bovine serum albumin (BSA), Minimum Essential Medium (MEM), dimethyl sulfoxide (DMSO, ≥99,9%) and procaine hydrochloride (≥97%) were purchased from Sigma-Aldrich (St. Louis, U.S.A.).
Cells culture media and supplements, as Dulbecco’s Modified Eagle’s Medium (DMEM), MEM non essential amino acid (MEM NEAA), RPMI 1640, Trypsin-EDTA 0.25%, Trypan Blue 0.4%, penicillin-streptomycin (PenStrep), Hanks Balanced Salt Solution (HBSS), fetal bovine serum (FBS), phosphate buffered saline (PBS), FreeStyle™ 293, Geneticin and Pluronic F-68 were purchased from Invitrogen (Gibco ®, Grand Island, U.S.A.).
CellTiter 96® AQueous One Solution Cell Proliferation Assay was obtained from Promega (San Luis Obispo, CA, USA).
Mammalian Extraction Reagent (M-PER) was obtained from Pierce Biotechnology, Rockford, U.S.A.)
3.2.
Enzymatic activity assays
Carboxylesterase activity was determined in cell supernatant or purified enzyme solutions following the hydrolysis of 4-methyl-umbelliferyl acetate to 4-methyl-umbelliferone which concentration was determined either by spectrophotometry or spectrofluorometry.
Daily, a substrate (4-MUBA) stock solution was prepared by dissolving 16.36 mg in 5 ml DMSO to afford a concentration of 15 mM. This solution was further diluted in a 1:1 mixture of DMSO and phosphate buffer (90 mM KH2PO4, 40 mM KCl, pH 7.4) to the desired concentration.
12
For assays followed by spectrophotometry, mostly those for evaluation of enzyme kinetics, the reaction buffer, blanks and samples were added to 96 wells microplates on ice, and the substrate was added immediately before reading to a final reaction volume of 250 µL in different concentrations according to each assay. The reaction was followed at 37ºC during 15 minutes
with readings at 350 nm every 30 seconds (SPECTRAmax™340, Molecular Devices,
Sunnyvale, U.S.A.). Calibration curves in the range of 7.5 to 500 µM 4-MUB were applied in every assay.
For assays followed by spectrofluorometry, 4-MUB concentrations were determined using a microplate fluorescence reader (FL800 Bio-Tek Instruments, Winooski, VT, USA) with emission and excitation filters at 350 and 450 nm for 15 minutes every 50 seconds, at 37ºC. The range of the 4-MUB calibration curves were from 0.5 to 75 µM.
All assays were performed in triplicate and in all cases reaction blanks were added and subtracted from reaction readings. The concentrations of the product of the reaction, 4-MUB, were determined by linear regression, using the calibration curve. Michaelis-Menten kinetic parameters (Vmax, Km and Kcat) were determined by non-linear regression using GraphPad Prism
® 5 software.
For the evaluation of buffer effect on the enzymatic activity, different buffer, proprietary and in-house prepared, were used, namely phosphate buffer pH 8, 7.4, 6.5 and 5.8, FreeStyle, Tris and DMEM.
Spectrophotometry assays were conducted with 80 ng of purified CES2 or 80 µL of CES2 supernatant using 0.5 mM of 4-MUBA, while spectrofluorometric assays were performed with 10 ng of hog liver ces and 4-MUBA concentrations ranging from 0.15 to 75 µM. CES2 supernatant was also tested at different concentrations as described in section 4.
To evaluate CES1 and 2 interactions different amounts of hog liver Ces and of CES2 supernatant were tested isolated and in the presence of each other by spectrophotometry or spectrofluorometry as described in section 3.
For the evaluation of the significance of the differences between the average triplicates of concentrations of 4-MUB, a t-test of the mean was performed as described below.
For each pair of averages under comparison, testing value TV is calculated and compared with the threshold value obtained from a t-table (of from Excel): (43)
| X
Where Sd =
13
And decision is made by:
TV ≤ t(f, P = 95%): random difference t(f, P = 95%) < TV ≤ t(f, P = 99%): probable difference
TV > t(f, P = 99%): significant difference
3.3.
Cell manipulation
3.3.1. Caco-2
Human colon carcinoma Caco-2 cells originally purchased from Deutsche Sammlung von Mikroorganismen und Zellkulturen (DSMZ, Braunschweig, Germany), were thawed from a laboratory created bank and grown in RPMI 1640 supplemented with 10% of FBS, 2mM of glutamine and 5000U of PenStrep.
These adherent cells were cultured in T-Flasks with 25 and 75 cm2 and split three times per week after reaching 70-80% confluence, using Trypsin-EDTA 0.25% to detach the cells. They were maintained under a 5% CO2 and 37ºC environment.
A Caco-2 CES2 transfected population was also tested. The original line was from
American
Type Culture Collection (ATCC, USA)
and it was grown in DMEM medium supplemented with 0.1mM of MEM NEAA, 10% FBS and 0.95 mg/ml of Geneticin in 25 and 75 cm2 T-flasks with the medium being replaced every two days. They were maintained under a 7.5% CO2 and 37ºC
environment.
For tests of the selective pressure effect of procaine, these cells were also grown in the same culture medium, supplemented with procaine in concentrations ranging 500 to 1000 µM for one week, prior to being seeded and let to differentiate also in the presence and absence of procaine.
3.3.2. HT-29
The HT-29 human colon cancer cell line, originally purchased from
ATCC
was thawed from a laboratory created bank,grown and split in T-Flasks, using as culture medium
RPMI 1640supplemented with 10% of FBS and 2 mM of glutamine.
Before seeding, the culture medium was changed from RPMI 1640 to RPMI 1640 with glutamine and without glucose, and it was supplemented with 10% FBS and 5 mM Galactose (RPMI Gal) to induce differentiation.
14
3.3.3. Hep G2
Derived from a Hepatocellular carcinoma, these adherent cells were originally purchased from ATCC and also thawed from a laboratory created bank. The cell line was grown in Minimum Essential Medium Eagle supplemented with 10% FBS, 2mM of glutamine, 1mM Sodium Pyruvate and 0,1mM Non Essential Aminoacids in 25 and 75 cm2 T-Flasks.
3.3.4. Transfected HEK-293T
Human Embryonic Kidney 293 cells from ATCC. The in-house suspension adapted and CES2 transfected (geneID 8824) HEK-293T cells were used for evaluation of CES2 activity in comparison with non transfected HEK-293T cells.
A pellet of an in-house production of these cells was received and immediately ressuspendend in HBSS buffer, counted to calculate cell concentration and activity tests performed immediately.
3.4.
Whole living cells spectrofluorometric method for enzymatic
activity
For the whole living cell method, Caco-2 cells were seeded at a concentration of 1.04 x 10⁴
cells/cm2 in 96 well plates with 100 µL of culture medium being replacedwith the same volume
of fresh medium three times a week during the 21 days differentiation period.
For tests with HT-29 cells were seeded at 3.2 x 10⁴ cells/cm2.
For both Caco-2 and HT-29 cells, 4 assays were performed to evaluate living cell’s ces activity
towards 4-MUBA during the 21 days differentiation period. The assay is carried out by removing the culture medium and adding 250 µL of buffer or 25 µM loperamide or 500 µM of BNPP. After a 10 minutes incubation period, 250 µL of 0.05 mM 4-MUBA is added. Every solution is prepared in HBSS. The plate is taken to the microplate fluorescence reader and the reaction is followed for 15 minutes at 37ºC. Alternatively, the reaction is stopped at a specific time by removing the reaction solutions and transferring it to another microplate where is then measured the fluorescence.
15
For the Hep G2, seeds were of 6 x 10⁵ cells/ml and only one assay was performed 24 hour after seeding where cells had already adhered. Both whole living cells, and extracts prepared as described above, were tested.
CES2 transfected HEK 293T and non-transfected cells were also tested. This is a suspension adapted cell line and therefore slight differences relative to the previous assays where applied. Namely, no delay was necessary for adherence as in the case of HepG2. Different volumes (25, 20 and 15 µL) of cells suspension were tested in the presence and absence of inhibitors as described previously, with 0.05 mM of 4-MUBA, 25 µM loperamide and 500 µM of BNPP.
Extracts of both transfected and non transfected cells were prepared by lysing with M-PER buffer and centrifuged for 10 minute at 10000rpm and 4ºC, and the resulting extracts were analyzed as described previously using in each assay an amount equivalent to that used in the whole living cell method.
3.5.
Measurement of cell concentration and viability
The Trypan Blue exclusion method was used to determine cell concentration in each culture. The cells were detached from the T-Flasks or plate wells with Trypsin-EDTA 0.25% and added to a 0.1% (v/v) Trypan blue solution diluted in PBS and counted in a Fuchs-Rosenthal haemacytometer (Brand, Wertheim, Germany).
A CES2 transfected Caco-2 cell growth assay was performed in the presence of different concentrations of procaine. Cells were counted in the supernatant and among the adherent ones, in duplicate every day for 11 days.
3.6.
Citotoxicity assay
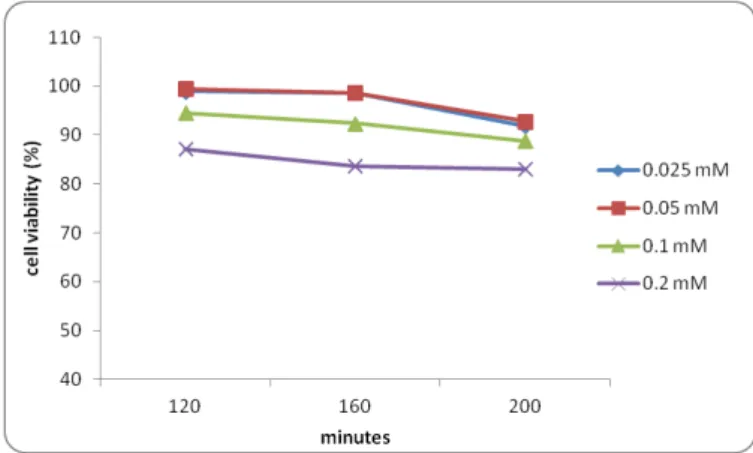
4-MUBA citotoxicity towards the transfected Caco-2 cells was tested using the CellTiter 96® AQueous One Solution Cell Proliferation Assay, which is composed of 3-(4,5-dimethylthiazol-2-yl)-5-(3-carboxymethoxyphenyl)-2-(4-sulfophenyl)-2H-tetrazolium (MTS). This compound is converted by viable cells into the aqueous soluble formazan, a colored compound. The quantity of formazan is proportional to the number of viable cells in culture and can be measured by absorbance at 490 nm.
16
medium, diluted from stock solutions and 200 µl were added to the assay plate. After the incubation period, 40 µl of the MTS solution was added to each well, following another period of incubation of 2 hours when finally the absorbance was measured at 490 nm using a
SPECTRAmax™340 microplate spectrophotometer. Readings were made at the end of the incubation period, 120 min and also at 160 and 200 min.
3.7.
Protein quantification
For total protein quantification, cells were firstly lysed with a lysis buffer containing Triton X 100 2%, EDTA 5mM, NaCl 0,25mM and Tris HCl 50 mM followed by a 10 minute centrifugation at 10000 rpm at 4ºC. The extracts were immediately stored at - 8ºC.
The measurement was performed by the Bio-Rad Protein Assay based on the Bradford method (44) which determines protein concentration by adding an acidic dye to a protein solution followed by a measurement at 595 nm in a microplate reader. This dye-binding assay is based on a differential color change of a dye (Comassie Brilliant Blur G-250) in response to various concentrations of protein, shifting its maximum absorbance from 465 nm to 595 nm when the binding occurs (44).
Following the manufacturer’s instructions, the Standard Procedure for Microtiter plates, with a
17
4. Results and discussion
4.1.
Enzyme characterization
Work was initiated by the characterization of the enzyme solutions available at the laboratory namely commercial hog liver ces (since mostly constituted by ces1, the two designations will be used interchangeably) and in-house produced recombinant human CES2. With this objective, the kinetic parameters of hydrolysis reaction of 4-MUBA to 4-MUB were determined and the effect of the composition of the reaction medium was investigated.
4.1.1. Kinetic parameters
Hydrolysis of 4-MUBA into 4-MUB was chosen since this substrate is more stable than the commonly used CES substrate p-NPA (15) and it has a higher specificity towards CES2 (1).
The reaction buffer was phosphate buffer at physiological pH 7.3, which was previously described by other authors as a reaction buffer used in this reaction (15).
A B
Figure 4.1.1 - Michaelis-Menten plots for hog liver Ces (A) and CES2 (B) obtained by non linear
regression using Prism GraphPad5. Error bars represent the standard deviation of three independent measurements
For hog liver Ces kinetics, 25 ng of enzyme were used and 4-MUBA ranged from 7.5 to 250 µM. For CES2 were used 50 ng of purified enzyme and 4-MUBA concentration ranged from 7.5 to 500 µM. Quantification of 4-MUB was by spectrophotometry.
By plotting substrate concentrations against the reaction rate, a Michaelis-Menten model of a kinetic reaction is observed. The used software automatically fits the values, and no evidence of an inadequate model was found, making it possible to calculate Vmax, Km and Kcat of both
enzymes by a non linear fit.
Table 4.1 presents the results of this determination using GraphPad Prism software and their comparison with values from the literature.
CES 2
0 200 400 600
0 1 2 3 4 5 µM 4-MUBA µ M 4 -M UB /m in
hog liver Ces
0 100 200 300
18
Table 4.1– Determined and literature values for the kinetic parameters of the hydrolysis of 4-MUBA by CES2 and Ces1/CES1. Error values represent the standard deviation of three independent measurements
In-house Literature
4-MUBA in phosphate buffer 4-MUBA in phosphate buffer Vmax (µM/min) Km (µM) Kcat Km (µM)
Hog liver Ces (mostly Ces1)
8.9±0.3 (25 ng enzyme)
166±10 5364±162 800*
CES2 7.1±0.3 (50 ng enzyme)
375±28 2117±88 150*
*Purified Human CES1 and CES2, (15)
Comparing the obtained values with described ones using the same substrate and reaction buffer but with a human CES1, one can say that contrary to the results of Pindel et.al. (5), the
present results point out to a higher affinity of CES1 for 4-MUBA than CES2.
Differences obtained may be related to the enzyme origin, purity or even the calculation methods. These values were calculated using 4-MUB calibration curves, however some authors prefer to use the molar extinction coefficient of 4-MUB (12.2 mM-1cm-1). If such approach were used in the present work, the result for Km would be 250 µM which illustrates an important
source of variability of results.
4.1.2. Effects of the reaction media in ces activity
Previous evidence (46) pointed out to a significant instability of CES2 in the hydrolysis reaction buffer (phosphate) in comparison with the medium where the enzyme was produced (FreeStyle).
In order to confirm FreeStyle stabilization ability, the hydrolysis reaction was evaluated in both buffers during 15 minutes at 37ºC and at five different concentrations starting at 0.32 ng/µL (80 ng) of purified CES2 and serially diluting (1:3). 0.5 mM of 4-MUBA was used in all reactions and substrate and enzyme blanks in each buffer were also tested.
19
Figure 4.1.2– Rate of formation of 4-MUB through the hydrolysis of 4-MUBA by different dilutions of
purified CES2 in phosphate buffer pH 7.3 and in FreeStyle
CES2 was tested again in a new assay where the effect of replacing one reaction medium by another was evaluated: CES2 was initially added to phosphate buffer and serial dilutions initiated in the same buffer. At the 2nd dilution, phosphate was replaced by FreeStyle. The assays with a single buffer as mentioned previously were also repeated.
For this experiment, non purified enzyme was used instead of the purified enzyme solution. This decision was made to make sure that the enzyme was in the best conditions possible, since it had been observed previously that the enzyme was much more stable before purification (in the cell supernatant) than in the cryopreservation medium (45).
In this case, protein quantification of the supernatant was not possible due to interferences in the analytical methods and thus whenever using supernatant this is referred by volumes and not by enzyme amount. Initial amount of the enzyme solution (80 µL) was set so that similar
hydrolysis rates were obtained in comparison with the previous experiments.
Figure 4.1.3 –Comparison of CES2 activity in phosphate buffer, FreeStyle and phosphate buffer diluted to
20
As seen above (Figure 4.1.3) in the first dilution, CES2 activity was higher in FreeStyle than phosphate buffer, in accordance with the previous assay. Still the difference was considered to be random. As the dilution rate increases the significance of the differences between FreeStyle and phosphate diluted samples increases. When diluted from phosphate buffer to FreeStyle, a recovery of the enzymatic activity is visible, with the 4-MUB formation rate approaching the values of FreeStyle alone and becomes significantly different from phosphate buffer alone.
All the previously described assays were performed by following the formation of 4-MUB by spectrophotometry. Taking account that these effects might be concentration dependent, it was decided to reduce enzyme concentration. In order to do so, a different method has to be used since the original has not sensible enough.
A fluorimetric method was therefore chosen due to its higher sensitivity which allows testing lower amounts of enzyme and/or substrates. As an indication of its sensitivity, the linearity range of the 4-MUB calibration curve obtained with this method was around the 0.15 to 50 µM range, against the 50 to 500 µM range in spectrophotometry (appendix A).
To firstly test the method and due to reduced availability of CES2, hog liver ces (10 ng) was tested in phosphate buffer, FreeStyle and DMEM medium, and its kinetic parameters were calculated, the same manner as with spectrophotometry (Table 4.2).
Table 4.2– Determined values for the kinetic parameters of the hydrolysis of Ces1. Error values represent the standard deviation of three independent measurements
Vmax (µM/min) Km (µM)
Phosphate buffer pH 7.4
3.8±0.4 63 ±10
FreeStyle 2.5±0.1 43±4
DMEM 3.8±0.3 120±14
21
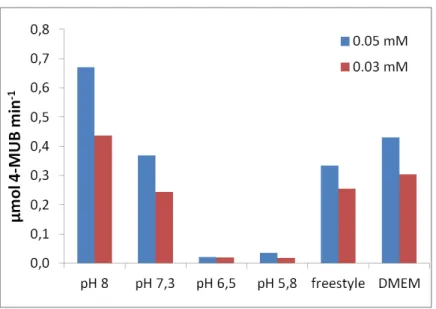
Figure 4.1.4 – CES2 supernatant activity comparison in different buffers and at two different 4-MUBA
concentrations
Being an explorative assay, no replicates were made, so no definite conclusions could be made. Still, different activity rates were clearly visible with different media and pH. In this assay, it was shown that DMEM also promotes a non-enzymatic hydrolysis of 4-MUBA in the same way as FreeStyle.
With this preliminary assay it was observed a proportional enzymatic response with different media at lower 4-MUBA concentrations. Still, linearity of the assay at the analysis concentrations had not been established yet at this time. Linearity was therefore evaluated using 0.5, 1, 2 and 4 µL of CES2 supernatant at 0.05 mM of 4-MUBA in phosphate buffer.
As illustrated in figure 4.1.5, it was in fact possible to confirm linearity of the reaction rate in this enzyme concentration range.
Figure 4.1.5– Representation of the rate of product formation as a function of the amount (µL) of CES2
22
With this test, a proportionality between the amount of enzyme added and its activity was observed, showing that these values are in the linear response range of CES2, a necessary condition to perform enzymatic assays.
With the optimal enzyme amount confirmed, a final study of the different media was carried out using 0.5 µL of CES2 supernatant, 0.05 mM of 4-MUBA, with phosphate buffer and a new buffer, Tris-HCl both at pH values of 7.3 and 8, FreeStyle and DMEM. Each assay was performed in triplicate.
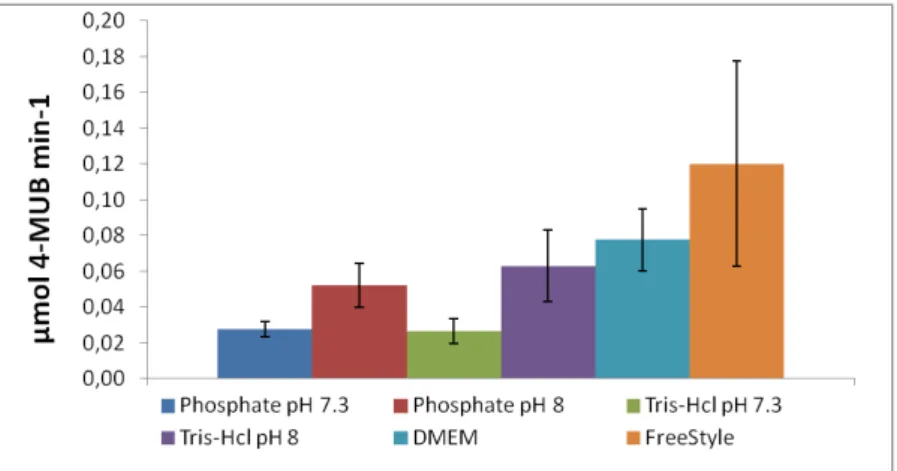
Figure 4.1.6– CES2 activity comparison (in terms of the rate of formation of 4-MUB) in phosphate buffer and Tris-HCl pH 7.3 and 8, DMEM and FreeStyle. Error bars represent the standard deviation of three independent measurements
As previously observed, CES2 showed higher activities at higher pH with both phosphate buffer and TRIS-HCl buffers. A probable difference was found between different pH of the same buffer but not between different buffers (phosphate and Tris-HCl) at the same pH thus making it possible to conclude that CES2 activity suffers no change with these different buffers and it’s
positively affected by a pH increase
FreeStyle was proven to provide higher CES2 activity, having significant differences to phosphate and Tris at both pH and a probable difference with DMEM.
DMEM only showed a significant difference to pH 7.3 buffers. Having pH 7.4 and 7-7.5 respectively, the positive effect of both DMEM and FreeStyle were not due to a pH effect.
23
Taking into consideration the fact that both FreeStyle and DMEM promote a non enzymatic hydrolysis of 4-MUBA, and even thought this value is subtracted from the total activity, there is a higher probability of introducing errors in the calculation of formed 4-MUB in these media.
FreeStyle is a proprietary medium from Gibco, used as culture media in cellular cultures, and is supplemented with several compounds in order to promote cellular growth and viability. The exact composition is not disclosed and therefore it is not easy to evaluate if any of the additives of this buffer might be responsible for stabilization of the enzyme in a more active form that the simplest buffers (besides pH). We speculated that Pluronic-f68 should be one of these additives and tested it stabilizing effect in the range of 0.25 up to 1% in phosphate buffer pH 7.3, however no significant differences were detected between the plain and the supplemented buffer (results not shown).
Although it was possible to detect higher activity rates in the commercial media and higher pH
buffers, it’s harder to control non-enzymatic hydrolysis, therefore making the pH 7.3 phosphate buffer the choice for the following assays.
4.1.3. Assessment of ces1 and CES2 possible interactions
Faced with the possibility of a CES1 and CES2 interaction (20), this hypothesis was firstly tested with the spectrophotometric method.
By applying both enzymes isolated and in the presence of each other, a comparison of the individual and total activity of combined enzymes can be made. Both enzymes were also applied together in the presence of loperamide, a CES2 inhibitor, making it possible to evaluate the behavior of only Ces1 (hog liver Ces is composed mostly by Ces1) when in presence of CES2.
24
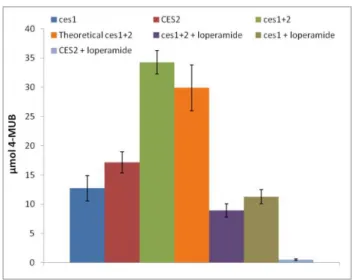
Figure 4.1.7– Amount of 4-MUB formed after 8 min in the presence of isolated or of mixtures of CES2
supernatant (5 µL) and Ces1 (50 ng). Orange bar represents the amount expected in the mixture, considering the product formed with the isolated enzymes. Purple bar represents the amount formed in the mixture by inhibition of CES2 (25 µM of loperamide). Grey bar represents the ammount formed by ces1 with the presence of loperamide. Blue bar represents the inhibition of CES2 with loperamide. Error bars represent standard deviation from three independent measurements
These results show the amount of formed 4-MUB at a single point in the linear activity zone of the reaction. By adding the amount of 4-MUB formed by each isolated enzyme, a theoretical Ces1+2 total activity can be calculated, and compared to the real Ces1+2 total activity of both enzymes when in the presence of each other.
No significant difference was found when comparing activities of isolated and mixed enzymes. Considering the Ces1+2 as the total (100%) activity, when loperamide was added to Ces1+2 its activity was reduced to 53%, so CES2 was responsible for 47% of the total activity, a similar value of the isolated CES2 activity of 50% when compared to the total Ces1+2.
Furthermore, it was shown that ces1 activity is not inhibited by loperamide while it efficiently inhibits CES2. Moreover when in the presence of loperamide, the activity of the mixture is reduced to the level of activity of Ces1.
To evaluate if these observations were independent of the enzyme concentration, a new set of assays was performed through spectrofluorometry, enabling the use of smaller amounts of enzyme and 4-MUBA concentrations. This method also allows the use of BNPP that can’t be
used in spectrophotometry due to having its high absorbance at 350 nm which is the maximum of absorbance of 4-MUB (20).
25
A B
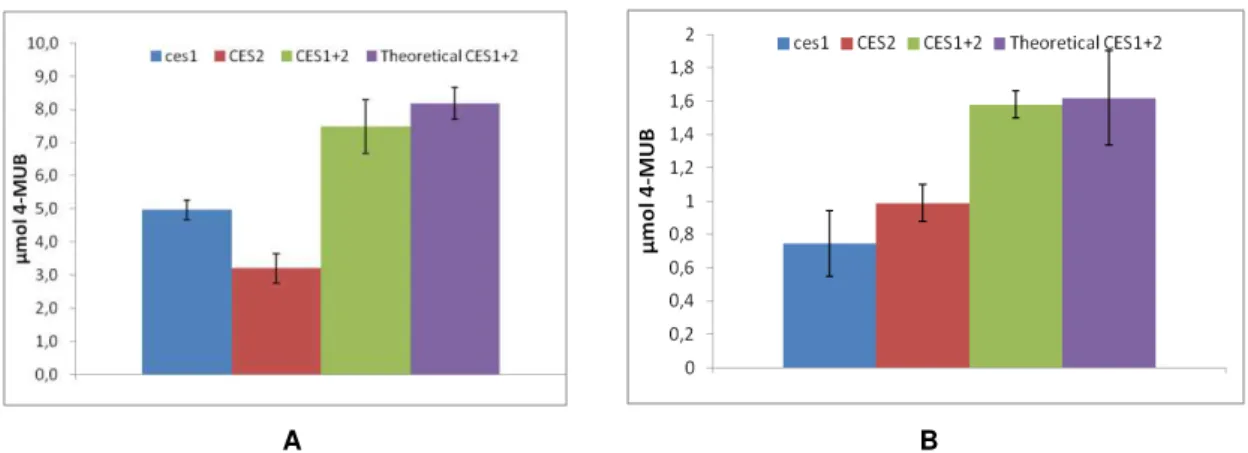
Figure 4.1.8– Amount of 4-MUB formed after 8 min in the presence of isolated or of mixtures of CES2 supernatant (1 µL) and Ces1 (10 ng) with 0.1 mM 4-MUBA (A) and CES2 supernatant (0.5 µL) and Ces1 (5 ng) with 0.05 mM 4-MUBA (B). Green bars represent the ammount formed by Ces1 and CES2 mixture. Purple bars represent the expected ammount of the mixture considering the product formed by each isolated enzyme. Error bars represent standard deviation from three independent measurements
With these first spectrofluorometric assays, even though a slight loss of activity is observed comparing to the theoretical total activity (8.6% and 2.4% difference in the first and second assay respectively), again no evidence of an interaction was found since the calculated differences were shown to be non-significant.
A final test was made to conclude about the non existence of interaction with 5 ng Ces1 and 0.5 µL CES2 and 0.05 mM 4-MUBA, and loperamide and BNPP being applied as well.
Figure 4.1.9– Isolated Amount of 4-MUB formed after 8 min in the presence of isolated or of mixtures of
26
In accordance to all the previous assays, there was no significant difference between the theoretical total activity of both enzymes, and the one observed in this test, with CES2 in the mixture being responsible for 76% (by inhibition with loperamide) of total activity and the isolated CES2 activity being 67% when compared with total Ces1+2.
Moreover, the activity of isolated ces1 was the same as its activity when in presence of CES2 and therefore there is no evidence that an interaction exists between Ces1 and CES2 affecting their activity.
On the other hand it was possible to conclude that hydrolysis rates are strongly dependent on the buffer pH and composition and therefore slight differences between methods may have a significant impact in the results.
The hypothesis of an interaction between both enzymes surfaced in a previous work, where a new capillary electrophoresis method was developed to assess carboxilesterases activity and an evidence of a diminished total activity when both enzymes are combined was found (24).
Being a different analytical method with different sample preparations may explain the misleading conclusion from the previous work. The use of extraction buffers to prepare the samples might have caused the instability of CES2 and consequently its loss of activity. Moreover reactions were not followed in time. Instead, they were stopped at a specific time and then analyzed by capillary electrophoresis. Although it was assured that this time was within the linear range of the reaction, this may have had an impact in the determination.
4.2.
Whole living cells spectrofluorometric method
Having concluded on the non existence of an in vitro enzymatic interaction with both
carboxylesterases in study, and having successfully tested the hydrolytic reaction by spectrofluorometry, we proceeded to the development of a whole living cell method and to its evaluation in comparison with the more commonly used cell extraction method.
27
4.2.1. Method development and optimization
To firstly test the possibility of applicability of this method, a set of assays was designed using Caco-2 cells.
Before starting those assays, the cytotoxic effect of 4-MUBA towards Caco-2 cells was evaluated to ensure an adequate choice of the substrate concentrations used in the assays.
Figure 4.2.1– Cytotoxic effect of four different 4-MUBA concentrations towards Caco-2 cells
As seen in figure 4.2.1, a concentration of up to 0.05 mM of 4-MUBA could be used since cell viability remains above 80% after several hours in the presence of the compound.
Caco-2 was chosen since it is a well studied and robust cell line. Cells from the DSMZ bank were grown and seeded in 96 well plates. Throughout the 21 days differentiation period, the hydrolytic ability of the cell monolayer was evaluated at different time points. Whenever an assay was made, the culture medium was removed and the cells monolayer was rinsed with 100 µL HBSS. Since the cells are adherent to the plate wells and homogenization could disrupt the cells, the total assay volume of the reaction was added once, already with 4-MUBA. So a solution of 0.05 µM of 4-MUBA was prepared in HBSS and 250 µL were added to the cells.
Depending on the type of assay, different procedures were used:
The first case, when cells being used were to be discharged after the assay, the whole plate, containing the cells was taken out of the aseptic conditions and taken to follow the reaction occurring in the spectrofluorometer (this was considered an invasive test). The reaction was followed during 15 minutes and a kinetic profile of the hydrolytic reaction occurring due to CES present in Caco-2 cells was evaluated.
28
range of the reaction. After the supernatant was removed, 100 µL of fresh culture medium was added to the cells so they can keep on growing.
For assays requiring the use of inhibitors, after rinsing the cells with HBSS and prior to the addition of 4-MUBA, loperamide (25 µM) or BNPP (500 µM), were applied and left to incubate for 10 minutes at 37ºC. After the incubation period, the solutions were removed and a solution containing 4-MUBA and the respective inhibitor was added and the reaction started. BNPP concentration was chosen based on the studies of Imai et al (25), where it had been described as a non-toxic concentration to mammalian cells and able to inhibit 98% of specific hydrolysis by CES.
Cellular extracts were also made and their activity was tested same way as living cells, in order to assess a possible correlation between both methods.
Plates were prepared to contain triplicates of each assay, blanks and additional wells for cell count and protein quantification.
Figure 4.2.2– Schematic illustration of the whole living cells, non invasive and cell extract methods Results are presented after normalization for the average number of cells counted at each time point.
29
activity was still present revealing, either the presence of esterases other than carboxylesterases, or a difficulty in the diffusion of BNPP into the endoplasmatic reticulum where the carboxylesterases are located. This effect was not reported by Imai et al that
routinely uses this inhibitor in permeability experiments (25).
Figure 4.2.3– Caco-2 whole living cells CES activity towards 4-MUBA (0.05 mM), in the presence and absence of inhibitors (BNPP 500 µM and loperamide 25 µM) and throughout the differentiation period. Error bars represent standard deviation from three independent measurements.
Regarding the non-invasive method, CES total activity was analyzed at a single point (8 minutes) and used cells were maintained in culture after the assay to be later retested. In this case, no inhibitors were used.
The newly used cells activity was compared with the reused ones (figure 4.2.3 A) and it was observed that cells underwent 3 assays without losing activity compared to the newly used ones. By plotting the activity from new against reused cells a linear correlation can be obtained, suggesting that cells can indeed be reused several times (figure 4.2.3 B).
A B
30
4.2.2. Caco-2 and HT-29 cells
After this initial implementation the next set of assays were carried out with Caco-2 and HT-29 cells, with the goal of comparing the extraction and the whole living cell methods in the characterization in different cell lines.
CES activity was measured directly from the whole living cells, in the presence of inhibitors. As describe above, one plate for each cell line was also inoculated so that the activity could be measured by the supernatant method. These wells were not reused, instead they were lysed and the resulting extracts were also evaluated by the spectrofluorometric method. For each assay a cell count was made, and the total protein present in the extracts was quantified by the Bradford method, so that every assay could be normalized by cell count or protein concentration.
The total CES activity was measured by the non-invasive method for both Caco-2 and HT-29 cell lines, and compared with the invasive whole cell method, confirming the above described direct correlation between the two measuring methods, making it possible to re-test the exact same cells for total activity throughout the 21 days period.
Figure 4.2.5– Correlation between the non-invasive and the whole living cell methods in the determination