of Chemical
Engineering
ISSN 0104-6632 Printed in Brazil www.scielo.br/bjce Vol. 35, No. 03, pp. 1051-1062, July - September, 2018
dx.doi.org/10.1590/0104-6632.20180353s20160661
MODELING OF MULTIPHASE FLOW IN AN
AIR-COOLING SYSTEM USING THE CFD-FSCA
APPROACH
Haozhe Jin
1, Xiaoping Chen
2, Jia Ren
1, Xuehua Wu
1, Zhijian Zheng
1,
Guofu Ou
1,* and Yisha Ye
11 The Flow Included Corrosion Institution, Zhejiang Sci-Tech University, Hangzhou 310018, P.R.China.
2 Focused Photonics Inc., Hangzhou 310051, P.R.China.
(Submitted: November 27, 2016; Revised: August 12, 2017; Accepted: August 25, 2017)
Abstract - The deposition of crystallized ammonium salt particles presents serious damage to the hydrogenation reactor effluent air cooler (REAC) in petrochemical engineering. The correlation technology process was analyzed for predicting the particle deposition situation in air coolers. Moreover, the particle crystallization and deposition were revealed, and a mathematical model for flow field simulation was established by computational fluid dynamics (CFD). In addition, the fast search clustering algorithm (FSCA) realized in Matlab software was applied to detect tube anomaly. The relatively greater risk of deposition or blockage in the tube area was detected, and this finding is consistent with the distribution of the surface temperature field in air coolers. Meanwhile, good qualitative agreement was found between the distribution rule of particle deposition rate as simulated by CFD and the situation of opened header box on the spot. Therefore, the combined method of CFD simulation and FSCA detection can be utilized for predicting the condition of particle deposition in the air-cooling systems.
Keywords: Air cooler; CFD simulation; Anomaly detection; Predicting method.
INTRODUCTION
The petroleum and chemical industries, which
prioritize crude oil refining, are the pillar industries of the national economy in China (Lin et al., 2015; Dion et al., 2012). As an important secondary technical process in refinery, the hydrogenation reactor effluent air cooler (REAC) is one of the most important
equipments in hydrogenation units. In recent years, the increasing proportion of inferior crude oil processing issues, such as high sulfur, high acid, and presence of chlorine, have caused failure incidents of tube deposition or constant clogging in REAC systems,
leading to many stoppage accidents (Radwan et al., 2015; Jin et al., 2010). Moreover, the mixture of
NH4Cl, NH4HS, FeS, and others from the reaction in the system often causes deposition, blockage, or corrosion in air coolers, and this failure type exhibits
evident characteristics of locality and risk (Toba et al., 2011; Popova et al., 2015; Fei et al., 2014).
In recent years, several experimental investigations and numerical simulations have been conducted to study this failure behavior. The presence of daily
varied corrosive agents (insoluble salt, chlorides, and sulfidic compounds) was studied in crude oil mixture
to corrode and choke the tubes, and the origin of the
corrosion damage of air-cooler tubes was identified in oil refineries (Jenabali et al., 2005). The crystal
and deposition behavior of ammonium chloride
salt (NH4Cl) and multiphase flow simulation was
investigated in refinery hydrocracking REAC by using Aspen software and computational fluid dynamics (CFD) technology (Zhu et al., 2015). The root cause of tube explosion was studied in refinery hydrocracking
REACs, and the structure impact on the ammonium salt deposition location and the corrosion behavior of
wet ammonium salt was analyzed in REAC tubes (Ou et al., 2013). The experimental and CFD modeling was
studied on heat transfer, friction factor, and thermal performance of an air-cooled heat exchanger, which was equipped with three types of tube inserts, namely,
butterfly, classic, and jagged twisted tape (Shabanian et al., 2010).
However, the risk of deposition or clogging caused by the existence of ammonium salt crystal particles in the hydrogenation REAC system has yet to be comprehensively evaluated given that only crystallization temperature or the under-deposit
corrosion rate has been measured (Shammerl et al., 2010). In recent years, numerous analytical and
numerical methods have been developed and adopted
for forecasting in various engineering fields (Massinaei
et al., 2010; Pourtousi et al., 2015; Shamshirband et al., 2015; Karami et al., 2012; Lemoine et al., 2008; Shamshirband et al., 2013; Lai et al., 2009; Abbas, 2008;
Petković et al., 2014). Soft computing methods provide
several tools to show nonlinear input-output mapping and solve a variety of nonlinear and complex problems. Among these methods, the clustering algorithm is applied for classifying elements into categories or clusters on the basis of their similarity and can be also used for anomaly detection in industrial applications
(Rodriguez et al., 2014; Elhamifar et al., 2013; Birant
et al., 2007; Assidjo et al., 2008; Kazemi-Beydokhti
et al., 2015). Besides, the combination of clustering
algorithm and CFD method is rarely researched. Here, a new approach is attempted for anomaly detection in
air cooler tubes, during which the data of average fluid
velocity and liquid fraction in every tube was exported from CFD results; then, the soft computing technique was implemented by MATLAB software for anomaly detection with the fast search clustering algorithm
(FSCA) in two dimensions.
In this paper, the mathematical model of particle deposition in the REAC system is established. This work includes analyzing the technology correlation process, revealing the formation process of ammonium salt crystallization and deposition, and simulating the
inner flow field. Meanwhile, the relatively greater risk
of deposition or blockage in tube areas was detected by FSCA, for predicting the particle deposition situation in
air coolers. These results provide significant reference
in terms of in-service inspection and risk assessment
of inferior oil processing in the hydrogenation REAC system.
THEORETICAL
Formation processes of ammonium salt particles
As shown in the process flow diagram of a hydrogenation REAC system (Figure 1), crude oil is dehydrated, and then flows into buffer tank with the
pressure raised by a high-pressure pump. The raw
material and hydrogen (including circulating hydrogen and new hydrogen) mix and then transfer heat with the reaction effluent in the heat exchanger. After the
pre-heating process in the furnace, this mixture enters
into the hydrogenation reactor (DC101A/B) and the hydrocracking reactor (DC102) in proper order for desulfurization, denitrification, deoxidization, and cracking reaction. The reaction effluent drains out from the bottom of the hydrocracking reactor (DC102), and flows through the heat exchanger (E01), the air coolers (EC101) and the heat exchanger (E02) in turn, and then it is separated into circulating hydrogen (reused in the loop), oil and sour liquid through the high pressure separator (FA103). Meanwhile, liquid injection points A and B are set before and after the heat exchanger (E01)
in upstream of air coolers, and the temperatures in inlet and outlet are 140ºC and 52ºC, respectively, and the operating pressure is 15.8 MPa.
Crude oil containing N and Cl will react with H2, and then produce NH3 and HCl. The temperature of air coolers will decrease under the action of a fan, and the NH4Cl crystallized particles can be generated with the
entry of reaction effluent according to the formula (1).
(1)
In general, the temperature of a reaction effluent
in tubes undergoes a continuous decrease. When the temperature decreases to below the NH4Cl crystallization temperature, NH4Cl will go through a sustained reversible crystallization reaction. The value of Kp (product of NH3 and HCl partial pressure) in the
gas phase obeys the change trend of the equilibrium
curve (Ou et al., 2011).
As shown in Figure 2, if the temperature decreases
by ΔT, the Kp value exceeds the corresponding equilibrium constant and NH4Cl particles start to crystallize and separate out. Then, the Kp value in the gas phase rapidly returns to the position of the crystallization equilibrium curve after NH4Cl
crystallization is finished, and this system restores
the equilibrium process. If the temperature decreases
( )
( )
( )
by again, n processes of crystallization are repeated
as such. When lim(ΔT)→0, the Kp value changes from the supersaturation position in the gas phase to the equilibrium position; therefore, the reduction of HCl or NH3 in this process is correlated with the reaction rate of NH4Cl salt. The total amount of NH4Cl crystallization can be expressed as the accumulation of each step. Based on the above principle, the amount of NH4Cl crystallization Q can be obtained by formula (2).
(2)
(3)
where K the equilibrium coefficient of NH4Cl and R is the ideal gas constant (= 8.31×10⁻³ kJ/(mol.K)).
All values were obtained by calculation (Jin et al., 2015). Therefore, the particle crystallization rate over
a certain time period can be acquired according to the above equations.
Governing equations and CFD modeling
The multiphase flow medium is the gas, oil and
water phase in the hydrogenation air cooler, so the Mixture model is chosen to solve the equations. The main phase is the gas phase, and the second phase is the oil and water phase.
The continuity equation of the mixed phase is
(Safaei et al., 2016; Akbari et al., 2016):
(4)
The momentum equation of the mixed phase is:
(5)
where n is the number of phase; F is the body force;
µm is the dynamic viscosity of the mixture; vdr,l is the
drift velocity of k phase; ρl is the density of l phase; φl is the volume fraction of l phase; σs is the additional
stress modification.
The RNG k - ε turbulent model is adopted to solve
the internal flow field parameters (Yakhot et al., 1986).
Turbulent kinetic energy k transport equation:
(6)
Turbulent dissipation rate ε transport equation:
(7)
where the turbulent viscosity µt is a function of turbulent kinetic energy k and turbulence dissipation rate ε; In addition, µt = ρCµk2 / ε /, C
1 = max{0.43, η /
(η+5) }, and η = Sk / ε. The model constant values C1ε, C2, σk, σε are set as 1.44, 1.9, 1.0, and 1.2, respectively
(Yakhot et al., 1986). S is the source item.
The equation of motion for the solid phase is given by:
(8)
where Fp (u-up) is the drag force per unit particle mass; g(ρp - ρ)/ ρp is gravity source; up is velocity of the particle phase; Fother is the other force (not be considered in this research). Fp is defined as formula (9).
(9)
where dp is the particle diameter; CD is the drag
coefficient; Re is the Reynolds number, defined as (Morsi et al., 1972):
(10)
Figure 1. Process flow diagram of a hydrogenation REAC system.
( )
Q PNH PHC PNH P2HC 4 PNHPHC K WP
m g
1 12 3 1
3 3
:
= + - Q + V-
-K
=
e
T176 0 285--R.T TY/ .0 75t
m:
m m0
2
2
d
t
+
t o
=
Q
V
Q
V
t mvm $ mv vm m p $
2 2
d d d
t + t =- +
Q
V
Q
V
"v v g F v ,
m m mT m l l dr l
k n
s
1
$ n d +d +t + +d$ { { +v
=
Q
V
T Y" %
/
t k x x
k
G G Y
j l
t
j k b M
2 2 2 2 2 2
t = n+nv + + -tf
-Q
V
#T Y &t
x
jx
C S
t j 1
2
2
2
2
2
2
tf
=
n
+
v
n
f
+
t
f
-f
Q
V
#
T Y&
C
k
v
C
k
C G
b 2 2 1 3t
f
f
f
-+
+
f fg
dt
du
F
u
u
F
p p p p p other
t
t
t
=
Q
-
V
+
Q
-
V
+
Re
F
d
C
18
24
p p p D 2$
t
n
=
Re
d u
p pu
n
t
-The deposition rate of solid particles is defined as:
(11)
where mp is the particle mass; Aface is the area of the cell face at the wall, Nparticles is the total amount of particles.
The half-structural diagram of a hydrogenation air cooler is shown in Figure 3. The whole structure can be obtained with a symmetrical arrangement and contains four parts, namely, inlet bend, header box, distribution plate, and tubes. A total of 24 tubes with
length 30 times bigger than its diameter (25mm) were placed in a single row to ensure a stable flow state. The
numerical orders of tubes from left to right along the direction of X-axis are T1 to T24, and the rows from up to down along the negative direction of the Y-axis are
R1 to R3. Multiphase flow medium, such as oil, vapor,
and liquid, enters into the header box through an inlet bend, and a rectangular distribution plate is set directly
facing to the outlet of the bend for uniform flow in the
header box and tubes.
The simulation domain is built on the basis of the above structure features. As shown in Figure 4, the structured mesh arrangement with hexahedral elements is utilized in the inlet bend and tubes, and the tetrahedral unstructured mesh is used in the header box and distribution plate. In this work, the grid independency study shows that a larger number of grids
will not influence the accuracy of this case when the
grid quantity is divided into 0.92 million, 1.16 million,
1.23 million, and 1.45 million, and the relative flow parameters, such as flow velocity or pressure drop,
do not change evidently. The grid number used in this case is approximately 1.16 million through integration taking into account calculation precision and time.
Figure 2. NH4Cl crystallization equilibrium curve and sketch of the crystallization process.
R
A
m
despositionface p
p N
1 partides
=
=
/
Figure 3. Structural diagram of hydrogenation air coolers used for CFD simulation.
Figure 4. Sketch of computational grids in hydrogenation air coolers.
In this case, the Reynolds number is 8.4×10⁵ as
the gas volume fraction is approximately 93%, and the RNG k - ε turbulent model is adopted to solve the
internal flow field parameters. The computational do -main is set as velocity inlet and pressure outlet. The shape of solid particles is assumed to be spheres, whi-ch are injected uniformly at the inlet at the same speed as the continuous phase. The roughness constant is set to the default value of 0.5. The physical parameters of
inlet multiphase flow are shown in Table 1.
The software of ANSYS Fluent is used for numerical simulations. This process was divided into
two steps: first, the Euler method was adopted for the
continuous phase, and then particle trajectories were tracked by the Lagrange approach. In this work, the
SIMPLE algorithm (Cui et al., 2014) was employed
to solve the coupling of the pressure and velocity
field. Standard discretization schemes were used for
the pressure terms, and the second-order upwind discretization schemes were used for the convection terms and divergence terms. The convergence criteria for all steady simulations were set to 10−5 for each equation. The standard wall function was set in combination with the previously discussed RNG k -
ε model. The number of continuous phase iterations
Chen et al., 2016). A total of 24733 particles would be
tracked in this simulation, and the density of particles was set as 1550 kg/m3.
Fast Search Clustering Algorithm (FSCA) Modeling
The FSCA is a one-time clustering algorithm based on the calculation of the sample distribution density and the sample distance. The algorithm assumes N no-label sample points Xj = [xj1,xj2, · · · , xjn,]T∈Rn (j = 1,2, L, N),
and the local density of every sample point j is defined
as:
(12)
(13)
where dji is the distance of samples and dc is the cutoff
distance with characteristic robustness with regard to large data; then, the distance for each sample j is built as:
(14)
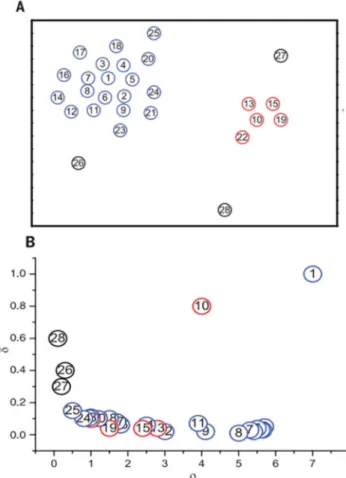
The δj value is determined by computing the minimum distance between point j and any other point with higher density. Thus, the ρj and δj of every sample point can be obtained. The point with large ρj and δj can be regarded as the clustering center, whereas the point with small ρj and large δj can be considered as an abnormal point, which does not belong to any of the clustering centers. The diagram of the algorithm process is shown in Figure 5.
The clustering process of the FSCA in two
dimensions (Rodriguez et al., 2014) is shown in
Figure 6. According to the above principle, results of the anomaly detection show that points 1 and 10 can be taken as the clustering centers, and points 26, 27 and 28 can be regarded as abnormal points.
The complexity analysis of the FSCA is described as follows. The algorithm assumes N sample points, and n-dimensional features in each data such as the calculation complexity of the distance of two points is n2. Every data need to be calculated for the distance
with the other data; thus, the complexity is N×n2. The Table 1. Physical parameters of inlet multiphase flow.
Phase Volume flux/(m3·h-1) Density/(kg·m-3) Volume fraction/% Viscosity/(kg·m-1·s -1)
Gas 135.70 39.76 93.47 1.54×10⁻⁵
Oil 7.60 661.20 5.23 2.28×10⁻⁴
Liquid 1.88 907.40 1.30 1.16×10⁻⁴
d
d
j ji c
i
t
=
/
|
Q
-
V
,
,
x
else
x
x
0
1
1
0
|
|
=
=
Q
Q
V
V
G
min
:d
j i i j ji
d
=
t2tQ V
Figure 5. The diagram of the algorithm process
Figure 6. Clustering process of FSCA in two dimensions A) distribution diagramof sample points, B) decision graph of sample
calculation of sample local density ρj is completed by
N×(N−1) times cutoff operation; then the minimum
distance δj was calculated. The local density and distance need to be subjected to linear scanning and comparison under the worst situation, and it is recorded as a 2N times' operation. Therefore, the calculation
complexity of the overall algorithm can be defined as N×n2 + N×(N − 1) + 2N = N×(n2 + N + 1).
The only parameter determined by a person is
the cutoff distance dc in the FSCA. In general, the maximum distance between samples is calculated
first, and then a percentage reduction is conducted
according to this distance. Meanwhile, the percentage of abnormal points in the overall samples is determined by combining the actual situation and manual experience. Finally, the number of abnormal points
can be determined. The cutoff distance dc is usually taken as the maximum distance Dmax from 10 % to 30%. In the next section, the comparison of abnormal points is conducted by considering 10%, 20%, and 30%, respectively, and combining with CFD results to
determine the final abnormal points.
RESULTS AND DISCUSSION
The distribution of continuous phase
The numerical simulation of the inner flow field in
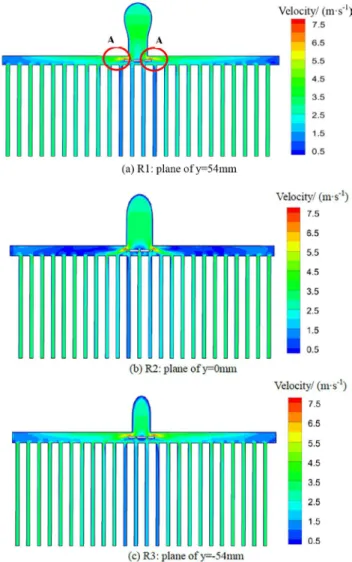
air coolers was conducted, and the velocity magnitu-de distribution of the horizontal center section in each row of tubes is shown in Figure 7. The plane of y = 54 mm represent the horizontal center section of the first row (R1), and the planes of y = 0 mm and y = −54 mm
represent the second and the third row, respectively.
As shown in Figure 7(a), the velocity is basically sym
-metrically distributed, and the multiphase flow velo -city from the center to both ends decreases gradually
owing to the increase in flow space in the header box.
As a rectangular distribution plate is set directly fa-cing to the outlet of the bend, the structure mutation
intensifies the turbulent state of this area, inducing se -vere mass and momentum exchange of the continuous phase. A symmetric distribution of a high velocity area
(zone A) forms near the distribution plate, where the
maximum velocity reaches 7.5 m/s. When the
multi-phase flow reaches both ends of the header box, the ve -locity decreases to below 2.0 m/s. The ve-locity in the leeward side of the distribution plate is 1.0-2.5 m/s
be-cause of the blocking effect, whereas that of the other tube area is 3.0-4.0 m/s. In Figure 7(a), 7(b), and 7(c),
the velocity distribution trend is basically consistent in three rows.
Figure 7. CFD result of the velocity magnitude distribution in the horizontal center section of each row.
The velocity vector distribution of the horizontal center section in R2 is shown in Figure 8. The biased
flow phenomenon appears after multiphase fluid impact
to the distribution plate, and a symmetric distribution of high velocity area and two circinate recirculation zones form on both sides of the distribution plate,
making a portion of fluid diffuse along the terminal direction of the header box, and the other fluid continues to flow into tubes.
Figure 9 shows the velocity distribution in the
longitudinal center section of the header box (plane of z = 0 mm), and the delaminating phenomenon of fluid
velocity forms due to the action of the distribution
plate, which acts as flow guide, thus making the whole fluid expand in an orderly manner along the terminal
direction of the header box.
The average liquid-phase fraction distribution
curve in every tube (Figure 10) presents a shape of
The distribution of solid particles
Statistical analysis of the amount of solid particles in tubes is shown in Figure 12, and a total of 24733 particles was tracked. The amount of solid particles seems to be relatively symmetric in R1 and R2, whereas the distribution of particles in R3 is asymmetric because of the non-uniform distribution of the particles under the carrying action of the liquid phase and the
bypass effect of the distribution plate. The multiphase fluid in R2 and R3 exceeds that in R1 because of the effect of gravity; thus, a relatively small amount of
solid particles in R1is formed. If the captured amount of solid particles in R2 and R3 in tubes is little, the concentration of NH4HS crystalline particle would be low, resulting in low risk of deposition or blockage
in the area and normal flow of liquid in tubes. With
a large captured amount of solid particles in R2 and
Figure 8. CFD result of velocity vector distribution in the horizontal center section of R2.
(the leeward side of the distribution plate) is also in a
relatively low level of velocity magnitude compared
with Figure 7 because of the blocking effect caused
by the distribution plate. In conclusion, a relatively high risk of ammonium salt crystallization deposition
or blockage is present in the tube areas of low fluid
velocity and liquid fraction.
In general, the distribution situation of fluid velocity and liquid fraction has a great influence on
ammonium salt crystallization deposition or blockage.
The data of average fluid velocity and liquid fraction
from the CFD simulation in every tube was exported from Fluent, and then the MATLAB software was implemented for anomaly detection by the FSCA. The
average fluid velocity and liquid fraction were taken
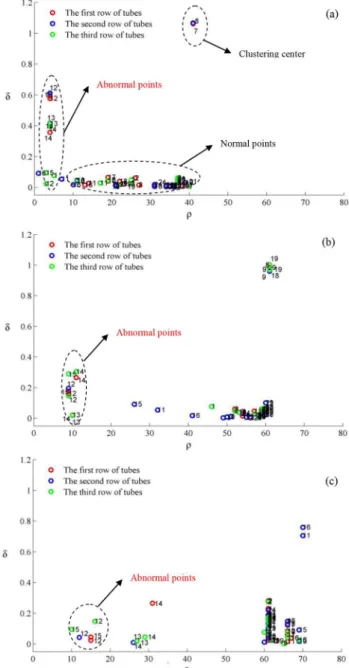
as two input variables, and the minimum distance δ was taken as the output variable; thus, the FSCA was two-dimensional with 72 total data. The comparison
with different cutoff percentages in tubes is shown in
Figure 11; the detection result shows that the area of T12-T15 is relatively abnormal compared with the other tubes. Meanwhile, the anomaly detection result
with 10% cutoff corresponds to the surface temperature distribution of air coolers on the spot (Figure 13).
Figure 9. CFD result of velocity magnitude distribution in the longitudinal center section of the header box
capture of particles is relatively minimal; however, the wall temperature is low in both ends of the header box because the tube area is seriously blocked in the junction of the header box and tubes.
Figure 11. The comparison of anomaly detection results with
different cutoff percentages in tubes (a) 10%, (b) 20%, (c) 30%.
R3, as shown in the areas of T6-T8 and T11-T15 in Figure12, the deposition rate is larger in this tube area
compared with the others (Figure 14) and increases the
risk of deposition or blockage. As an explanation, the
low liquid fraction or fluid velocity cannot dissolve crystalline particles or induce normal flow in tubes;
then, more ammonium salt will separate as the wall temperature of tubes decreases gradually under the fan
action; finally deposition or blockage in tubes forms.
As seen through comparison and analysis, the particle distribution situation in tubes not only basically agrees
with the surface temperature field (Figure 13) measured
by the infrared camera, but also with the distribution
rule of solid particle deposition rate (Figure 14). The
Figure 12. CFD result of percentage of particle amount distributions in tubes.
Figure 13. The surface temperature distribution of air coolers on the spot.
Figure 14. The comparison of particle deposition situation in the
The distribution of solid-phase particles deposition rate by the CFD simulation is shown in Figure 14. The particle deposition rate is higher in the bottom of the header box, and a serious deposition area is observed
at the end of the header box, and finally, the particles
deposit on the wall. The tube areas with low liquid
fraction or fluid velocity are at higher risk of deposition
or blockage; moreover, if particle deposition occurs in the junction of header box and tubes, the phenomenon of tube blockage will become increasingly serious until complete blockage occurs. The morphology of corrosion product deposition in the opened header box of air coolers is also shown in Figure 14. The main types of corrosion products after assaying are ammonium salt and FeS, and the deposition position occurs mainly at the end of the header box on the spot, basically in agreement with the distribution rule of solid particle deposition rate as simulated by CFD in the header box.
CONCLUSIONS
Based on the correlation technology process of the hydrogenation REAC system, ammonium salt crystallization and deposition in air coolers was
revealed, and the inner flow field was simulated
by using the mixture model and the discrete phase
model. When a multiphase medium flows through
the rectangular distribution plate, the phenomenon
of biased flow appears and makes the distribution of flow velocity and liquid phase fraction unbalanced.
Then, the MATLAB software was used for detecting the anomaly of tubes by the FSCA in two dimensions. In agreement with the distribution of the surface
temperature field in air coolers, a relatively higher
risk of deposition or blockage in the tube area is detected. The deposition rate of particles is higher at the bottom of the header box relative to other areas, and serious deposition areas are observed at the ends of the header box. If particle deposition occurs in the junction of the header box and tubes, the phenomenon of tube blockage will become increasingly serious until complete blockage occurs. With a large captured amount of solid particles in R2 and R3, as shown in the areas of T6-T8 and T11-T15, the deposition rate is larger in this tube area compared with the others and increases the risk of deposition or blockage. Good qualitative agreement was observed between the distribution rule of solid particles deposition rate as simulated by CFD and the deposition situation of an opened header box on the spot. These results can verify the prediction result of particle deposition by using the CFD-FSCA approach in air-cooling systems.
ACKNOWLEDGEMENTS
The project is supported by the National Natural
Science Foundation of China(51876194), National Key R&D Program of China (2017YFF0210403),
Zhejiang Provincial Natural Science Foundation of
China under Grant (LY17E060008 and LY17F030024),
Talent Project of Zhejiang Association for Science and
Technology (2017YCGC016).
NOMENCLATURE
CD drag coefficient dc cutoff distance
dp particle diameter (μm) dji distance between samples
F body force (N)
k turbulent kinetic energy (m2/s2)
K equilibrium coefficient of NH4Cl
mp particle mass (kg) n number of phase
Pm mixed pressure of multiphase flow (Pa) PHCl partial pressure of gas phase (Pa)
R ideal gas constant Re Reynolds number
T temperature in reaction system (K) up velocity of particle phase (m/s) vm average velocity of mixture (m/s) vdr,l drift velocity of l phase (m/s) Wg total mole number of gas phase
X coordinate (m) Y coordinate (m) Z coordinate (m) i, j sample point
ρm mixture density of multiphase flow (kg/m3)
ρp particle density (kg/m3)
μm dynamic viscosity of mixture (pa·s) μt turbulent viscosity (pa·s)
ρl density of l phase (kg/m3)
ρj local density of every sample point j φl volume fraction of l phase
σs additional stress modification ε turbulence dissipation rate
δj distance for each sample j
REFERENCES
Abbas O. A., Comparisons between data clustering
algorithms. Int. Arab J. Inf. Technol., 5(3), 320-325 (2008).
Akbari O. A., Safaei M. R., Goodarzi M., Akbar N. S., Zarringhalam M., Shabani G. A. S., Dahari M.,
flow and heat transfer in a 3-D curved microtube. Adv. Powder Technol., 27(5), 2175-2185 (2016).
Assidjo E., Yao B., Kisselmina K., Amané D., Modeling of an industrial drying process by
artificial neural networks. Braz. J. Chem. Eng., 74(25), 284-292 (2008).
Birant D., Kut A., ST-DBSCAN: An algorithm for clustering spatial-temporal data. Data Knowl. Eng.,
60(1), 208-221 (2007).
Chen S., Fan Y. P., Yan Z. H., Wang W., Lu C. X., CFD
simulation of gas-solid two-phase flow and mixing
in a FCC riser with feedstock injection. Powder
Technol., 287, 29-42 (2016).
Cui X. W., Lai H. X., Zhao L., A comparison of temporal discretization schemes for the SIMPLE
Method. J. Eng. Thermophys, 6, 476-479 (2014).
Dion M., Payne B., Grotewold D., Operating philosophy can reduce overhead corrosion boost
refinery reliability by controlling potential amine recyle loops. Hydrocarb. Process, 91(3), 45-47 (2012).
Elhamifar E., Vidal R., Sparse subspace clustering: Algorithm, theory, and applications. IEEE. T.
Pattern. Anal., 35(11), 2765-2781 (2013).
Fei F. L., Hu J., Wei J. X., Yu Q. J., Chen Z. S., Corrosion performance of steel reinforcement in simulated concrete pore solutions in the presence of imidazoline quaternary ammonium salt corrosion
inhibitor. Constr. Build. Mater., 70, 43-53 (2014).
Goodarzi M., Safaei M. R., Vafai K., Ahmadi G., Dahari M., Kazi S. N., Jomhari N., Investigation
of nanofluid mixed convection in a shallow cavity
using a two-phase mixture model. Int. J. Therm.
Sci., 75, 204-220 (2014).
Jenabali Jahromi S. A., Janghorban A., Assessment of corrosion in low carbon steel tubes of shiraz
refinery air coolers. Eng. Fail. Anal., 12(4), 569-577 (2005).
Jin H. Z., Wang K. X., Ou G. F., Ren H. Y., Wang K., Calculation model and analysis of ammonium salt crystallization rate in hydrogenation reaction
effluent based on aspen plus. Acta Petrol Sin: Pet Process Section, 31(6), 1444-1449 (2015).
Jin H. Z., Ou G. F., Wang Y. P., Cao J., Failure analysis and structure optimization of hydrogenation air-cooler system based on imbalanced degree, ASME PVP Conference, Prague, Czech Republic, 5,
439-448 (2010).
Karami A., Rezaei E., Shahhosseni M., Aghakhani M., Fuzzy logic to predict the heat transfer in an air
cooler equipped with different tube inserts. Int. J. Therm. Sci., 53(3), 141-147 (2012).
Kazemi-Beydokhti A., Azizi Namaghi H., Haj Asgarkhani M. A., Zeinali Heris S., Prediction of Stability and Thermal Conductivity of SnO2
Nanofluid Via Statistical Method and an Artificial Neural Network. Braz. J. Chem. Eng., 32(4), 903-917 (2015).
Lai J. Z. C., Huang T. J., Liaw Y. C., A fast k-means clustering algorithm using cluster center
displacement. Pattern Recogn., 42(11), 2551-2556 (2009).
Lemoine R., Behkish A., Sehabiague L., Heintz Y. J., Oukaci R., Morsi B. I., An algorithm for predicting the hydrodynamic and mass transfer parameters in bubble column and slurry bubble column reactors.
Fuel Process. Technol., 89(4), 322-343 (2008).
Lin B. Q., Xie X., Energy conservation potential in
China's petroleum refining industry: Evidence and
policy implications. Energ. Convers. Manage., 91,
377-386 (2015).
Massinaei M., Doostmohammadi R., Modeling of
bubble surface area flux in an industrial rougher column using artificial neural network and statistical techniques. Miner. Eng., 23(2), 83-90 (2010).
Morsi S. A., Alexander A. J., An investigation of
particle trajectories in two-phase flow systems. J. Fluid Mech., 55(2), 193-208 (1972).
Ou G. F., Wang K. X., Zhan J. L., Tang M., Liu H. H.,
Jin H. Z., Failure analysis of a reactor effluent air cooler. Eng. Fail. Anal., 31(7), 387-393 (2013).
Ou G. F., Jin H. Z., Xie H. P., Cao J., Qiu J., Prediction of ammonium salt deposition in hydroprocessing
air cooler tubes. Eng. Fail. Anal., 18(6), 1458-1464 (2011).
Petković D., Ćojbašić Ž., Nikolić V., Shamshirband
S., Kiah M. L. M., Anuar N. B., Wahab A. W. A., Adaptive neuro-fuzzy maximal power extraction of wind turbine with continuously variable
transmission. Energy, 64(1), 868-874 (2014).
Popova A., Christov M., Vasilev A., Mono-and dicationic benzothiazolic quaternary ammonium bromides as mild steel corrosion inhibitors. Part
III: Influence of the temperature on the inhibition process. Corros. Sci., 94, 70-78 (2015).
Pourtousi M., Sahu J. N., Ganesan P., Shamshirband S., Redzwan G., A combination of computational
column hydrodynamics. Powder Technol., 274(4), 466-481 (2015).
Radwan A. B., Abdullah A. M., Roven H. J., Mohamed A. M., Sk H., Failure analysis of 316L air cooler
stainless steel tube in a natural gas production field. Int. J. Electrochem. Sci., 10, 7606-7621 (2015).
Rahmanian B., Safaei M. R., Kazi S. N., Ahmadi G., Oztop H. F., Vafai K., Investigation of pollutant reduction by simulation of turbulent non-premixed pulverized coal combustion. Appl. Therm. Eng.,
73(1), 1222-1235 (2014).
Rodriguez A., Laio A., Clustering by fast search and
find of density peaks. Science, 344(6191), 1492-1496 (2014).
Toba K., Suzuki T., Kawano K., Sakai J., Effect of
relative humidity on ammonium chloride corrosion
in refineries. Corrosion, 67(5), 055005-1-055005-7 (2011).
Safaei M. R., Jahanbin A. H., Kianifar A., Gharehkhani S., Kherbeet A. S., Goodarzi M., Dahari M.,
Mathematical Modeling for Nanofluids Simulation:
A Review of the Latest Works. Modeling and
Simulation in Engineering Sciences (2016).
Shabanian S. R., Rahimi M., Shahhosseini M.,
Alsairafi A. A., CFD and experimental studies on
heat transfer enhancement in an air cooler equipped
with different tube inserts. Int. Commun. Heat. Mass., 38(3), 383-390 (2011).
Shammerl H. A., Mukhopadhyay P., Radhakishnan R., Preventing ammonium salt corrosion in high
pressure flash gas lines. Corrosion Conference,
Texas, San Antonio, 2010.
Shamshirband S., Malvandi A., Karimipour A.,
Goodarzi M., Afrand M., Petković D., Dahari
M., Mahmoodian N., Performance investigation of micro-and nano-sized particle erosion in a 90°elbow using an ANFIS model. Powder Technol.,
284, 336-343 (2015).
Shamshirband S., Anuar N. B., Kiah M. L. M., Patel A., Survey An appraisal and design of a multi-agent system based cooperative wireless intrusion detection computational intelligence technique.
Eng. Appl. Artif. Intel., 26(9), 2105-2127 (2013).
Yakhot V., Orszag S. A., Renormalization group analysis of turbulence. I. Basic theory. J. Sci.
Comput., 1(1), 3-51 (1986).
Zhu M., Ou G. F., Jin H. Z., Wang K., Zheng Z. J., Top of the REAC tube corrosion induced by under deposit corrosion of ammonium chloride and erosion corrosion. Eng. Fail. Anal., 57, 483-489