João Rui Fernandes Gomes
Licenciado em Engenharia Civil
Safe reuse of treated urban wastewater
in Praia, Cape Verde: a case study
Dissertação para a obtenção do Grau de Mestre em
Engenharia e Gestão da Água
Orientador: Prof. Doutor David José Fonseca Pereira,
Professor Auxiliar, Faculdade de Ciências e Tecnologia
da Universidade Nova de Lisboa (Portugal)
Co-orientador: Prof. Doutor Eduardo Moreno Cuesta,
Facultad de Ciencias Experimentales, Universidad de
Huelva (Espanha)
Júri:
Presidente: Prof. Doutor António Pedro de Nobre Carmona Rodrigues Arguente: Prof. Doutor Paulo Alexandre Marques Diogo
Vogal: Prof. Doutor David José Fonseca Pereira
Safe reuse of treated urban wastewater in Praia, Cape Verde: a case study João Gomes
Departamento de Ciências e Engenharia do Ambiente (DCEA)
João Rui Fernandes Gomes
Licenciado em Engenharia Civil
Safe reuse of treated urban wastewater
in Praia, Cape Verde: a case study
Dissertação para a obtenção do Grau de Mestre em
Engenharia e Gestão da Água
Orientador: Prof. Doutor David José Fonseca Pereira,
Professor Auxiliar, Faculdade de Ciências e Tecnologia
da Universidade Nova de Lisboa (Portugal)
Co-orientador: Prof. Doutor Eduardo Moreno Cuesta,
Facultad de Ciencias Experimentales, Universidad de
Huelva (Espanha)
Caparica
Statement of Copyright ©
Safe reuse of treated urban wastewater in Praia, Cape Verde: a case study © in the name of João Rui Fernandes Gomes, FCT/UNL and UNL:
“A Faculdade de Ciências e Tecnologia e a Universidade Nova de Lisboa têm o direito, perpétuo e sem limites geográficos, de arquivar e publicar esta dissertação através de exemplares impressos reproduzidos em papel ou de forma digital, ou por qualquer outro meio conhecido ou que venha a ser inventado, e de a divulgar através de repositórios científicos e de admitir a sua cópia e distribuição com objectivos educacionais ou de investigação, não
Agradecimentos
Este seria um dos capítulos opcionais e um dos quais pensei, injustamente, desprezar.
Contudo, a vida dá mesmo muitas voltas e pequenos acontecimentos, pequenos momentos, fazem-nos parar e pensar no que realmente importa e no que vale a pena. Sendo esta uma oportunidade única de exprimir o que sinto, não a poderia deixar passar em claro.
Após um ano particularmente complicado, não posso deixar de começar por agradecer a toda a equipa médica do Centro Hospitalar Barreiro-Montijo que me salvou a vida, nomeadamente ao Dr. Bolinhas e ao Dr. José Luis, não esquecendo também a equipa de auxiliares de acção médica, a equipa de enfermagem e restante equipa médica. Um sincero e enorme obrigado a todos, que nunca poderá pagar o que fizeram por mim.
Quero também deixar um a palavra de agradecimento a todos aqueles que estiveram ao meu lado e por todo o apoio que me deram, tenha sido pessoalmente ou com uma simples mensagem. Cada palavra, cada carinho, cada gesto, ajudaram-me muito nos momentos mais difíceis. Não posso nem quero particularizar ninguém, mas deu sem dúvida para perceber quem eram e quem são aqueles com quem verdadeiramente posso contar e contam comigo.
Amigos, família… Vocês sabem quem são…
Às extraordinárias e incansáveis pessoas que tornaram tudo isto possível, que nunca deixaram de lutar e a quem devo tudo o que consegui e grande parte do que sou hoje: obrigado por tudo, Mãe e Avó Glória.
Uma palavra especial também à minha Avó Viagem pela lição de vida que me tem transmitido
e aos meus irmãos: “Mano” Pedro e “Mana” Ana.
Àquele ser humano fantástico que está sempre presente e que mesmo não te consiga levantar, também nunca te deixa cair: thanks Iryna Shev, por tudo e mais alguma coisa. És única.
Quero deixar uma palavra saudosa aos que já cá não estão fisicamente e que eu gostaria que
tivessem feito parte desde momento: Pai, Avô João “Nadim” e Avô “Bábá”. Tommy, também
não serás esquecido (foram muitas as noites que estudámos juntos).
A todos os meus Colegas e Professores de mestrado que me acompanharam nesta aventura.
À empresa Aqualogy Aqua Ambiente – AGBAR, pelos dados fornecidos e pela oportunidade de
realizar um estágio profissional aquando da frequência do curso, mais concretamente ao Prof. Eng.º Carmona Rodrigues.
Resumo
Cabo Verde é um dos países onde o desenvolvimento e o crescimento socioeconómico se encontram em travagem devido a problemas de escassez de água. As consequências são
mais notórias na cidade de Praia, com uma população de cerca de 131.719 habitantes1. Isso
deve-se ao rápido desenvolvimento urbanístico e às consequentes necessidades especiais como irrigação, indústria e turismo. A região tem sido assolada pela seca durante vários anos consecutivos, sendo este um fenómeno de risco previsível. A falta de água é assim um factor que condiciona o desenvolvimento e bem-estar da cidade. Consequentemente, é imperativo o reconhecimento do valor da água e uma boa estratégia de racionamento da sua utilização, bem como a procura de formas de mobilizar novos recursos.
O estudo apresentado foi desenvolvido segundo uma metodologia baseada no uso da tecnologia de tratamento, purificação e reaproveitamento de água residual, bem como formas da reutilização segura da mesma para fins compatíveis. O trabalho inclui ainda uma análise técnico-económica relativa ao desenvolvimento do projecto de implementação, no qual foram estudadas várias alternativas que permitirão a reutilização da água tratada da cidade de Praia para os caudais actuais, assim como para ampliações futuras. Os resultados apresentados indicam que deve ser seguida uma orientação objectiva com vista à definição dos parâmetros de qualidade e das acções complementares necessárias para garantir a reutilização de uma forma segura da água, desde o ponto de vista directo da saúde humana até às zonas verdes, tais como áreas agrícolas ou espaços de utilização pública.
Assim, é importante considerar a preparação e o desenvolvimento de campanhas de sensibilização para a população de Cabo Verde, envolvendo autoridades locais e a formação social como uma força motriz para promover o uso eficiente da água, o conhecimento dos parâmetros de qualidade e evitar doenças de veiculação hídrica. Para melhorar o controlo da qualidade da água, em geral, é fundamental planear e organizar um estudo de comparação internacional de laboratórios de qualidade da água em diferentes regiões, e promover o desenvolvimento de seminários especializados para melhorar a capacidade técnica. Para promover o tratamento e reutilização de água tratada existem plataformas de formação virtual para desenvolver e promover o intercâmbio de experiências nestes domínios. Estas iniciativas serão reforçadas com a pesquisa e assistência técnica para avaliar o potencial e desenvolver projectos específicos de auto tratamento de águas residuais e a sua reutilização.
Termos chave: Sustentabilidade, água, reutilização, desenvolvimento, economia.
1 Dados do Instituto Nacional de Estatísticas (Censo 2010), correspondente a 26,9% do total da população nacional
Abstract
Cape Verde is one of the countries where the socio-economic development and growth are diminishing due to problems of water scarcity. The effects are more noticeable in the city of
Praia, with a population of about 131.719 inhabitants2. This is due to the rapid urban
development and the consequent special needs such as irrigation, industry and tourism. The region has suffered for several consecutive years the phenomenon of drought, which makes this occurrence an easily predictable one and turns the lack of water into a factor that constrains the development and well-being of the city. Consequently, it is imperative to recognize the value of water and to create a good strategy to ration its use, along with finding ways to mobilize new resources.
The presented study was developed using a methodology based on the use of the treatment, purification and reuse of wastewater technology, as well as secure ways reusing it for compatible proposes. The work also includes a technical and economic analysis related to the development of the implementation project, in which were studied several alternatives that allow the reuse of treated water from the city of Praia to the current flow, as well as for future expansions. The presented results indicate that there must be followed an objective orientation in order to define the quality parameters and the complementary actions necessary to ensure a safe re-use of water from the direct point of view of human health to the green areas, such as agricultural areas or spaces for public use.
Thus, it’s important to consider the preparation and development of awareness campaigns for
the population of Cape Verde, involving local authorities and the social formation as a driving force to promote the efficient use of water, knowledge of the quality parameters and prevent waterborne diseases. To improve the monitoring of water quality in general is essential to plan and organize a study of international comparison of water quality laboratories in different regions, and promote the development of specialized seminars to improve technical capacity. To promote the treatment and reuse of treated water are virtual training platforms to develop and promote the exchange of experience in these fields. These initiatives will be strengthened through research and technical assistance to assess the potential and develop specific projects of self-wastewater treatment and reuse.
Key words: Development, Economy, Reuse, Sustainability, Water.
2Data from the National Institute of Statistics (2010 Census), corresponding to 26.9% of the total national population
Index
Statement of Copyright © ...iii
Agradecimentos ... v
Resumo ... vii
Abstract ... ix
Index ... xi
Index of Figures...xiii
Index of Tables ... xv
Abbreviations list ... xvi
1. Introduction ... 1
1.1 Description of the researching area: empirical context ... 1
1.2 Identification of the problem and research issues ... 2
1.3 Description of the methodological approach: scope and work objectives and study methodology 4 -1.3.1 Scope and objectives ... 4
-1.3.2 Methodology ... 5
-2. Literary review ... 7
-3. Territorial context ... 10
3.1 The archipelago of Cape Verde ... 10
3.2 Santiago Island: Praia ... 11
-4. Population study and economic situation ... 13
4.1 Economic situation ... 17
-5. Analysis and diagnosis of sanitation systems, purification and regeneration ... 19
5.1 Infrastructure of supply ... 19
-5.1.1 Synthesis of the problem ... 20
5.2 Sanitation infrastructures ... 20
-5.2.1 Synthesis of the problem ... 24
5.3 Wastewater treatment plant ... 24
-5.3.1 Overview ... 24
-5.3.2 Diagnosis of the facilities and its operation ... 26
-5.3.3 Problem summary ... 31
-6. Water needs and available resources in irrigation areas ... 33
-6.1 Work Methodology ... 33
-6.2 Hydric needs of parks, gardens and urban gardens ... 33
-6.2.1 Calculation method of ET and ET0 ... 34
6.3 Climate data ... 36
-6.3.1 Pluviometry ... 36
-6.3.2 Temperature ... 38
-6.3.3 Wind ... 39
-6.3.5 Radiation... 40
6.4 ET0 Calculation ... 41
6.5 Coefficients Kc and Kj ... 41
6.6 ET coefficient calculation ... 43
6.7 Hydric Needs ... 43
6.8 Work phases, zones and irrigation hydric needs ... 45
6.9 Available resources ... 46
-7. Irrigation, transportation and primary networks ... 49
7.1 Proposed actions ... 49
-7.2 Implementation phases of actions ... 50
-7.2.1 Phase 1 ... 51
-7.2.2 Phase 2 ... 54
-7.2.3 Phase 3 ... 56
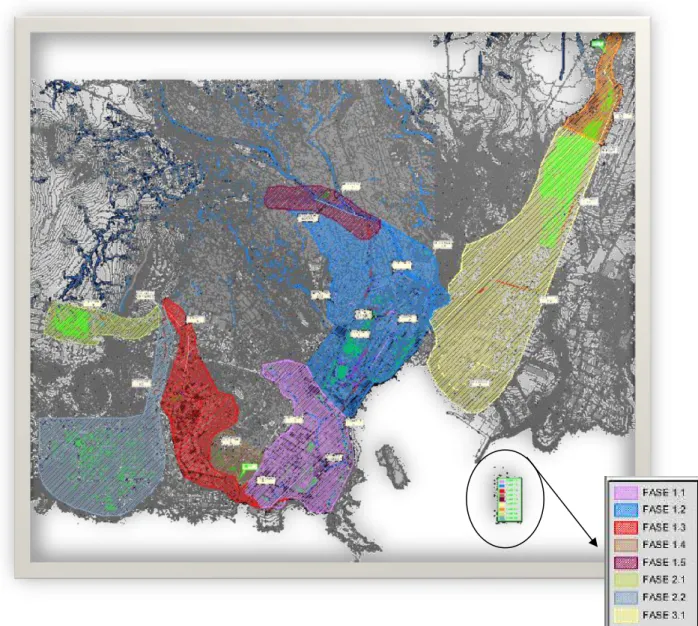
-7.3 Phases diagram and sectors ... 58
-8. Determination of water quality reclaimed ... 59
8.1 Irrigation water quality ... 59
8.2 Frequency of sampling and analysis ... 65
8.3 Conformity criteria ... 67
8.4 Management measures against violations... 68
8.5 Samples analysis ... 68
8.6 Global Regulatory Reuse ... 69
-9. Regulation and good practice using ... 71
9.1 Good practice in the network and sewerage system ... 72
9.2 Good practice in purification, depuration and regeneration ... 72
9.3 Good practices in reuse: storage, use and distribution ... 73
9.4 Good practices in the application of water to irrigate ... 75
-9.4.1 General and information ... 76
-9.4.2 Design and Implementation ... 76
-9.4.3 Signals ... 77
9.5 Irrigation system: rational, efficient and thrifty use of water ... 79
9.6 Risk prevention, health and safety ... 85
9.7 Risks and sanitation prevention ... 85
-10. Results and discussion ... 87
-11. Conclusions ... 91
-12. References ... 95
Annexes ... 99
-Annex I – Regenerated water quality normative and uses ... 100
-Index of Figures
Figure 4.1 Mapping of support and reasoning of grouping neighborhoods by source: INE ... 14
-Figure 4.2 - Chart - Population evolution of the Municipality of Praia 1994 – 2010 by source: INE ... 14
Figure 4.3 Actual scenario by source: INE ... 16
-Figure 5.1 – Wastewater evacuation sources ... 21
-Figure 5.2 - Sewerage (magenta) and rainwater drainage (yellow) by source: Aqualogy Aqua Ambiente, 2012 ... 22
-Figure 5.3 – Location of WWTP in Palmarejo and wastewater pumping stations (WWPS); source: Aqualogy Aqua Ambiente ... 23
-Figure 5.4 - Pumping stations “in situ”; source: Aqualogy Aqua Ambiente ... 23
Figure 5.5 WWTP orthophotography; source: Aqualogy Aqua Ambiente ... 24
Figure 5.6 WWTP Implementation Plan by source: Aqualogy Aqua Ambiente... 25
Figure 5.7 Disused Sand Storage by source: Aqualogy Aqua Ambiente ... 27
Figure 5.8 Primary decanters by source: Aqualogy Aqua Ambiente ... 27
Figure 5.9 State of preservation of Disused Primary Decanter by source: Aqualogy Aqua Ambiente 28 Figure 5.10 Water outflow of the primary decanter by source: Aqualogy Aqua Ambiente ... 28
Figure 5.11 Secondary Decanter by source: Aqualogy Aqua Ambiente ... 29
Figure 5.12 Band Filters by source: Aqualogy Aqua Ambiente ... 29
Figure 5.13 Pathologies in concrete by source: Aqualogy Aqua Ambiente ... 30
Figure 5.14 Storage Area by source: Aqualogy Aqua Ambiente ... 30
Figure 5.15 WWTP Laboratory by source: Aqualogy Aqua Ambiente ... 31
-Figure 6.1 - Prediction of ET0 from the factor f Blaney-Criddle, for different conditions of low relative humidity, daily sunshine hours and diurnal winds. Source: FAO Bulletin No. 24 ... 35
Figure 6.2 Chart Pluviometric data: 19762008. Source: PDM ... 37
-Figure 6.3 - Chart - Monthly average pluviometry. Source: “Modelação Espacial da Precipitação Ilha de Santiago, Cabo Verde, with the Geostatistical Analyst, of Silva, J., Monteiro, P., Negreiros, J., Aguilar, F, Aguilar, M.” ... 37
Figure 6.4 Chart Monthly mean temperature from 1981 to 2009. Source: PDM ... 38
Figure 6.5 Chart Monthly mean temperatures. Source: PDM ... 38
Figure 6.6 Chart Monthly average wind from 1981 to 2000. Source: PDM ... 39
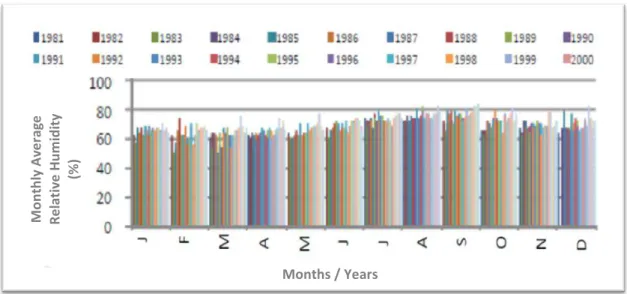
Figure 6.7 Chart Monthly average relative humidity from 1976 to 2008. Source: PDM ... 40
Figure 6.8 Chart 19762008 monthly average insolation. Source: PDM ... 40
Figure 6.9 Chart ET distribution for each month ... 43
Figure 7.1 Irrigation phases by source: Aqualogy Aqua Ambiente ... 51
Figure 7.2 Phase 1.1 by source: Aqualogy Aqua Ambiente ... 52
Figure 7.3 Phase 1.2 by source: Aqualogy Aqua Ambiente ... 53
Figure 7.4 Phase 1.3 by source: Aqualogy Aqua Ambiente ... 53
Figure 7.5 Phase 1.4 by source: Aqualogy Aqua Ambiente ... 54
Figure 7.6 Phase 1.5 by source: Aqualogy Aqua Ambiente ... 54
Figure 7.7 Phase 2.1 by source: Aqualogy Aqua Ambiente ... 55
Figure 7.9 Phase 3.1 by source: Aqualogy Aqua Ambiente ... 56
Figure 7.10 Phase 3.2 by source: Aqualogy Aqua Ambiente ... 56
-Figure 7.11 - Distribution of water in the left figure and the salts inside the wet bulb right figure. Source: Manual de Riego de Jardines de la Consejería de Agricultura y Pesca de la Junta de Andalucía. ... 57
-Figure 7.12 – Dropper by source: Aqualogy Aqua Ambiente ... 57
-Figure 7.13 - Diagram – Phases and sectors ... 58
Figure 9.1 Manhole covers of reclaimed water; source: Aqualogy Aqua Ambiente... 74
Figure 9.2 Reclaimed water pipe in a trench; source: Aqualogy Aqua Ambiente ... 75
Figure 9.3 Covers of reclaimed water; source: Aqualogy Aqua Ambiente ... 76
Figure 9.4 Reclaimed water pipe in the irrigation area; source: Aqualogy Aqua Ambiente ... 77
Figure 9.5 Prohibition signs by source: Aqualogy Aqua Ambiente ... 78
Figure 9.6 Information signs source: Aqualogy Aqua Ambiente ... 78
-Figure 9.7 - Integrated drippers, punctured, interlining. Source: “Manual de riego de jardines de la Junta de Andalucía”. ... 79
Figure 9.8 Wet area. Source: Manual de riego de jardines de la Junta de Andalucía... 83
-Index of Tables
Table 3.1 - Physical characteristics of the Cape Verde inhabited islands; source: National Institute of
Meteorology and Geophysics (INMG) ... 11
-Table 4.1 - Estimated population by neighborhoods by source: INE – Census 2010 ... 13
Table 4.2 Evolution of the population by source: INE ... 15
-Table 4.3 – Population distribution by source: INE ... 15
Table 4.4 Projection by neighborhoods; source: INE ... 17
Table 6.1 Values of p for 15° and 20° latitude ... 36
Table 6.2 Monthly average temperature; source: PDM ... 38
Table 6.3 ET0 calculation values ... 41
Table 6.4 Values of the coefficient Kj ... 42
Table 6.5 ET coefficient calculation ... 43
Table 6.6 Hydric needs calculation ... 45
-Table 6.7 – Gross needs and flows to irrigation process ... 46
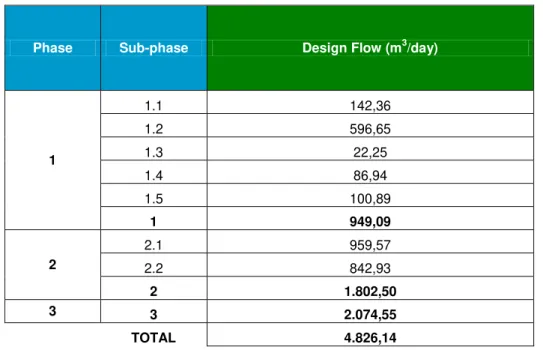
-Table 6.8 - Summary table of the phases and the design flow a) by source: Aqualogy Aqua Ambiente .- 46 -Table 7.1 - Summary table of the phases and the design flow a) by source: Aqualogy Aqua Ambiente .- 50 -Table 8.1 - Anexx I.A. Quality criteria for water reuse according to their uses (irrigation of urban green areas) ... 60
-Table 8.2 - Checking and monitoring of E.Coli for different degrees of wastewater treatment (A to H). Source: WHO. ... 61
Table 8.3 Sanitary objectives for wastewater use in agriculture. Source: WHO. ... 62
Table 8.4 Sanitary objectives for wastewater use in agriculture. Source: WHO. ... 62
-Table 8.5 - Recommendations quality for water reuse as restrictiveness of use and irrigation mode (sprinkler irrigation, surface irrigation, drip irrigation). Source: WHO. ... 63
Table 8.6 Recommended maximum concentrations of elements for crop irrigation. Source: WHO. . 64
Table 8.7 Quality of reclaimed water in Praia. ... 65
Table 8.8 Frequency analysis. Source: Decreto Real 1620/2007 ... 66
Table 8.9 Frequency of analysis in Praia ... 67
Table 8.10 Maximum deviation for the maximum value adopted in Praia ... 68
Table 8.11 Method of analysis of the samples (microbiological) ... 69
Table 8.12 Method of analysis of samples (parameters contaminants) ... 69
Table 9.1 Quality criteria for water reuse according to their uses (irrigation of urban green areas) ... 71
Table 9.2 Shutter sensitivity. Source: Manual de riego de jardines de la Junta de Andalucía. ... 80
-Table 9.3 - Recommended systems. Source: Manual de Buenas Prácticas de uso de Aguas Regeneradas (2011) de la Asociación Española de Abastecimientos de Agua y Saneamiento. ... 81
-Abbreviations list
AECID - Spanish Agency of International Cooperation for Development
INE - National Statistics Institute of Cape Verde
MDGs - Millennium Development Goals
ELECTRA - Water and Electricity Company of Cape Verde
SAAS - Autonomous Water and Sanitation Utilities
UV - Ultra Violet
PDM - Municipal Master Plan
NTMR - Technical Normative of Regulation
MAC - Madeira, Azores, Canary Islands
CE - European Commission
ITC -Technological Institute of the Canary Islands
UN - United Nations
PANA - National Action Plan for the Environment
INMG - National Institute of Meteorology and Geophysics
TCMA - Annual Average Growth Rate
UPI - Units of Informal Production
IDAM - Seawater Desalination Plant
ADA - Water Distribution Agency
INHAB - Inhabitants
WWPS - Wastewater Pumping Stations
WWTP - Wastewater Treatment Plant
DN - Nominal Diameter
PCS - Pieces
R - Reserve
INGRH - National Institute of Management of Water Resources
FAO - Food and Agriculture Organization
PAGI - Program to Improve Irrigation Management
FUCAEX - Canary Foundation for External Action
ANMVC - National Association of Municipalities of Cape Verde
1.
Introduction
1.1 Description of the researching area: empirical context
The recycling or reuse of water is not a new concept in the history of our planet. Nature, through the hydrological cycle, have been recycling and reusing water for millions of years, with relative
efficiency (Sautchúk et al., 2004; Moruzzi et al., 2008).
Cities, farmlands and industries use in an indirect, or at least a non-planned way, reused water resulting from the use of water for downstream users that capture waters which have already been used and returned to the rivers by users of amount. Millions of persons worldwide are
supplied by this indirect form of water reuse (Crook, 1996; Sautchúk et al., 2004).
For many years this system worked broadly well, however it doesn't happen anymore in many regions, because of the worsening pollution conditions, basically due to lack of adequate
treatment of urban waste water, when not by its total absence (Blumenthal et al., 2000).
Then it was developed a form named direct reuse, which is the one when an effluent is treated for reuse in a particular purpose, that can be internal to the enterprise itself, or external, for a purpose other than the first, as for example, the practice of reusing treated municipal wastewater for agricultural purposes (Piva, 2004; Kelman, 2004).
The direct or planned form uses technologies and practices of renewal and reuse of water, which went through a series of stages over the last two hundred years (Crook, 1996). The first phase was motivated by a conservationist concept-based form which says that the droppings of society should be conserved and used for preserving the fertility of soils, while the other, a more pragmatic approach, was directed to the elimination of rivers pollution. At the end of the 19th century, the concept of domestic wastewater treatment by disposal in soils was used in Britain, Germany and the United States with a central focus on reducing river pollution and not as a conservationist method of aquifer recharge or augmentation of nutrients to the soil (Crook 1996; Sautchúk et al., 2004).
In the second phase, which can be considered until the late 1990s, the main focus was primarily
the need to conserve and reuse water in arid zones (Sautchúk et al., 2004). There has been
considerable effort to reuse water for agricultural development in arid zones of the United States, like California and Texas, and in countries like South Africa, Israel and India.
investments required to treat effluents, it becomes more advantageous to reuse these effluents
instead of releasing them back into the rivers (Gonçalves et al., 2010)
The limitation of freshwater reserves on the planet, increasing water needs to cater mainly for human consumption as for example agricultural and industrial, priority for use of available water resources for public supply and the restrictions that are being imposed in relation to the release of effluents in the environment, makes necessary the adoption of strategies aimed at rationalizing the use of water resources and mitigating negative impacts relating to wastewater
generation by industries (Sautchúk et al., 2004; Rio +20, 2012).
Moreover, the heterogeneity of the distribution of water resources and population in the various regions of our planet makes it increasingly difficult to supply some regions, mainly the metropolitan, with the consequence of gradual increases in the cost of providing water
(Sautchúk et al., 2004).
In this context, conservationist practices, such as the efficient use and reuse of water, are a smart way to expand the number of users of a water supply system, without the need for large investments in the expansion or installation of new water supply systems (Mierzwa, 2000;
Gonçalves et al., 2010).
1.2
Identification of the problem and research issues
The lack of water has always been a problem for some regions of the planet, in the same way that its excess is also a problem for other regions. Cape Verde has suffered by continuous threat of drought, with the lack of rainfall in some periods and in others with its irregular occurrence within the region. The phenomenon of drought occurs with great frequency, occasionally for years at a time. Because it is a phenomenon which has been repeated over the years, should be seen as a likely risk and sometimes anticipated (Gominho, 2010).
Since 1975 (the date of Independence of Cape Verde), begins a clear prioritization policy in the water sector that focuses on providing the population in amounts that meet basic household needs. In spite of its limitations, efforts in Cape Verde to meet the needs of water for domestic consumption and for productive activities have brought good coverage of potable water supply to the population through public systems and the maintenance of area irrigated with groundwater. This process has played an important role in water desalination. Currently underway is a major reform in the water sector, with the implementation of the National Plan for Water Resources Management in 2020, particularly in the institutional and legal framework aimed at developing the new demands and expectations of the population and the dynamic
Cape Verde currently carries a very special dynamic private sector participation in the production and supply of drinking water and the process of decentralization and autonomy of the water sector, however you still need to exist create an enabling environment to promote the private sector. The country has made great strides in offering not only the population, but also in terms of increasing the availability of water for agriculture and tourism and its rationalization by introducing new irrigation technologies and water use. In recent years they have built new facilities, among which the first dam of Cape Verde on the island of Santiago (in the framework of cooperation of China), the country's largest hydropower project that marked a milestone in the approach to managing surface water in Cape Verde (AECID, 2012).
In general, access to water in Cape Verde is problematic and its effects are transversal. Moreover, internationally referred to the progress made by the country in the past 35 years and future challenges to satisfy their service population with a reasonably good water and sanitation (Rodríguez et al., 2011). In 2007, according to the National Statistics Institute (INE, 2007) of Cape Verde, this year reached the targets set by the Millennium Development Goals (MDGs) in how to access to drinking water, which the other surrounding countries hope to achieve by 2015. The biggest challenge is to maintain these achievements and combat inequalities that have occurred, especially among those between the countryside and cities.
According to data published by the INE (INE, 2007), Cape Verde has, in terms of water supply and sanitation, a coverage rate consistent with the goals outlined in the MDGs, in spite of the enormous regional and even local differences. About 85% of households are served by Cape Verdeans safe sources of drinking water; this scenario is not uniform when compared with coverage rates between the urban and rural areas. In cities, the coverage rate of access to drinking water is approximately 93% and in rural areas the rate is 74%. The municipalities of Sal with 99.4%, Maio with 98%, Boavista with 93.3%, Ribeira Brava and Tarrafal with 92.6%, São Vicente with 87.4% and Brava with 87%, are listed in the "ranking" of the municipalities better supplied.
The scenario is less attractive when analyzing the data by county and by type of water source. In fact, only 40% of Cape Verdean families have access to piped water, which is distributed through the public network provided by Electra or Autonomous Water and Sanitation Utilities (SAAS).
while in rural areas, public fountains are still supply means for 63% of households. The tankers (tanker trucks) also supply water to a significant number of people.
The analysis of this indicator is important for evaluating the effort remains to be done in the field of water supply in Cape Verde, not only in the context of the MDGs, but mainly as a way to further democratize unrestricted access large stores of society are still not properly. Their analysis also allows understanding the degree and extent of regional disparities in the supply of household water.
As can be seen in Cape Verde (particularly in Praia), population growth, urban development and increasing needs for irrigation, tourism and industry, coupled with drought in recent years has caused deprivation, which tend to worsen over time if urgent and necessary measures are not taken. Thus, the water becomes a feature, both the quantity and the quality, condition for economic development and social welfare of this county.
The current problems that arise in the field of water resources in Praia impose the need to seek to prevent the increasing scarcity of water, can hinder the desirable socio-economic development. Along with the growing demand for ways to mobilize new resources, you must define all possible means to draw on in the future to rationalize the use of water in order to obtain the maximum benefit for all Cape Verdeans.
It is therefore essential to adopt a suitable management policy that aims not only to a better utilization of the available water, but also a careful management of the use and recognition of the importance of water as a factor of production in the various sectors of social and economic activity: agriculture, industry, commerce, sanitation, environment, public works, tourism, and so on.
1.3
Description of the methodological approach: scope and work
objectives and study methodology
1.3.1 Scope and objectives
In the city of Praia, about 30% of the population privately benefits of a sewage disposal system, of which 9% are linked to a sewage system. The most widely used form of evacuation is the septic tank. The city has a wastewater treatment plant, managed by Electra, where it is the primary treatment, secondary and tertiary treatment of a part. This includes UV treatment and
chlorination. They produce about 800 m3/day of treated water with tertiary level but into the sea
due to lack of infrastructure for reuse (Suárez et al., 2011).
In this sense and with the purpose of finding a solution aimed at sustainable use of water
available, the Study of the safe reuse of urban wastewater treated in Praia (Cape Verde) will be
Promote the awareness of the use of drinking water, quality control capacities of water resources, encouraging treatment and reuse of treated water;
Technical and economic analysis for the development of the final design that enables
the reuse of treated water from the City of Praia, for current flows and future upgrades;
Define the required quality parameters and actions needed to ensure safe reuse from
the point of view of health and in green areas such as agriculture or agroforestry;
Propose and analyze the development of awareness campaigns to the population in
Cape Verde, involving local and social facilitators training to promote efficient water use, knowledge of the quality parameters and prevent waterborne diseases;
Organizing an international study comparing water quality laboratories in different
regions, as well as encourage the development of specialized seminars to strengthen the technical capacity;
In order to promote the treatment and reuse of treated water in Cape Verde are
proposed studies to assess the potential and develop autonomous suggestions of wastewater treatment and reuse of treated wastewater;
Evaluate the economic impact of the project for the Cape Verde’s population;
Apply a good practices rules manual of awareness for using and preservation of treated
wastewater.
1.3.2 Methodology
The methodology to be followed for the Study of safe use of urban treated wastewater in Praia (Cape Verde) follows the objectives and specifications defined in the ISLHáGUA Project, which has essentially the ground of progress of the Municipal Master Plan (PDM) of Praia, which is expected to do the complete irrigation of the city with recovered water.
Following the terms of the plan which aims to secure reuse of treated waste water for irrigation, seen as an opportunity for the development of Praia, and taking into account the intended purposes (irrigation of gardens and squares; irrigation of urban market gardens; irrigation of ornamental plants; manufacture of concrete) the study methodology is the following:
Preliminary Work: collection and analysis of existing information and documents of the
study field; of the initial field work and study of existing criteria, standards or legislation in this area, nationally and internationally;
Diagnosis of the existing system and future potentialities: study of the sanitation
Determining the quality of the recovered water: calculation of the minimal quality of recovered water in order to regard the criteria of health, respecting the standards of the World Health Organization, but also to the agronomic criteria.
Study of requirements and needs: identification, study and precise water
characterization from a quantitative point of view and taking into account the seasonality, potential uses for irrigation of green areas, parks and gardens and agricultural irrigation (gardens and urban gardens);
Proposal for improvements in sanitation, purification and regeneration: calculation
of the necessary improvements and actions to ensure that the treatment system, sanitation and tertiary treatment can guarantee the minimal conditions laid down as requirements;
Proposal for the creation of infrastructure for collection, storage, transport and
distribution: analysis, planning and identification of necessary infrastructure to capture, control, transport, treatment, storage and distribution network to ensure the supply, in quality and quantity, optimizing the system in terms of energy and economic efficiency.
Proposal for an infrastructure of irrigation and pressure control (in the sectors of
irrigation) or primary network: analysis, planning and identification of necessary
infrastructure for irrigation systems, allowing the monitoring and optimization of network performance;
Establishment of an indicative index for future municipal directing technical
regulations for the re-use of treated water, as well as the development of a good
practice guide: establish an index to the Technical Normative of Regulation (NTMR)
onreuse of treated water and developing a good practice guide, pursuing the aim of
2.
Literary review
As in any work, and in this case of a real project, the literary review plays a key role in addressing the particular issue, because it is through it that I intend to situate my work within the large area of research which it is part of, contextualizing it in order to frame the issue with a credible research proposal.
With the first guidelines of the work already outlined and with previous knowledge acquired about the situation of water resources in Cape Verde, I sought to frame the issue from the perspective of awareness on the use of drinking water, enhancing the ability to control the quality of water resources, encouraging treatment and reuse of treated wastewater and desalination with more efficiency and use of renewable energy.
These guidelines, led to scientific literature. This research based on facts previously identified and reported by credible researchers and authors, primarily in published papers with internationally recognized value, being subject to an anonymous and very careful review by
experts in the field, has directed me to one of the axes of the Transnational Cooperation
Programme (MAC 2007-2013), published by the European Commission (CE): strengthening the capacities and skills relating to the management of water resources in the islands.
Regarding the study area in question, the document stresses the importance of managing water resources through projects that have developed innovative techniques for sustainable water management, as well as tools for awareness and sensitization of citizens.
Improve the sustainable management of water resources, energy and waste, meets the overall objective that underpins the strategy adopted in the current Program that is, on the one hand, increase levels of development and socio-economic integration of the three archipelagos, fostering a strategy that will aim to boost the knowledge society and sustainable development, and, second, to improve the levels of socio-economic integration of space cooperation with countries of geographical and cultural proximity, thus integrating the overall strategy of the program, one of strategic priorities with clear objectives and indicators.
It is important that the regions of this cooperation space may know the quality and quantity of its energy resources available to thereby carry out management practices optimal for the water resources; make a correct use of renewable energy (solar, wind, hydro ...) and implement an integral waste management, sustainable, efficient and of quality.
Aimed to improve the efficiency of the management of natural resources, mainly those related
to water, waste and energy, following the MAC framework, and in order to consider the
promote the efficient use of water; knowledge of quality parameters and prevent waterborne
diseases, especially in Cape Verde, arises ISLHáGUA Project, developed in a partnership
between Technological Institute of the Canary Islands (ITC) and the Canary Islands
Government. This publication aims to improve the monitoring of water quality in general, it is planning to organize an international comparison study of water quality laboratories in different regions, and promote the development of specialized seminars to improve technical ability. To promote the treatment and reuse of treated water and desalination with renewable energy in arid areas of the Canary Islands and Cape Verde, there are virtual training platforms to develop and promote the exchange of experience in these fields. These initiatives will be strengthened through research and technical assistance to assess the potential and develop specific projects of wastewater self-treatment, reuse of treated wastewater and desalination with renewable
energies, which lead to study of safe reuse of treated urban wastewater in Praia, Cape Verde.
This study was handled by the Spanish company, Aqualogy – Aqua Ambiente (AGBAR Group),
which I had the opportunity to integrate.
Scientifically, this study is based on the two previous references and further scientific documentation, technical reports, meeting minutes and studies "in situ" provided by entities involved in the project. Among this documentation, there is a publication in order to support
regional issues of research that stands out, with local focus: the Preliminary Municipal Master
Plan of Praia - Santiago Island.
In depth and selective analysis of the existing literature, oriented to the objective, and with a high level of critical spirit, should be noted that in Cape Verde there is no specific regulation of water quality criteria for irrigation reuse. Therefore, the sources to determine the quality criteria to reuse water in irrigation schemes in Praia are exposed on Annex I.
Regarding the research area, the adopted orientation tends to justify the relevance of the topic, considering some of the research and work done previously. Firstly there is to consider the
Conference Report RIO +20 (United Nations Conference for Sustainable Development), which covers the territory under study, Cape Verde, in the context of sustainable development. The complexity of water management in Cape Verde, where there are still many obstacles and challenges, since the ownership of the water is not clear, making it difficult to watershed management; social conflicts are frequent regarding the use of water and in relation to pollution, the rural population is not adequately addressed in the management of water resources. However, it is noted herein that Cape Verde has the necessary tools for the evolution of water management, which is the Water Code that allows aspire to a good scientific approach in this regard (Gominho, 2010).
A further highlight is to the publication of the Ministry of Environment , Agriculture and Fisheries
of Cape Verde with the Segundo Plano de Acção Nacional para o Ambiente 2004-2014 (2nd
considering always a great futuristic vision, beyond the year 2014 , seeking to mobilize resources; construction of hydraulic infrastructures that allow people's access to water in good health and hygiene conditions and reduction of water losses in agriculture. The protection of water resources against pollution is also a factor to consider.
Also bearing in mind specific publications in the area of the use and reuse of treated
wastewater, including Portuguese scientific publication Série GUIAS TÉCNICOS 14 –
Reutilização de Águas Residuais (Wastewater reuse), detailing the various procedures required to implement successful projects for the reuse of treated wastewater, revealing itself to be a basis of support essential to this study.
Irrigation being one of the basic guidelines of the study, it is essential to refer to the publication
“L'utilisation Des Eaux Usées Épurées En Irrigation –2011”, a technical paper with international content extremely useful regarding the system of irrigation with treated wastewater.
3.
Territorial context
3.1
The archipelago of Cape Verde
The Cape Verde archipelago is formed by ten Islands and thirteen islets and it is located about 1.300 km south of the Canary Islands and about 500 miles west of Dakar, Senegal.
The Western Islands are relatively high and with rugged topography, meanwhile the Oriental Islands present a low and flat structure. The archipelago is divided into two groups according to their geographical location: Sotavento and Barlavento.
Barlavento is located to the North of the archipelago and includes the islands of Santo Antão, São Vicente, Santa Luzia, São Nicolau, Sal and Boa Vista. The latter two lie more to the East, as well as the islanders Branco and Raso and.
The islands of Maio, Santiago, Fogo and Brava and the islet Rombo belong
to the Sotavento group. The surface of the archipelago is approximately some 4.033 km2, more
than half of the Canary Islands and has a total resident population around the half a million inhabitants, virtually, less than a quarter of the total population of Canaries.
Santiago, Brava and Santo Antão. The islands of Sal, Boa Vista and Maio receive a lesser amount of precipitation. The remaining islands have an intermediate rainfall conditions.
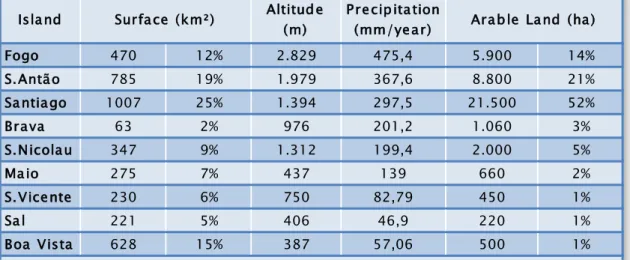
Table 3.1 - Physical characteristics of the Cape Verde inhabited islands; source: National Institute of Meteorology and Geophysics (INMG)
3.2
Santiago Island: Praia
The present case study is located in the city of Praia. Praia is placed in the southern part of Santiago, it is the largest island of the archipelago of Cape Verde, and it is sited in the Western African Coast (West Africa) - 500km from the Mainland.
According to the latest data from the National Institute of Statistics - 2010 Census, it is estimated that in the municipality of Praia reside approximately 131.719 people, 26.9% of the total national population (491.875). The county territory extends from sea level up to elevation of 435m altitude in the formation of Monte Vaca, the highest point in the county.
Has an extension of coast of about 46km, plus 1.800 meters of coastal perimeter of its single islander (Santa Maria), which is 150 meters to the South, in the central part of the Bay of Praia, in the area of Gamboa.
Isla nd Altitud e
(m)
P re cip ita tion (mm/ye a r)
Fogo 470 12% 2.829 475,4 5.900 14%
S. Antã o 785 19% 1.979 367,6 8.800 21%
Sa ntia go 1007 25% 1.394 297,5 21.500 52%
Bra va 63 2% 976 201,2 1.060 3%
S. Nicola u 347 9% 1.312 199,4 2.000 5%
Ma io 275 7% 437 139 660 2%
S. Vice nte 230 6% 750 82,79 450 1%
Sa l 221 5% 406 46,9 220 1%
Boa Vista 628 15% 387 57,06 500 1%
Source: Instituto Nacional de Metereologia e Geofísica - Delegacão da Praia
P HYSICAL CHAR ACT E R IST ICS OF T HE CAP E VE R DE INHABIT E D ISLANDS
The geomorphology of Praia is characterized by a set of hills, plateaus and valleys. The cliffs of
the plateaus receive the designation of ‘accads’ (Accad of Santo António, Accad of São Filipe, Accad Eugénio Lima, Accad Grande, Achadinha, and so on.).
Plateau is a word of French origin but it is written and spoken in Cape Verde as Platô, being
normal appearing printed as Planalto3 or Platô. City of Praia is usually called as Plateau
because it was on the base of the formation and evolution of all human settling in Cape Verde. In general urban occupation was made not only on plateaus, but also on the slopes and along the valleys that form the main streams that constitute the 5 basins.
In addition to the geographical area of 101.8 km2 located within the perimeter of the island of
Santiago (≈1.000km2), the county territory of Praia also has the area of islanders of Santa Maria
with about 6 hectares (ha).
For a long time, at least until the first decades of independence period, only Plateau (Praia) was considered City. Being relegated to the category of suburb all the remaining neighborhoods, which to some extent helps to explain the care for an adequate urban and formal occupation of the city center, with its own equipment and infrastructure, in contrast to the organic development and seemingly chaotic of the remaining neighborhoods.
Although there is currently some decentralization of services and even some trade offer in the neighborhoods (concentrated more in the Central and Southern areas), Plateau (Praia) continues to be a great attraction and daily commuting Center, along with the greatest commercial zone of the country - the market in Sucupira.
There are still a significant concentration of services and trade in the Plateau (Praia) – with
especial significance to the oldest market in the city - Market Town of Pelourinho. Peripheral areas have yet to achieve full autonomy, sufficiently capable of freeing them from the stigma of "dormitory neighborhoods" of Praia, although today they are far more populous and with largest areas of occupation that Plateau (Praia).
The county has important infrastructures (Airport and Port, both international); holds the political Capital of Cape Verde and it is where the main services are concentrated, trade and corporate headquarters and network of embassies.
3Planalto= plateau in portuguese, Cape Verde’s
4.
Population study and economic situation
Below are summarized the results of the detailed analysis of domain characterization, exhibited
at the Municipal Master Plan, but only in those areas that are crucial for the proper development
of the following phases of the study of reuse, these are:
Population Study;
Prognosis of population;
Economy.
In the municipality in question, the population of Praia had, in 2010, a population of about 131,719 inhabitants, representing 27% of the total population of Cape Verde.
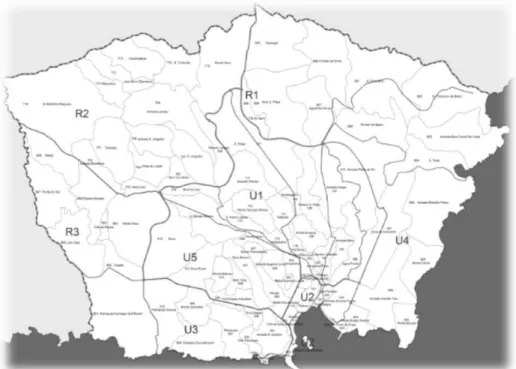
Table 4.1 - Estimated population by neighborhoods by source: INE – Census 2010
ZONE AND GROUPING
OF NEIGHBORHOODS
AREA (km
²
)
POPULATION
PRAIA NORTE (U1)
12,89
47.648
PRAIA CENTRO (U2)
1,14
5.537
PRAIA SUL (U3)
6,82
31.969
PRAIA ORIENTAL (U4)
14,09
6.612
PRAIA OCIDENTAL (U5)
9,85
36.060
PRAIA COROA/ARCO
NORDESTE (R1)
21,24
1.216
PRAIA COROA/ARCO
NOROESTE (R2)
22,17
492
PRAIA COROA/ARCO
SUDOESTE (R3)
13,26
2.185
TOTAL
NEIGHBORHOODS
101,46
131.719
TOTAL PRAIA
258,1
131.719
TOTAL CAPE VERDE
491.575
Figure 4.1 - Mapping of support and reasoning of grouping neighborhoods by source: INE
The evolution of the population of Praia since 1940 is shown below.
Figure 4.2 - Chart - Population evolution of the Municipality of Praia 1994 – 2010 by source: INE
The demographic pressure has increased, contributing to the emergence of areas of illegal constructions.
The evolution of the population of Praia from 2000-2010 has been:
Table 4.2 - Evolution of the population by source: INE
In about 10 years, from 2000 to 2010, the share of the population of Praia in the total national population increased by about 4.3%, almost the entire population decline in other counties. This demographic pressure is also facilitated because the municipality of Praia feature is predominantly urban (about 97% urban), very different from the national average.
The population is distributed spatially within municipal area of 102km2, according to the
following distribution of Urban/Rural occupation:
Table 4.3 – Population distribution by source: INE
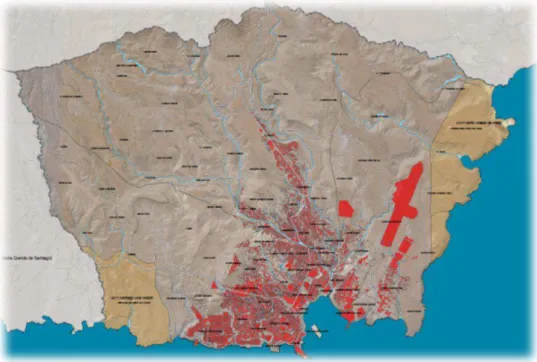
The number of urban and rural populations is inversely proportional to the area of occupancy of the respective spots, becoming realities diametrically opposed, as explained in the following figure.
2000 2010
98.118 131.719 3,00%
Evolution of the population
Population
TCMA
Urban Population (City of Praia) 127.826 97%
Rural Population 3.893 3%
Figure 4.3 - Actual scenario by source: INE
In the city of Praia, the evolution of the average household size has had a decreasing trend, from about 5 persons per household in 1900 to about 3.7 in 2010, justified by the success of family planning policies.
The population density of the city of Praia increased from 962 to 1.297 inhabitants per km2 in
the period 2000-2010. This value is of concern for the negative socio-economic consequences, including employment, transport and security.
The value of population density of Praia, is comparable to the largest cities of the world, however the density distribution is not uniform, differing according to the administrative zones.
The zone of higher housing and population density corresponds to Praia Sul (South part of
Praia), Zone U3 of the proposed administrative division, where the population density is of the
order of 1.124 housing per square kilometer (km2), corresponding to a density of about 4.100
inhabitants per km2, if we consider the average family size. Note that, within some
administrative zones, there are different distributions of population and housing densities. For
example in the U1, the average housing density is between [601-1000] dwellings per km2, but
there are neighborhoods with housing density exceeding 1.000 dwellings per km2.
At that rate of growth, the population of Praia will reach 12 years from now, approximately 195.000 inhabitants.
Table 4.4 - Projection by neighborhoods; source: INE
Based on projections made with the 2010 Census data from INE, is expected to grow at an average annual rate of 3%, which means that in 2023 the municipality of Praia will have 193 433 inhabitants, representing an increase of 61,714 persons compared to 2010, 5.142 new residents per year, equivalent to a total of 15.423 families, 1.286 families/year.
It appears that U1, U3 and U5 are the Pools Neighborhoods with the largest trend in the population, an increase of approximately 22.300, 15.000 and 17.000 new inhabitants respectively.
These values should be crossed with other indices and indicators that define the parameters of urban occupation, from which one can infer the current trend verified in order to more balanced growth in the neighborhoods and their spatial grouping of neighborhoods.
4.1 Economic situation
According to the results of the Informal Sector Survey, existed in Cape Verde in 2010, about
24.060 Units of Informal Production (UPI), with 25.6% located in Praia. Note that there is more
UPI in urban (63.6%) than in rural areas (36.4%). It was also found that 65% of UPI located on the island of Santiago.
In the City of Praia, in the most developed sector by UPI, It is worth to highlight activities of the retail trade in the food area. In the industrial sector stand out activities in manufacturing and in services sector, there is hotel and catering.
Regarding to the employment created in the informal sector, it appears that both nationally and in the city of Praia, 82% of UPI employ one person, i.e. owners themselves (self-employment), 10% employ two people and only 3% employ 3 people.
ZONE AND GROUPING OF
NEIGHBORHOODS AREA (m ²)
POPULATION
2010 PROJECTION 2023
PRAIA NORTE (U1) 12.886.072 47.648 69.973
PRAIA CENTRO (U2) 1.141.782 5.537 8.131
PRAIA SUL (U3) 6.819.382 31.969 46.947
PRAIA ORIENTAL (U4) 14.089.115 6.612 9.710
PRAIA OCIDENTAL (U5) 9.853.031 36.060 52.955
PRAIA COROA/ARCO
NORDESTE (R1) 21.243.845 1.216 1.786
PRAIA COROA/ARCO
NOROESTE (R2) 22.174.062 492 723
PRAIA COROA/ARCO
SUDOESTE (R3) 13.257.302 2.185 3.208
TOTAL 101.464.591 131.719 193.433
5.
Analysis and diagnosis of sanitation systems, purification
and regeneration
5.1 Infrastructure of supply
Below are described the existing infrastructure system of drinking water supply in Praia, since it influence the sanitation needs and wastewater treatment, both infrastructures must grow following the same strategic axes.
Access to drinking water is primarily made through residential connections, founts and cisterns. It is estimated that water consumption from the public network, covers about 56.4% of
households. Founts and trucks of water, cover the remaining 36.4% of consumption, which is a considerably weigh.
From 2000-2008 the average annual growth rate of supply through the public network was around 15%, in contrast to the downward trend of the other sources of supply.
In Praia, the growth rate of water supply to households (water coverage rate), has evolved at an annual rate of 4.8%, higher than the growth rate of the population of this city. Therefore, it could be estimated that if this rate is maintained in the next seven years, at Praia's population will be around 163.381 inhabitants, the entire population will be supplied through the public network, produced by Electra.
The average production of drinking water for the public in the city of Praia is about
260.000m3/month. The 85% comes from central production of desalinated water by reverse
osmosis from Palmarejo Grande (exploited by Electra). The rest of drinking water comes from
water wells, galleries, founts, and so on. According to Municipal Master Plan this Seawater
Desalination Plant (IDAM)has a nominal capacity of 7.400m3/day and guaranteed a water
production of 5.000m3/day.
According to the operator ELECTRA, current production capacity is 6.200m3/day, and the
expansion plan is to increase more 5.000m3/day.
The supply network consists of 140 km of pipelines. Only about 35% of families have access to piped water network.
The rest of the population is supplied through ADA, Water Distribution Agency which manages
the sales and distribution services of water trucking, founts, and so on. In 2010 ADA supplied
about 103.000m3/year of drinking water for population of the municipality.
Taking into account the total population, the scope of delivery is 66 l/inhab.day.
Given that it supplies only 56.4% of the population, resulting in allocation of supply 117
l/inhab.day.
Given network losses of 40%, the estimated supply envelope 70 l/inhab.day.
The potable water supply of the population that is supplied with ADA (36.4%) was of
103.000m3/year in 2010, resulting in a supply allocation of 6 l/inhab.day, instead of the
70 l/inhab.day provided by public network.
5.1.1 Synthesis of the problem
The system of drinking water supply is faulty. It is noted the following:
Production capacity of drinking water for the public supply network is insufficient to meet
current demands and logically future ones.
The supply network does not cover the entire territory, which must be supplied by
tanker or local wells and founts.
The supply network is undersized, in poor condition and a projected percentage of
significant losses in some cases 50%.
There is a huge imbalance of the availability of water between the populations. It is
found that water consumption of the population connected to the public network is more than 10 times higher than the one supplied by cisterns. Still, drinking water consumption of public network are considered low, estimated at 70 l/inhab.day of water consumed from public network and 6 l/inhab.day of water consumed from cisterns.
High cost of drinking water, from 2.5 €/m3
for domestic use up to 5.3 €/m3 for tourism.
5.2 Sanitation infrastructures
Figure 5.1 – Wastewater evacuation sources
A major factor that limits the connection of households to the sewer system in the city of Praia is the cost of the connection between houses and the sewer system which is estimated at about
30.000 CVE per housing. The low income of the population, especially in spontaneous
neighborhoods currently occupying about 35% of the residential area of the city, makes about 80% of homes in Praia not linked to network of wastewater collection.
Also it should be noted the absence of legislation or ordinance regulating sanitation and requiring the mentioned connection.
On the other hand, there is no release fee that allows financial support for the operation of the sanitation system.
The sanitation system is characterized by:
Lack of sewerage network in many neighborhoods/areas in the city. Are only estimated
about 45km of pipes (primary and connections) and two wastewater pumping stations (WWPS).
Low percentage of population with sewage, by the high costs of connection and absent
regulations on the matter.
The network is not separative type so that in times of heavy rains flooding episodes
occur in the sewage system and the Wastewater Treatment Plant (WWTP).
Evacuation of wastewater
Septic tank
Drainage networks
Arnd. The house
Nature
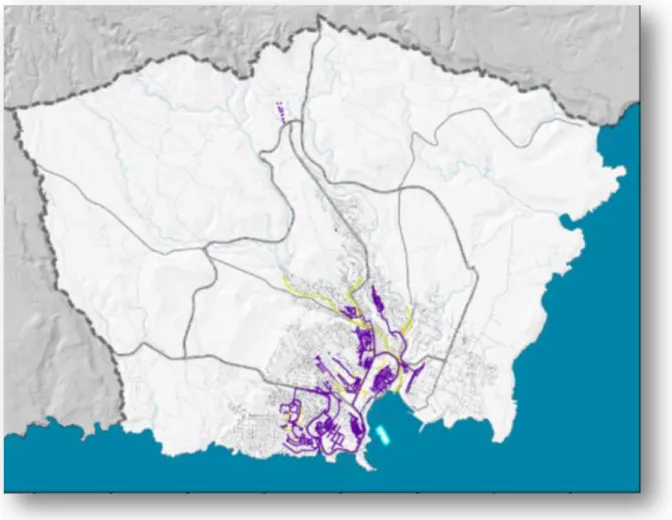
Figure 5.2 - Sewerage (magenta) and rainwater drainage (yellow) by source: Aqualogy Aqua Ambiente, 2012
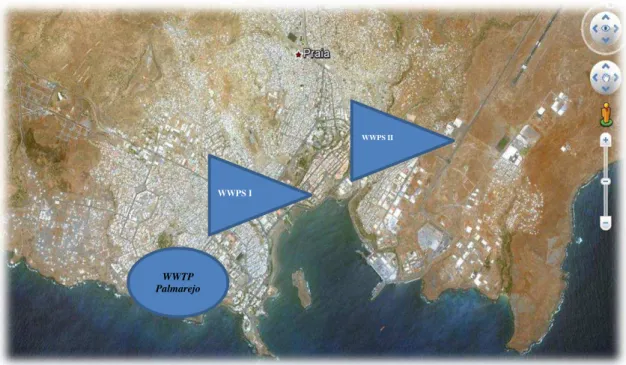
Figure 5.3 – Location of WWTP in Palmarejo and wastewater pumping stations (WWPS); source: Aqualogy Aqua Ambiente
The power cuts are frequent and since the wastewater pumping stations sets are not operational due to frequent thefts, occurs discharges into watercourses. These episodes are frequent.
Pumping wells are accessible from the outside.
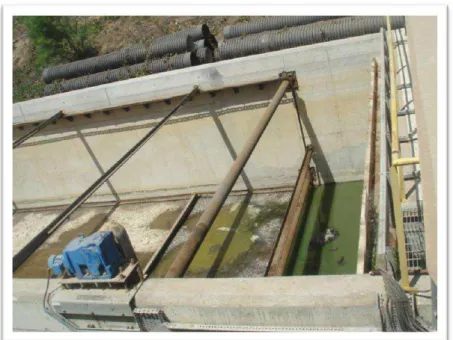
Figure 5.4 - Pumping stations “in situ”; source: Aqualogy Aqua Ambiente
WWTP Palmarejo
WWPS I
The deficient sanitation and uncontrolled discharges of untreated wastewater to the environment cause a negative impact to the environment, and in particular a progressive degradation of the quality of groundwater and surface water, and health risks of the population.
5.2.1 Synthesis of the problem
The main problems of the sewerage network are:
Lack of sewerage network in many neighborhoods/areas in the city.
Low percentage of population with sewage, by the high costs of connection and
absence of regulations on the matter.
The existing network is not dimensioned for future connections neighborhoods / areas
in the city.
Poor sewage conditions, leaks.
Lack of facilities maintenance and instrumentation, automation and control.
Faulty design of the network (flooding in heavy rain situation, non separative network).
5.3 Wastewater treatment plant
5.3.1 Overview
Located in the area of Palmarejo, WWTP had the first line built in 1997, consisting of a primary treatment, and was upgraded in 2007.
The nominal capacity of the
plant is 8.000m3/day and
14.000m3/day at its peak,
therefore the flow rate is
333m3/h and the flow tip of
583m3/h.
The treated water is discharged to the nearby beach, while there is an outfall 350m long in disuse.
The WWTP counts with five shifts workers for 24 hours and a floor manager.
Figure 5.6 - WWTP Implementation Plan by source: Aqualogy Aqua Ambiente
The current treatment line is:
Water Line
o Pumping head, 2 +1R pumps nominal flow rate of 94-164 l/s;
o Electromagnetic flow measurement DN 300;
o Pretreatment, two channels and one other bypass:
Thick thinning with 2 manuals bars;
Fine thinning with 2 automatic cleaning bars automatic;
Grit/degreasing in two aerated channels by a blower with sands extraction
using air lift pumps;
o Primary treatment, 2 rectangular decanters and superficial bottom sweep;
o Activated sludge biological treatment with extended aeration type nitrification
and denitrification;
o Secondary decantation aerated lamellar (2pcs);
o UV Disinfection by chlorination channel adding hypochlorite.
Sludge line
o Gravity sludge thickener with bridge;
o Pumping of thickened sludge by 1 +1 R screw pumps;
o Anaerobic digestion with heating using recirculated sludge;
o Drive to dehydration by screw pumps;
o Conditioning by polyelectrolyte;
o Mechanical dewatering by belt filter;
o Worm drive and dewatered sludge storage;
Gas line
o Biogas storage;
o Burning torch;
o Fuel tank;
5.3.2 Diagnosis of the facilities and its operation
The existing problems are as follows:
Given the tenuous connection of the population to the sewerage only reaches the
treatment plant a rate of 1000 -1500 m3/day, instead of 8000 - 14000 m3/day design.
The connected population is estimated at 26.343hab 2.010 (20% of total), so the
residual water supply per capita is about 57 l/inhab.day.
It is estimated that soon the plant input flow will be about 2.500m3/day, due to the
implementation of improvements to the sewer system.
General state of poor care and lack of maintenance.
The pretreatment is in bad shape and it does not observes sand extraction or grease of
Figure 5.7 - Disused Sand Storage by source: Aqualogy Aqua Ambiente
One of two primary decanters out of service and in poor condition:
Figure 5.9 - State of preservation of Disused Primary Decanter by source: Aqualogy Aqua Ambiente
The primary settler in service has floating fat accumulation on the surface.
Figure 5.10 - Water outflow of the primary decanter by source: Aqualogy Aqua Ambiente
The preservation of the lamellae of the secondary decanters is poor, being some of them misplaced. There is also a layer of algae and floating sludge:
Figure 5.11 - Secondary Decanter by source: Aqualogy Aqua Ambiente
The sludge line is out of service due to a leak in the digester.
Dehydration was never launched.
Figure 5.12 - Band Filters by source: Aqualogy Aqua Ambiente
Emerging pathologies in concrete and general poor condition of civil engineering and urbanization.
Figure 5.13 - Pathologies in concrete by source: Aqualogy Aqua Ambiente
The instrumentation and control system is faulty and is not in operation, so that the operation of the plant is manual.
Operating parameters are not optimized (aeration, sludge age, energy consumption, reagent dosing ...).
Lack of operating rooms, workshop and storage conditions:
No analytical tests of the process are performed, although there is a plant laboratory well equipped.
Figure 5.15 - WWTP Laboratory by source: Aqualogy Aqua Ambiente
5.3.3 Problem summary
The main issues presented by the current WWTP are synthesized in consideration to the following contexts:
Influent type:
Possible seasonality in flow and pollutant load, due to tourism.
Possible discontinuous contribution of septic tank emptying and overall impact on the
influent.
Type of contributions from septic tanks, with high contents of suspended and dissolved
solids, sand, grease and organic nitrogen and ammonia.
Current facilities:
The WWTP is not sized to the population increase and the expected network
connection, both in the context of flow and pollutant loads and the quality of the effluent to obtain.
The state of existing facilities cannot meet the nutrient removal requirements.
General deterioration of facilities and equipment, electromechanical, instrumentation,
automation, remote and wiring.
Need to renew its operating equipment due to condition or to adapt to the new plant configuration.
Existence of completely obsolete equipment such as sludge line.
Unknown status of buried pipes and of the sludge line, which can present serious
congestion issues.