Soldagem & Inspeção.2017;22(4):401-412
http://dx.doi.org/10.1590/0104-9224/SI2204.11
Technical Papers
This is an Open Access article distributed under the terms of the Creative Commons Attribution Non-Commercial License which permits unrestricted non-commercial use, distribution, and reproduction in any medium provided the original work is properly cited.
Received: 09 Nov., 2017 Accepted: 24 Jan., 2018
E-mail: [email protected] (MTA)
Abstract: Underwater wet flux cored arc welding – FCAW – is an important process employed to repair marine structures with the advantages of not handling the components off the water and offers higher productivity in comparison to other conventional welding process. Under the water, wet welding activities are performed with lower stability, due to the pressure of the water surrounding the arc column and the presence of water in the gap between the contact tip and the electrode, which promotes poor electrical contact. In the present work, to compare the process stability of underwater wet FCAW with self-shielded electrode, welds were carried out using a special torch, which keeps the contact tip dry under the water. A two-level factorial design was used for experimentation and an Analysis of Variance was conducted to validate the results. Current coefficient of variation was used as the stability index. Welds performed with the torch have shown better-shaped beads and more stable arc in comparison to beads deposited with no mechanical barrier between water and the contact tip.
Key-words: Underwater FCAW; Welding torch; Arc stability. 1. Introduction
Underwater welding is the most commonly used process to repair offshore structures built to support undersea resources exploitation. Due to collision between ships and platforms and age-related phenomena, such as fatigue cracks and corrosion in structural components, and when it is not possible or viable to place the metal structure or components into dry docs, welding operations are performed in water environment [1]. Underwater SMAW is the most used method of joining metal under water, due to cost effectiveness and versatility. Simplicity of the process makes it possible to perform the welds even in geometrically complex structures [2-4]. It is very well known that the use of tubular electrodes (FCAW) offers higher productivity, however for underwater welding, handling shielding gas in offshore application is a matter always addressed. Thus, using a self-shielding tubular wire in underwater application lead to gains of time and reduce costs [5].
In underwater FCAW with self-shielding tubular wire, the welding arc is surrounded by water instead of air. The water environment compresses the arc column on weld pool. The welding arc changes along with the changing bubbles, resulting in fluctuations of current and voltage signals [6]. It has been reported that the presence of water on the electric parts can also reduce stability of the process. As the wire passes through the contact tip, water fills the gap between these two components and interferes negatively on electric current transfer. Andrade et al. [7] studied the occurrence of micro-fusions between the tubular wire and the contact tip as a cause of the poor stability and suggested addressing this problem by changing the contact tip material and using a high-pressure airflow to expel the water from the nozzle hole.
The objective of this paper is to perform an analysis of arc stability indexes calculated from data registered from electrical signals on welds performed using a special torch developed for underwater wet welding and on welds performed as in conventional underwater wet FCAW.
Evaluation of the Effect of the Water in the Contact Tip on Arc Stability and
Weld Bead Geometry in Underwater Wet FCAW
Marcelo Teodoro Assunção1, Alexandre Queiroz Bracarense1
2. Materials and Methods 2.1. Welding torch
In order to reduce the problems related to the presence of water in the gap between the tubular wire and the contact tip hole during welding, a torch for underwater wet FCAW was developed at Laboratório de Robótica, Soldagem e Simulação – LRSS – UFMG. The device is equipped with a sealing system that prevents water from entering the contact tip surroundings, as the wire passes through it. With this solution, a fraction of the wire in the Contact Tip to Work Distance (CTWD) is kept dry inside the torch while part remains on the water environment. It is interesting because with this solution it is possible to weld in two configurations using the torch, as in conventional underwater FCAW and keeping the electric parts isolated from water. By using a self-shielding tubular wire, it is not necessary to employ shielding gas, which makes the process even more cost effective. Pictures of the welding torch are shown in Figure 1 with and without the sealing system.
Figure 1. Welding torch for underwater FCAW. (a) With the sealing system that prevents water from entering the contact tip surroundings and (b), with no sealing system assembled.
2.2. Experimental procedure
Welding experiments were carried out in a water tank at 400mm of water depth. The welding torch was fixed on a one-axis mechanized horizontal system perpendicular to the working piece. This setting allowed control of torch position, welding speed and CTWD, and resulted in a linear weld bead profile. Bead-on-plate welds were deposited on A36 steel plates with dimensions of 100 mm × 220 mm × 19 mm using a 1.6 mm diameter commercial rutile self-shielding tubular wire (ASME SFA 5.20 E71T-11) on electrode negative (DCEN). Welding current was measured by a Hall effect sensor. Welding voltage channel was connected to the working piece and the welding torch. Welding voltage, current and wire speed were monitored simultaneously at a frequency of 5 kHz by a data acquisition system. The experimental setup is illustrated in Figure 2.
Soldagem & Inspeção.2017;22(4):401-412 403/412403
Evaluation of the Effect of the Water in the Contact Tip on Arc Stability and Weld Bead Geometry in Underwater
Wet FCAW
2.3. Identification of factors and responses
For the purpose of evaluating the effect of welding parameters on arc stability indexes, a two-level factorial design was carried out. In a factorial design, in each complete trial or replication of the experiment, all possible combinations of the levels of the factors are investigated [8]. The factors studied were “welding condition”, CTWD, voltage and wire speed. The first factor, welding condition, is qualitative, the two levels are the contact tip wet, as in conventional underwater FCAW, and the contact tip dry (inside the torch). The factors CTWD, voltage and wire speed are quantitative and their respective levels were fixed after literature review and by conducting trial runs. In Table 1 are presented the input variables with their respective levels and in Table 2 the experimental matrix for the 24 = (16) factorial design. Welds were deposited randomly according to the levels of parameters in the design
matrix. For all runs, welding travel speed was set to 450 mm/min and the torch was positioned perpendicular to the working piece.
Table 1. Factors levels for welding experiment.
Factor Name Units Low Level (-) High Level (+)
A Condition - Contact Tip Dry Contact Tip Wet
B CTWD mm 15 20
C Voltage V 26 30
D Wire Speed m/min 4 5
After welding, the current coefficient of variation was the stability index analyzed from the design matrix, because a constant voltage welding source was used. The responses were calculated between the tenth and the twenty-fifth seconds of welding, for all runs. The effect of each factor is defined to be the change in response produced by a change in the level of the factor. It can be calculated by averaging the highs and the lows to determine the difference or contrast [8,9]. The effect of each factor, as well as interaction effects, were calculated from the factorial design according to Equation 1.
Y Y
Effect
n n
+ −
+ −
∑ ∑
= − (1)
Where the ‘Y’s refer to the responses at high (+) and low (-) levels, and the ‘n’s refer to the number of data points collected at each level. With the view to validate the results, an Analysis of Variance was performed.
Table 2. Matrix experimentation.
Contact Tip Dry Contact Tip in Water
Run CTWD [mm] Voltage [V] Wire Speed
[m/min] Run CTWD [mm] Voltage [V]
Wire Speed [m/min]
1 15 26 4 1 15 26 4
2 15 26 5 2 15 26 5
3 15 30 4 3 15 30 4
4 15 30 5 4 15 30 5
5 20 26 4 5 20 26 4
6 20 26 5 6 20 26 5
7 20 30 4 7 20 30 4
3. Results and Discussion 3.1. Weld beads produced
The surfaces appearance of the weld beads produced in the two welding conditions are shown in Figure 3. Qualitatively speaking it is possible to note that weld beads carried out with the contact tip isolated from water (dry) show more regular shape than beads produced with the contact tip in water. On the other side, the presence of water in the gap between the tubular wire and the contact tip promotes worse current transfer, resulting in unstable arc and, thus, a worse shaped weld bead.
3.2. Average values of welding voltage and current
The average values of welding voltage and current, as well as their respective standard deviation values and the current coefficient of variation, are shown in Table 3. It is noted that, although a constant voltage welding power source was used, the voltage standard deviation increases as the levels of the parameters increases when welding was carried out with the contact tip in water environment. The same behavior can be noted for the current standard deviation. When welding is performed keeping the contact tip dry, both voltage and current standard deviation keep close to the same value as the parameters levels increase.
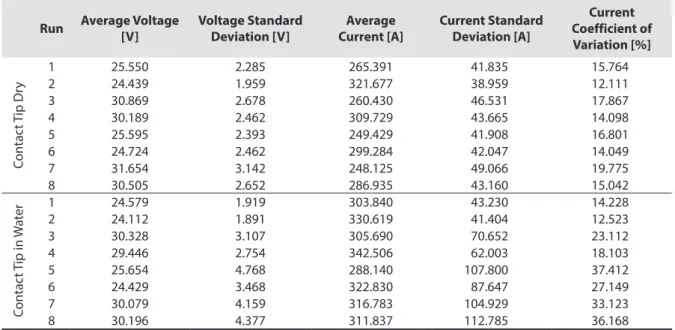
Table 3. Average values of welding voltage and current.
Run Average Voltage [V]
Voltage Standard Deviation [V]
Average Current [A]
Current Standard Deviation [A]
Current Coefficient of Variation [%]
C
on
tac
t T
ip
Dr
y
1 25.550 2.285 265.391 41.835 15.764
2 24.439 1.959 321.677 38.959 12.111
3 30.869 2.678 260.430 46.531 17.867
4 30.189 2.462 309.729 43.665 14.098
5 25.595 2.393 249.429 41.908 16.801
6 24.724 2.462 299.284 42.047 14.049
7 31.654 3.142 248.125 49.066 19.775
8 30.505 2.652 286.935 43.160 15.042
C
on
tac
t T
ip
in
W
a
ter
1 24.579 1.919 303.840 43.230 14.228
2 24.112 1.891 330.619 41.404 12.523
3 30.328 3.107 305.690 70.652 23.112
4 29.446 2.754 342.506 62.003 18.103
5 25.654 4.768 288.140 107.800 37.412
6 24.429 3.468 322.830 87.647 27.149
7 30.079 4.159 316.783 104.929 33.123
8 30.196 4.377 311.837 112.785 36.168
Soldagem & Inspeção.2017;22(4):401-412 405/412405
Evaluation of the Effect of the Water in the Contact Tip on Arc Stability and Weld Bead Geometry in Underwater
Wet FCAW
Comparing the runs in which the factor A (Welding Condition) is on the high level (+) (Contact tip in water) against the runs in which the factor A is on the low level (-) (Contact tip isolated from water) is observed an average reduction of up to 13.2% on the average current value when the electric parts are dry inside the torch. This reduction of current can be associated with changes on electrode temperature. As the tubular wire passes through the contact tip and follows to the working piece, it is heated by Joule Effect. When the electrical parts are immersed in water, all the contact tip and electrode external area are cooled by convection by the movement of the surrounding water. So, higher current values are necessary to melt the electrode and form the welding pool. However, when welding is performed using the torch sealing components, only a small area of the wire is cooled by the water and it reaches the welding pool in a higher temperature, so, a lower current is necessary to melt the electrode and the working piece.
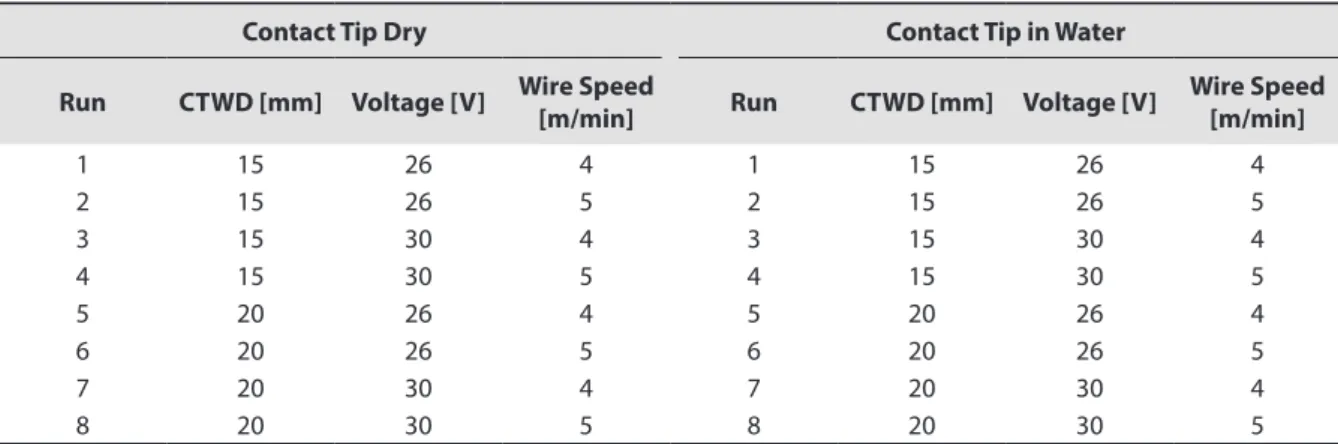
Current coefficient of variation is a stability index defined as the ratio between current standard deviation and average current value [10]. The welding current coefficients of variation are plotted in Figure 4. The graphic was plotted according to the welding runs listed in Table 3. The runs in which the contact tip was kept dry were plotted against their respective runs with the contact tip in water, keeping the levels for the remaining factors.
An increase in the level of the factors causes higher energy to be transferred through the tubular wire. This energy is transferred to the tubular electrode through a sliding electrical contact. The presence of water between the sliding surfaces promotes worse current transfer by reducing the contact area between the contact tip and the wire. Keeping the electrical contact wet when increasing the amount of energy to be transferred promotes even worse current transfer. This effect can be observed in Figure 4 by comparing the black and the red lines. The difference in the angle of inclination of the straight lines, which are tendency lines to each condition, shows how the welding current coefficient of variation remains steady when the contact tip is dry. It is noted that as the factors levels increase, from run 1 to 8, the welding arc becomes more unstable when the contact tip is wet. However, when the electric contact is kept dry, the current coefficient of variation shows a much smaller fluctuation. The smaller the sample range is (Coefficient of Variation), the smaller the fluctuation is, which means the welding arc is more stable [11]. This behavior lends support to the conclusion that the welding stability is improved by keeping the sliding electrical contact isolated from water.
Figure 4. Welding current coefficient of variation.
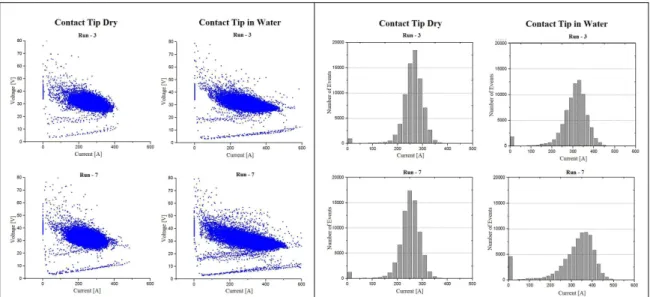
3.3. Cyclograms and histograms – graphic analysis of welding arc stability
The welding arc stability can be associated with the power graphics (cyclograms). A cyclogram shows welding voltage as function of the welding current intensity. These graphics are easy understanding when welding stability is concerned. The smaller the area, the more stable the welding process [12,13]. In Figure 5 (a) is shown the cyclograms for runs 3 and 7 for both high and low levels of factor A - Condition. It is noted that when welding is carried out keeping the contact tip dry, the process is conducted with a more stable arc. This phenomenon can be justified due to the fact that there is no water in the sliding electrical contact, so the current transfer occurs more steadily and fewer arc interruptions occur. It is also notable a smaller number of short circuits (lower line created by dots, showing drops on voltage and peaks on current).
Figure 5. (a) Welding current × voltage graphs; (b) Welding current cyclograms.
For the purpose of describing and improving accuracy on analysis of arc stability, arc voltage deviation and current deviation histograms were plotted. These diagrams shows the signals deviation over the entire acquisition period. The width and height of these diagrams are reliable indicators or arc stability. A welding process exhibiting a tall and narrow peak shows a more stable arc [14].
Figure 5 (b) shows the current histograms for runs 3 and 7 for both high and low levels of factor A - Condition. It can be stated that the runs carried out with the contact tip in water presents shorter and larger peak, leading to conclusion that the welding arc was far more unstable than the runs showed on the left side (contact tip dry). This analysis lend support to the conclusion that welds carried out keeping water away from the nozzle have more stable welding arc.
When an interruption on welding arc occurs, the welding current value lows to zero and the voltage value reaches the open circuit voltage of the power source. It can also be noted in Figure 5 (b) that welds performed with the contact tip in water show high amount of points with current value equals to zero. This behavior labels the process as unstable, once that the welding arc was interrupted for higher periods.
3.4. Main effects and interaction effects
The main effects, interaction effects and experimental results are shown in Table 4. The Y1 column is the current coefficient of variation.
Soldag
em & Inspeç
ão
.2017;22(4):
401-412
407
407/412
Ev
alua
tion of the E
ffect of the W
ater in the Con
tact Tip on Ar
c St
ability and W
eld Bead Geome
tr
y in Un
der
w
ater
W
e
t F
CA
W
Table 4. Design matrix and experimental results.
Run
Main Effects Interaction Effects
V mean I mean Y1: C.V.
Current
A B C D AB AC AD BC BD CD ABC ABD ACD BCD ABCD
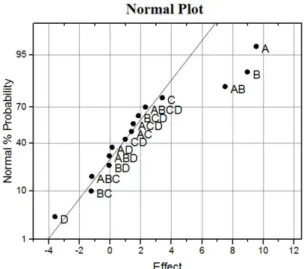
Figure 6. Normal probability plot of effects for current coefficient of variation.
variation. The three effects that fall out of the line are most significant on the response, so, the factors condition, CTWD and their interaction are considered to affect current coefficient of variation.
The effects of factors A and B are shown in Figure 7 (a) and (b). Both increase the response in 9.539% and 8.964%, respectively, by changing to their higher levels. Considering only the main effects, factors A and B should be set to their lower levels to minimize the response. However, it is necessary to analyze the important interactions. When factors are involved in significant interactions, special attention must be given to analyze them [8]. The AB interaction is shown in Figure 7 (c). It is noted that, when the contact tip is kept dry, a little change occur in the response by increasing the CTWD from 15 to 20 mm. However, the welding arc becomes more unstable as the distance from contact tip to working piece increases when the contact tip is in water environment. This can be justified by the fact that an increase in contact tip to plate distance increases the circuit resistance, which reduces welding current. The presence of water in the gap between the contact tip hole and the wire promotes worse electric contact as the electrode passes through. Poor electric contact increases the frequency of micro fusions between wire and contact tip, resulting in larger variations on current signal [7].
Figure 7. (a) Effect of factor A; (b) Effect of factor B; (c) Interaction AB.
3.5. Analysis of variance – ANOVA
Soldagem & Inspeção.2017;22(4):401-412 409/412409
Evaluation of the Effect of the Water in the Contact Tip on Arc Stability and Weld Bead Geometry in Underwater
Wet FCAW
compared to the reference distribution for F with the same degrees of freedom. It was noted that the probability of getting an F as high as the observed, due to chance alone, is less than 0.1%. Therefore, it can be stated with more than 99.9% of confidence that factors A, B and AB are the main effects on Current Coefficient of Variation.
Figure 8. Normal plot of residuals.
Table 5. Analysis of variance for current coefficient of variation response.
Analysis of Variance - ANOVA
Source Sum of Squares Degrees of Freedom Mean Square Fo P-value
Model 910.85 3 303.62 21.94 <0.001
A 363.98 1 363.98 26.30 <0.001
B 321.43 1 321.43 23.23 <0.001
AB 225.45 1 225.45 16.29 <0.001
Residual 166.07 12 13.84
Cor Total 1076.920648 15
3.6. Diagnosing residuals
In order to validate statistical assumptions made to this point, a mathematical equation was used to predict the response for the model tested in the ANOVA. The model with coded factors is shown in Equation 2.
. . * . * . *
Y =20 458+4 77 A 4 48 B+ +3 75 AB (2)
Where A, B and AB represents the factor level (+ or -) input values, according to Table 2.
3.7. Macrographic analysis
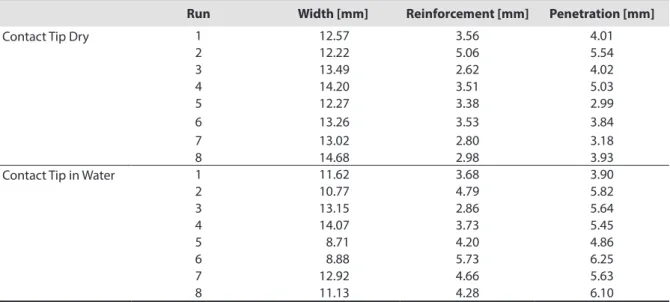
Two macrographs were prepared for each of the sixteen operational conditions evaluated. The macrographic preparation was carried out on two transverse test pieces from the same bead and mounted in thermo-fixing resin (bakelite), sanded with granulometry of 80, 150, 240, 320, 400 and 600 and then attacked with Nital 10. The geometric parameters of the weld beads (width, reinforcement and maximum penetration) were measured using the free software ImageJ. The mean values of the two samples of each bead are listed in Table 6.
Figure 9. Macrographs of beads obtained.
Table 6. Geometric parameters of weld beads produced.
Run Width [mm] Reinforcement [mm] Penetration [mm]
Contact Tip Dry 1 12.57 3.56 4.01
2 12.22 5.06 5.54
3 13.49 2.62 4.02
4 14.20 3.51 5.03
5 12.27 3.38 2.99
6 13.26 3.53 3.84
7 13.02 2.80 3.18
8 14.68 2.98 3.93
Contact Tip in Water 1 11.62 3.68 3.90
2 10.77 4.79 5.82
3 13.15 2.86 5.64
4 14.07 3.73 5.45
5 8.71 4.20 4.86
6 8.88 5.73 6.25
7 12.92 4.66 5.63
8 11.13 4.28 6.10
When welding was carried out keeping the contact tip dry, the bead width increased as the parameters Voltage, CTWD and Wire Speed increased, according to values listed on literature to FCAW performed in open air [15-18].
Soldagem & Inspeção.2017;22(4):401-412 411/412411
Evaluation of the Effect of the Water in the Contact Tip on Arc Stability and Weld Bead Geometry in Underwater
Wet FCAW
4. Conclusions
Weld beads obtained using the torch developed at LRSS-UFMG showed better shape in comparison to welds produced with the contact tip in water environment. The current transfer to the tubular wire occurs more steadily when the electric parts are kept dry, as in air welding. Higher values of welding current were measured in welds carried out with the contact tip in water, due to the cooling effect of the water, higher current was necessary to heat the wire and melt it in the welding arc.
When the contact tip is kept dry, a little change occur on Current Coefficient of Variation by increasing CTWD, voltage and wire speed to their higher levels. However, the welding arc becomes more unstable as the parameters levels increase when the contact tip is in water environment. It was also noted that smaller amount of short circuit points and fewer arc interruptions occurred when weld was carried out keeping the contact tip dry.
Among the factors selected for the factorial design, welding Condition, CTWD and their interaction are the most influent on current coefficient of variation. Keeping the contact tip dry inside the torch promotes a more stable arc in comparison with welds carried out with the contact tip in water environment. The other factors vary only due to normal causes, and are much less influent on the evaluated response.
The ratio width/penetration showed larger variation as the factors levels increased when welding was performed as in conventional underwater wet FCAW, welding with the torch developed for this experiment promoted more regular weld beads even increasing the parameters.
The results showed highlight the gain on stability of the underwater wet FCAW process when welding is carried out keeping the electric sliding contact isolated from water.
Acknowledgements
The authors would like to acknowledge Capes and PPGMEC from Federal University of Minas Gerais for financial support and Laboratório de Robótica, Soldagem e Simulação – LRSS – for all the facilities.
References
[1] Verma K, Garg HK. Underwater welding-Recent trends and future scope. International Journal on Emerging Technologies. 2012;3(2):115-120.
[2] Łabanowski J, Fydrych D, Rogalski G. Underwater welding – a review. Advances in Materials Sciences. 2008;8(3):11-22. [3] Nixon JH, Graham SRB. Arc instability in shallow water wet
welding. In: Proceedings of The International Conference on Offshore Mechanics and Arctic Engineering; 1993 June 20-24; Glasgow. New York: ASME; 1993. p. 129-129.
[4] Shi Y, Zheng Z, Huang J. Study on arc stability of underwater wet flux-cored arc welding. Proceedings of The 10th International Conference on Frontiers of Design and Manufacturing; 2012 June 10-12; Chongqing. China: NSFC; 2012. p. 231-235. [5] Vilarinho LO, Lucas B, Raghunathan S. Initial trials of underwater
wet welding using mechanised FCAW process. Proceedings of The 20th International Congress of Mechanical Engineering; 2009 November 15-20; Gramado. Rio de Janeiro: COBEM; 2009. p. 1-10.
[6] Chuanbao JIA, Zhang T, Maksimov SY, Yuan X. Spectroscopic analysis of the arc plasma of underwater wet flux-cored arc welding. Journal of Materials Processing Technology. 2013;213(8):1370-1377. http://dx.doi.org/10.1016/j. jmatprotec.2013.02.013.
[7] Andrade LPCS, Dutra JC, Santos VR, Teixeira JC. Soldagem subaquática molhada com eletrodo tubular. In: Anais do XII
Congresso Brasileiro de Engenharia Mecânica; 1993 December 07-10; Brasília. Brasília: COBEM; 1993. p. 1667-1670. [8] Montgomery DC. Design and analysis of experiments. 7th ed.
2008. Arizona: John Willey & Sons.
[9] Anderson MJ, Whitcomb PJ. DOE simplified: practical tools for effective experimentation. 2nd ed. 2007. Boca Raton: CRC Press.
[10] Scotti A, Ponomarev V. Soldagem MIG/MAG: melhor entendimento, melhor desempenho. São Paulo: Artliber; 2008.
[11] Shi Y, Zheng Z, Huang J. Study on arc stability of underwater wet flux-cored arc welding. Proceedings of The 10th International Conference on Frontiers of Design and Manufacturing; 2012 June 10-12; Chongqing. China: NSFC; 2012. p. 231-235. [12] Suban M, Tušek J. Methods for the determination of arc stability.
Journal of Materials Processing Technology. 2003;143:430-437.
[13] Pessoa EP, Ribeiro LF, Bracarense AQ, Dias WC, Andrade LGD, Liu S, et al. Arc stability indexes evaluation on underwater wet welding. Preceedings of The 29th International Conference on Ocean, Offshore and Arctic Engineering; 2010 June 6-11; Shanghai. New York: ASME; 2010. p. 195-201.
[15] Ghazvinloo HR, Raouf AH. Effect of Gas-Shielded flux cored arc welding parameters on weld width and tensile properties of weld metal in a low carbon steel. Journal of Applied Science. 2010;10(8):658-663. http://dx.doi.org/10.3923/jas.2010.658.663. [16] Kannan T, Murugan N. Effect of flux cored arc welding process parameters on duplex stainless steel clad quality. Journal of Materials Processing Technology. 2006;176(1):230-239. http:// dx.doi.org/10.1016/j.jmatprotec.2006.03.157.
[17] Mostafa NB, Khajavi MN. Optimization of welding parameters for weld penetration in FCAW. Journal of Achievements in Materials and Manufacturing Engineering. 2006;16(2):132-138.