Electrochemical studies on small electron transfer proteins using
membrane electrodes
M.M. Correia dos Santos
a,*
, P.M. Paes de Sousa
a, M.L. Simo˜es Gonc¸al
v
es
a,
L. Krippahl
b, J.J.G. Moura
b, E
´ . Lojou
c, P. Bianco
ca
Centro de Quı´mica Estrutural, Instituto Superior Te´cnico, Av. Rovisco Pais 1, 1049-001 Lisbon, Portugal
bDepartamento de Quı´mica, REQUIMTE, Centro de Quı´mica Fina e Biotecnologia, Faculdade de Cieˆncias e Tecnologia, Uni
versidade Nova de Lisboa,
2825-114 Monte da Caparica, Portugal
cUnite´ de Bioe´nerge´tique et Inge´nierie des Prote´ines, CNRS, 31 Chemin Joseph Aiguier, F-13402 Marseille Cedex 20, France
Received 4 July 2002; received in revised form 6 November 2002; accepted 18 November 2002
Abstract
Membrane electrodes (ME) were constructed using gold, glassy carbon and pyrolytic graphite supports and a dialysis membrane, and used to study the electrochemical behavior of small size electron transfer proteins: monohemic cytochrome c522 from
Pseudomonas nautica and cytochromec533as well as rubredoxin fromDesulfovibriovulgaris. Different electrochemical techniques
were used including cyclicvoltammetry (CV), square wavevoltammetry (SW) and differential pulsevoltammetry (DP). A direct electrochemical response was obtained in all cases except with rubredoxin where a facilitator was added to the protein solution entrapped between the membrane and the electrode surface. Formal potentials and heterogeneous charge transfer rate constants were determined from thevoltammetric data. The influence of the ionic strength and the pH of the medium on the electrochemical response at the ME were analyzed. The benefits from the use of the ME in protein electrochemistry and its role in modulating the redox behavior are analyzed. A critical comparison is presented with data obtained at non-MEs. Finally, the interactions that must be established between the proteins and the electrode surfaces are discussed, thereby modeling molecular interactions that occur in biological systems.
# 2002 Elsevier Science B.V. All rights reserved.
Keywords: Membrane electrodes; Cytochromesc552andc553; Rubredoxin; Unmediated electrochemistry
1. Introduction
It is now well recognized that electrochemical techni-ques are powerful tools for characterizing electron-transfer properties of proteins and catalysis by enzymes. Since the pioneer work of Yeh and Kuwana [1] that reported the direct electrochemistry of cytochromec at an oxide electrode, and that of Eddowes and Hill [2], which found that essentially reversible voltammetry of the same protein could be observed at a 4,4?-dipyridyl
modified gold electrode, significant advances have been made in unmediated electrochemistry of redox proteins.
The direct electrochemistry of redox proteins can be modulated by several factors and over the years much has been written about all the aspects that can lead to and/or influence the charge transfer [3/6]. Special
attention has been focused on the nature of the electrode and electrodejsolution interface, adsorption phenom-ena of the proteins at the electrode surfaces and the role of hydrogen-bonding capabilities as well as electrostatic interactions between the protein molecules and the electrode surface. Consequently, a wide range of work-ing electrodes and strategies has been applied to the study of direct electrode processes.
Metal electrodes, like gold, have been consideredvery poor as interfaces for direct electron transfer unless a suitable compound modifies, them allowing favorable and reversible binding of the redox protein. The use of a facilitator further prevents an irreversible adsorption of
* Corresponding author. Tel.: /351-21-841-9272; fax: /
351-21-846-4455.
E-mail address: [email protected] (M.M. Correia dos Santos).
www.elsevier.com/locate/jelechem
0022-0728/02/$ - see front matter#2002 Elsevier Science B.V. All rights reserved.
the protein at the electrode surface that can cause denaturation processes. It has been claimed that bare electrodes are more prone to be affected by the presence of impurities, as well as by the previous treatment of the electrode surface. The presence of a modifier can be a way to circumvent the lack of reproducibility in the voltammetric behavior [3,7,8]. So, modified surfaces have been engineered by the use of suitable facilitators. These should contain a surface active group which will bind/adsorb to the electrode surface, as well as groups
that may interact with some part of the protein and in this way encourage electron transfer to occur [9,10]. Compounds containing nitrogen, sulfur and phosphor-ous atoms, which may interact with the electrode surface, have been used. Groups that can bind to the protein must be oriented towards the solution and are chosen so that a negative or positive charge is present: the former ‘attracts’ positively charged proteins and the latter negatively charged proteins. As an example,very poor, or an absence of responses have been found forc -type cytochromes at gold electrodes unless in the presence of a suitable modifier. This had been reported in the work of Eddowes and Hill for cytochrome c
reduction and many other examples soon followed, for instance, that of the reduction ofDesulfovibriovulgaris cytochrome c553 at a gold electrode where no electro-chemical response was obtained unless in the presence of 4,4?-bipyridine[11].
Carbon electrodes possess a highly functionalized surface and a net negative charge for pH/5.6 [12]. In
this case, well-behaved electrochemistry of redox pro-teins with the appropriate positive charge has been observed in the absence of an added modifier[13]. The organic-like functionalities on the electrode surface seem to provide a friendly environment for protein interaction with the electrochemical surface. These surfaces can act as spontaneously modified electrodes depending on the degree of functionalities, on the pH and the previous treatment of the carbon used. For instance, a polished edge plane surface possesses many more carbon oxide functionalities than a basal surface. Accordingly, good voltammetric responses with cationic proteins like cytochrome c have been reported at the edge plane electrode whilevery poor responses are obtained at the basal electrode[14,12]. In the case of negatively charged proteins, promotion of electron transfer has been successfully achieved in the presence of positively charged species[12,15/17].
In any case some type of interaction must take place between the bare or modified electrode surface and the protein[18]. Models were developed, where it has been proposed that electron transfer occurs at specific sites on the electrode [19,20]. The electroactive sites may be provided by the electrode surface itself or induced by the modifier.
In spite of the fact that several factors can modulate the electrochemical behavior of redox proteins, previous electrochemical studies on c-type cytochromes [21]and on rubredoxin [22], under a variety of experimental conditions, led to sets of results of formal potentials, heterogeneous charge transfer rates and diffusion coef-ficients that do not differ significantly within the experimental errors. Critical comparison with other published data also revealed a good agreement between allvalues [[21,22]and references therein]. This prompted us to revisited the electrochemistry of these redox proteins using a new strategy recently proposed that consists of the use of membrane electrodes (ME) with the protein imprisoned between a dialysis membrane and the electrode surface [23/25]. Several important
advantages can be pointed out: (i) only very small volumes (2ml) of protein are necessary (in several cases a major obstacle can be thevery small amounts of protein sample available for investigations); (ii) ease of electrode preparation and low cost; (iii) the capacity to investigate various experimental parameters rapidly and also (iv) the thin layer configuration which easily allows the determination of quantitative information about the redox processes. Moreover, since the membranes used for the construction of the ME are charged, a convenient way to modulate the electric environment close to the electrode surface is offered and thus the role of electrostatic interactions in the efficiency of the electron transfer may be ascertained.
In this work glassy carbon, pyrolytic graphite and gold MEs are used to explore the electrochemical response of twoc-type cytochromes (c552from
Pseudo-monas nautica and c533 from D. vulgaris) and of rubredoxin from D. vulgaris. These proteins are all well characterized redox systems with a wide range of isoelectric points, charges, dipolar moments, surface topographies and redox potentials.
2. Experimental
Cytochromec552fromP. nautica and cytochromec533 and rubredoxin from D. vulgaris were isolated and purified as previously described [26/29]. Poly-L-lysine
hydrobromide (PLL) (Mr 19 200) was obtained from Sigma. All other chemicals used were of pro-analysis grade and the solutions were made up with deionized water from a Milli-Q water purification system. The supporting electrolyte was in most cases 10 mM Tris chloride buffer (pH 7.6).
Protein stock solutions were prepared in Tris chloride buffer (pH 7.6). The concentration of the oxidized forms of the proteins were determined spectrophotometrically using the following molar absorptivities: o552/19 000
M1 cm1
for cytochromec552[28],o553/23 400 M
cm1 for cytochrome c553 [29] and o492/6900 M
1
cm1for rubredoxin[26].
Voltammetric measurements were performed using a potentiostat/galvanostat from ECO-Chimie, Autolab/ PSTAT 10 as the source of applied potential and as a measuring device. The whole system was controlled by a personal computer that was also used in the data analysis, processed by theGPESsoftware package from
ECO-Chimie. In cyclicvoltammetry (CV) the scan rate, v, was varied between 10 and 200 mV s1. In square wave voltammetry (SW) the square wave amplitude,
Esw, was 50 mV, the step height,DEswwas 10 mV while the frequency was varied between 5 and 100 Hz. In differential pulsevoltammetry (DP) the pulse amplitude was 50 or 25 mV and the pulse duration,tp, wasvaried between 25 and 75 ms. In all experiments the potential wasvaried between an initialvalueEiand a final value
Ef, depending on the redox potential of the protein under study.
The electrochemical cell featured a conventional three-electrode configuration. The reference electrode was silverjsilver chloride with potential of 205 mV versus SHE and the auxiliary electrode was a platinum wire. Several working electrodes were used: a gold electrode (AuE) with nominal radius/0.08 cm
pur-chased from BAS (ref. MF-2014), a glassy carbon electrode (GCE) also from BAS (ref. MF-2012) with nominal radius/0.15 cm and a pyrolytic graphite
electrode (PGE) with nominal radius/0.2 cm,
con-structed as previously described [24]. The areas of the electrodes were determined from their response in a known concentration of the ferro/ferricyanide couple
[21]. They were found to be close to the nominal areas. Prior to each experiment the PGE and GCE were polished by hand with a water/alumina slurry and
then washed with deionized water, and the AuE with emery paper.
The MEs were prepared as previously described [23,24]. A small volume (2 ml) of the protein solution was deposited on a square piece (about twice the diameter of the electrode sensor) of the dialysis mem-brane (Spectra/Por MWCO 6000/8000, a negatively
charged membrane, symbolized by M
), then the polished electrode was pressed against the membrane and a rubber ring was fitted around the electrode body so that the entrapped solution formed a uniform thin layer. In the experiments with rubredoxin, 2 ml of protein/1.3/10
1
mg ml1PLL solution were used. The ME was then placed in the three-electrode cell containing the supporting electrolyte. While small ions can diffuse through the membrane, the protein and PLL molecules will stay entrapped in close vicinity to the electrode surface.
The solutions were deaerated for 10/15 min with
U-type nitrogen that had been previously passed through the supporting electrolyte and then saturated with
water. All measurements were done in a temperature-controlled room atT/249/18C.
The dipolar moments were estimated in the following way. An electric field exerts a torque on a dipole, and so the electric dipole moment of a system of charges can be defined by the system’s response to an electric field, even if the system is not strictly a dipole (a system of two opposite charges of equal magnitude). For a macro-molecule a detailed calculation would not be practical because of the complexity and dynamics of such a system. The calculation implemented in Ref. [30] is a simple approximation: assuming that the molecule would rotate around its geometric center if under the influence of an electric field, the contribution of each charge to the total dipole moment can be calculated as the product of the chargevalue and the positionvector relative to the geometric center. Global charges were calculated per monomer. No charges were used for the prosthetic groups.
3. Results and discussion
Rubredoxin is a small iron/sulfur protein (ca. 6 kDa)
with a monomeric iron center surrounded by four cysteinyl thiolate groups, giving a tetrahedral geometry around the metal. The isoelectric point of rubredoxin is low (pI:/3.5) and at pH 7 the protein presents an
overall negative charge of/11 [26]. Both cytochromes
have methionyl and histidinyl axial coordination, like horse heart cytochromec. Cytochromec552has a molar mass of 11 kDa, a neutral pI:/7 and an overall charge
of /4 at pH 7, while the molar mass, the pI and the
overall charge at pH 7 of cytochromec553are 9.1 kDa, 8.0 and /9, respectively [28,29]. The dipolar moments
calculated, as indicated above, are 322 D forP. nautica
cytochromec552, 215 D forD.vulgaris cytochromec533 and 52 D forD.vulgaris rubredoxin. Protein Data Base was used in these calculations.
3.1. Electrochemistry of cytochromes c552and c553at
MEs
The electrochemical behavior of cytochromec552was analyzed at membrane pyrolytic graphite (MPGE) and membrane glassy carbon (MGCE) electrodes using CV and SWvoltammetry. Typical cyclicvoltammograms at the MPGE are shown inFig. 1for a 100mM cytochrome
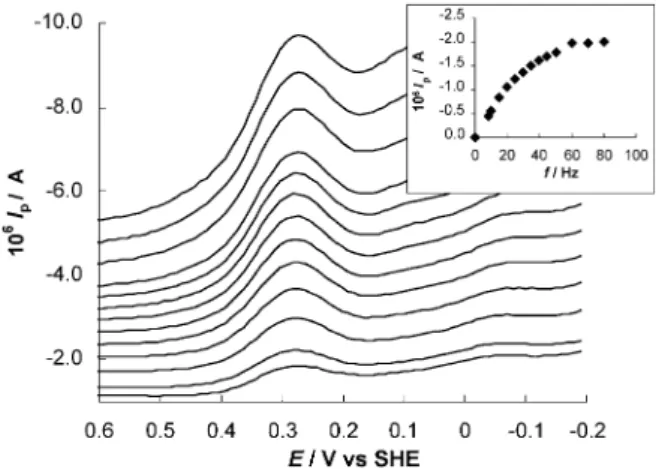
c552solution entrapped between the membrane and the electrode surface. In Fig. 2, square wave voltammo-grams for a 100 mM cytochrome c522 solution at the MGCE are shown. In both situations the ME was immersed in 10 mM Tris chloride buffer solution at pH 7.6.
the cathodic,Ipc, and anodic,Ipa, peak currents is close to one for all scan rates; (ii)IpcandIpaincrease linearly with increasing scan rate, at least up to a certain value (typically 100 mV s1; see insert of Fig. 1) and (iii) the difference, DEp, between the cathodic, Epc, and the anodic,Epa, peak potentials,DEp/Epa/Epc, increases
with increasing scan rate, though it tends to zero when the scan rate decreases. Over the range of scan rates analyzed, (DEpc/Epa)/2 values are constant within the
experimental errors (9/5 mV).
In SW voltammetry the peak current, Ip, initially increases with the increase of frequency but then tends to a constantvalue (see insert ofFig. 2). As for the peak potentials,Ep, as well as the peak width at half height,
W1/2, they remained constant in the frequency range studied.
Similar behavior was found in cyclic and SW voltam-metry for the reduction of cytochromec553at the same
MEs and under the same experimental conditions (not shown).
DP was also used in some experiments. It is observed that for different pulse durations,tp, the peak potential,
Ep, and its width at half height, W1/2, remain constant and that the peak current, Ip, increases with 1/tp.
In Table 1, peak potentials, half height width of SW and DP voltammograms and (Epc/Epa)/2 values
ex-tracted from CV are summarized.
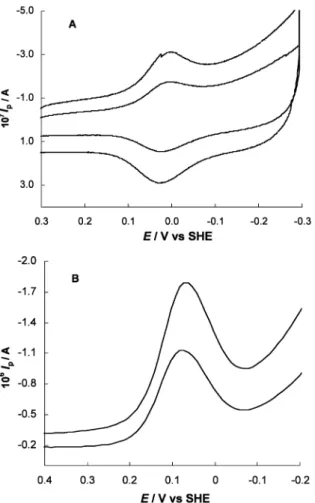
The electrochemistry of both cytochromes was then analyzed at the membrane gold electrode (MAuE) not previously modified. Aliquots of both cytochromes in the buffer solution were entrapped between the mem-brane and the AuE surface and the MAuE immersed just in the Tris buffer. In Fig. 3, typical cyclic (A) and square wave (B)voltammograms obtained at the MAuE are shown for 110mM cytochromec533solution. Stable and reproduciblevoltammograms were always obtained for both cytochromes (data forc552not shown) either in CV, SW or DP voltammetry. Analysis of the voltam-mograms in terms of the current and peak dependence on scan rate, frequency and pulse duration (depending on the technique) revealed that the reduction of cytochromesc522andc533at the MAuE closely follows the behavior previously described at the MGCE and PGEs. InTable 1, (Epc/Epa)/2values from CV, as well
asEpandW1/2values from SW and DPvoltammograms are summarized.
Further analysis of the CV data indicates a quasi-reversible redox reaction following thin layer theory [31]. Namely, the peak current increases linearly withv, in contrast to the diffusion controlled behavior (linearIp vs. v1/2 plot), and the cathodic and anodic peak separation increases with increasing scan rates. For all the scan rates, (Epa/Epc)/2 values are constant within
the experimental errors and so a measure ofE8?can be
evaluated as the mean ofEpcandEpa.
An estimation of the volume V (cm3) of effectively electrolyzed solution at the ME can be calculated using the concepts of thin layervoltammetry. Considering that the redox reactions are in the boundary of reversible behavior, V can be computed through the dependence of either the cathodic or anodic CV peak currents, Ip (A), with the scan ratev (V s1) using the relationship [31]:
Ip(9:39105)n2Vcv (1)
In Eq. (1), c (mol cm3) is the concentration of the entrapped protein solution, n the number of electrons exchanged in the redox reaction and the other symbols have the meaning previously defined. Taking into account the areas of the electrodes, A (cm2), a typical layer thickness, l (cm), can be computed for each experiment. The values thus obtained are shown in Tables 2 and 3.
Fig. 1. Cyclic voltammograms of 100 mM cytochrome c552 at the
membrane PGE in 10 mM Tris chloride buffer solution (pH 7.6). Scan
rate (mV s1
): 5, 10, 20, 50, 75, 100, 125, 150, 175, 200. Insert:
variation of CV cathodic peak current with the scan rate.
Fig. 2. Square wavevoltammograms of 100mM cytochromec552at the
membrane GCE in 10 mM Tris chloride buffer solution (pH 7.6). Frequency (Hz): 8, 10, 15, 20, 25, 30, 35, 40, 45, 60, 70, 80, 90, 100.
Using Laviron’s treatment for thin layervoltammetry [32], the heterogeneous charge transfer rate constant,ks (cm s1) can be calculated from the variation of the peak potential separation with the scan rate fitted to a working function ofDEpversus the kinetic parameterm:
mksA=[V(nF=RT)v] (2)
Thevalues computed are shown inTables 2 and 3. In the same tables are also presented, for comparison,ksas well as E8? values obtained with non-MEs. All these values will be discussed later.
A comment should be made, however, about l. Although l values depend on experimental parameters, especially on the preparation of the ME, fairly repro-ducible results were obtained as can be seen inTables 2 and 3. Thin layer behavior will be observed as long as the cell thickness l is smaller than the diffusion layer thickness for a given experimental time scale,t, that is:
lB(2Dt)1=2 (3)
whereDis the diffusion coefficient of the species. Using
D/1.5/10
6
cm2 s1 as a mean value for the diffusion coefficient of the monohemic cytochromes [21] and for the highest l found experimentally (l/ 103 cm,Table 3) this corresponds tot/0.3 s. So, in
CV mass transfer within the cell can be neglected and thin layer behavior observed for scan rates up to about
RT/Ft/0.09 V s
1
. In SW and DP voltammetry experiments, the diffusion layer thickness is always smaller than l, even for the longest time scales used, i.e. tp/0.1 s (f/5 Hz) and tp/0.075 s, respectively.
Analysis of SW and DP voltammograms should be made in terms of diffusion-controlled processes, which shows that the reductions of cytochromec522andc533at the ME are within the boundaries of reversibility. Indeed, values of peak width at half heights of both SW and DPvoltammograms do not depart significantly from those expected for reversible processes. Forn/1,
the theoreticalvalues areW1/2/91 mV andW1/2/123
mV for DP and SW voltammetry, respectively, [31,33]. Peak potentials remained constant within the experi-mental error (9/5 mV) over the frequency andtpranges
analyzed. So, Ep values from SW voltammograms can be used as a direct measure of formal potentialsE8?. As
far as DPvoltammograms are concerned one hasE8? /
Ep/DE/2, whereDE is the pulse amplitude. Thevalues
obtained are summarized inTables 2 and 3.
Table 1
Electrochemical behavior of the proteins at the membrane electrodes
Membrane electrode Parameter GCarbon Gold PGraphite
Protein CV SW DP CV SW DP CV SW
P. nautica (Epc/Epa)/2 orEp/mV 227 228 / 222 223 214 244 247
c552 W1/2/mV / 126 / / 126 112 / 119
D.vulgaris (Epc/Epa)/2 orEp/mV 18 25 23 13 13 7 16 23
c553 W1/2/mV / 131 105 / 117 94 / 131
D.vulgaris a (Epc/Epa)/2 orEp/mV / / / / / / 30 33
Rubredoxin W1/2/mV / / / / / / / 126
Peak potentials and peak width at half height are within the experimental error9/5 mV. Medium: Tris buffer 0.01 M pH 7.6.
a Tris buffer 0.01 M pH 7.6, KCl 0.1 M and
poly-L-lysine.
Fig. 3. Cyclicvoltammograms (A) and square wavevoltammograms
(B) of 110mM cytochromec553at the MAuE in 10 mM Tris chloride
buffer (pH 7.6). CV, scan rate (mV s1): 50, 100; SW, frequency (Hz):
One of the advantages of the ME approach is the capacity to investigate rapidly the influence ofvarious experimental parameters on the redox behavior, like the pH and the composition of the supporting electrolyte. This can be done without using large amounts of protein samples since the ME, once mounted in the cell, need not to be removed and serves for all the experiments.
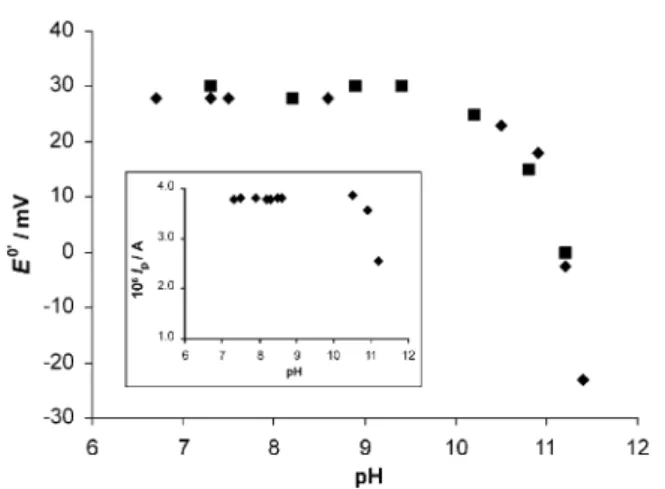
The pH dependence of the formal potentialE8?and peak currents of cytochromec553was investigated using SW voltammetry at the MEs. The results obtained for thevariation ofE8?at the MPGE are shown inFig. 4, where SW peak potentials were used as a measure of
E8?, as discussed before. In the same figure is also shown the pH dependence of the formal potential as deter-mined by CV measurements at a gold electrode in the presence of 4,4?-dithiodipyridine as reported before[21].
The square wave peak current dependence on pH at the MPGE can be seen in the insert of Fig. 4. The variation observed for cytochromec553follows previous results obtained by CV at a 4,4?-bipyridine modified
gold electrode. In particular, the marked decrease above pH 10/11 due to a modification of the cytochromec553
structure is observed, as discussed in Ref.[11].
From this set of results and as previously reported for horse heart cytochrome c at a MPGE [25], MEs furnished the same formal potential/current/pH
pro-files as those observed at conventional electrodes and in a more efficient way.
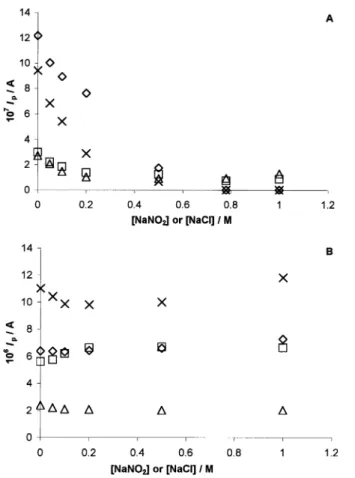
The effect of varying the ionic strength of the supporting electrolyte was analyzed for both cyto-chromes at the MAu and MPG electrodes following thevariation of the SW peak currents upon additions of NaNO2and NaCl. The results obtained at the MAu and MPG electrodes can be seen in Fig. 5(A) and (B), respectively. While the peak current height at the MAuE decreases with the increase of both NaCl and NaNO2
Table 2
Results for cytochromec552fromP. nautica
Electrode (d/mm) E8?9/5/mVvs. SHE 103ks/cm s
1 105/V cm3 104
l/cm Reference
GC,d/2.8a 215 5.09/0.1 / / [21]
GC,d/0.006a 228 2.09/0.1 / / [21]
Au,d/1.6a / 0.89/0.1 / / [21]
Au,d/0.022a 233 0.49/0.1 / / [21]
MPG,d/4b 244, 247 (SW) 1.49/0.3 79/1 5.89/0.5 This work
MGC,d/3b 227, 228 (SW) 1.29/0.2 1.69/0.1 2.29/0.2 This work
MAu,d/1.5b 222, 223 (SW), 214 (DP) 1.09/0.2 0.89/0.1 4.59/0.5 This work
Allvalues shown were computed from CV data, unless otherwise specified: SW square wave and DP differential pulse.
a
Medium: phosphate buffer and 4,4?-dipyridyl.
b
Medium: Tris buffer and membrane MSpectra/Por.
Table 3
Results for cytochromec553fromD.vulgaris
Electrode (d/mm) E8?9/5 /mVvs. SHE 103ks/cm s1 105/Vcm3 104l/cm Reference
Au,d/0.5a 20 :/1 / / [11]
GC,d/0.006b 4 / / / [21]
Au,d/0.022b 11, 14 (SW), 8 (DP) / / / [21]
MGC,d/3c 18, 25 (SW), 23 (DP) 59/1 59/1 79/1 This work
MAu, d/1.5c 13, 14 (SW), 7 (DP) 79/1 1.89/0.2 109/1 This work
Allvalues shown were computed from CV data, unless otherwise specified: SW, square wave and DP, differential pulse.
a Medium: phosphate buffer and 4,4?-dipyridine.
b Medium: phosphate buffer and 4,4?-dipyridyl.
c Medium: Tris buffer and membrane M
Spectra/Por.
Fig. 4. pH dependence of the formal potentialE8?of cytochromec553
determined by SWvoltammetry at the membrane GCE (") and CV at
a gold electrode and in the presence of 0.001 M 4,4?-dithiodipyridine
(j). Insert: pH dependence of the peak current for cytochromec553
concentrations, constant SW peak heights (within 5%) were obtained at the MPGE. As to the SW peak potentials, in most situations there is some shift towards less positivevalues upon increase of the salt concentra-tion, as can be appreciated inFig. 6.
3.2. Electrochemistry of rubredoxin at MEs
Typical cyclicvoltammograms obtained at the MPGE are shown in Fig. 7 for 71 mM rubredoxin entrapped between the membrane and the PG electrode in the absence (A) and in the presence (B) of poly-L-lysine
(PLL). The MPGE was immersed in 0.1 M KCl and Tris buffer pH 7.6. As can be seen from Fig. 7, a voltam-metric response is obtained only in the presence of PLL. This confirms previous work where it was shown that the presence of positively charged species is a mandatory condition for the occurrence of reduction of negatively charged proteins at an electrode that bears a net negative charge[15,16].
Analysis of the cyclic voltammograms for scan rates in the range 15/200 mV s
1
, showed that the
depen-dence ofIpcandIpaon v is linear for scan rates B/100
mV s1
, in accord with thin layer behavior. Moreover,
Fig. 5. Ionic strength dependence of SW peak current in 10 mM Tris
chloride buffer (pH 7.6): (A) at the MAuE for 110mM cytochromec553
in the presence of (2) NaNO2 and (/) NaCl and for 100 mM
cytochromec552in the presence of (I) NaNO2and (^) NaCl; (B) at
the membrane PGE for 110mM cytochromec553in the presence of (2)
NaNO2 and (/) NaCl and for 100 mM cytochrome c552 in the
presence of (I) NaNO2and (^) NaCl.
Fig. 6. Ionic strength dependence of SW peak potential in 10 mM Tris
chloride buffer (pH 7.6): (A) at the MAuE for 110mM cytochromec553
in the presence of (2) NaNO2 and (/) NaCl and for 100 mM
cytochromec552in the presence of (I) NaNO2and (^) NaCl; (B) at
the membrane PGE for 110mM cytochromec553in the presence of (2)
NaNO2 and (/) NaCl and for 100 mM cytochrome c552 in the
presence of (I) NaNO2and (^) NaCl.
Fig. 7. Cyclicvoltammograms of 71mM rubredoxin at the membrane
PGE in 0.1 M KCL and 10 mM Tris chloride buffer solution (pH 7.6)
in the absence (A) and presence (B) of 130mg cm3of poly-L-lysine.
the difference between the anodic and cathodic peak potentials increases with an increase in the scan rate, from 10 mV at 5 mV s1to 57 mV at 200 mV s1, thus indicating a quasi-reversible process. Constant (Epa/
Epc)/2 values within the experimental errors were obtained for all scan rates.
Well-defined and reproducible SW voltammograms were also obtained at the MPGE in the presence of PLL, withW1/2/126 mV and Ep/33 mV.
Further analysis of the data, as previously described for the monohemic cytochromes, leads to thevalues of
E8?,k,Vandlcollected inTable 4. In this tableE8?and
ksvalues reported in the literature are also presented for comparison.
4. General discussion
From the data presented in Tables 2/4 two major
facts are apparent. Clearly, good agreement is achieved for the formal potentials as well as the heterogeneous charge transfer rate constant values obtained at the different MEs. Moreover, and in spite of all the factors that can influence a successful communication between a redox protein and a suitable electrochemical interface, it is worth noticing how the electrochemical data at the ME for this set of proteins matches previous results. Similarvalues were obtained forE8?and ksusing either
different types of MEs (MPG, MGC, MAu) or non-MEs of gold, carbon and ruthenium, with dimensions ranging from themm to the mm size, and in the absence or in the presence of different facilitators or surface modifiers.
However, the results now presented at the MAuE, namely for cytochromec553, differ from previous reports in the sense that, in this work, a direct electrochemical response of both D. vulgaris cytochrome c533 and P. nauticacytochromec522was observed when a thin layer of protein solution was entrapped between the nega-tively charged membrane and the gold electrode surface in the absence of any sort of facilitator.
It has been claimed that in order to achieve a fast electron transfer between a redox protein and a metal
electrode, the surface needs to be functionalized in such a way as to allow a protein/electrode surface
recogni-tion process to take place. The results now presented, as well as those reported for T. ferrooxidans cytochrome
c552and horse heart cytochromec reductions at similar PM gold electrodes [23,25], suggest a mechanism invol-ving mainly favorable electrostatic interactions between the charged redox proteins and the opposite charges of the membrane. Reasonably fast, reproducible and persistent responses were obtained in a hydrophobic surface not previously modified or in the presence of some facilitator. Even undesirable phenomena like blocking of the electrode surface by impurities or the proteins themselves seem to be overridden by the use of a charged membrane close to the electrode surface. Direct electrochemical communication between the re-dox proteins and the electrode certainly results from a proper orientation of the cytochromes governed by the electric environment built up by the charge membrane. Clear evidence that electrostatic interactions are implied in the redox reactions of the above proteins at the MAuE is shown up by how the ionic strength of the medium affects the electrochemical response. For both cytochromes, and as shown inFig. 5, there is a decrease of SW peak currents with the increase of the salt concentration, independent of the nature of the anion of the electrolyte (which eventually could have a different affinity to the positively charged sites of both cytochromes). Increasing the ionic strength causes a diminishing of the overall charge of both the membrane and the cytochromes thus decreasing the favorable electrostatic interactions. Since the overall charge as well as the dipolar moment for cytochromec553is higher than for cytochromec552(/9 and 322 D, and /4 and
215 D, respectively) the effect is much more pronounced for the former.
The decrease of the SW peak currents is accompanied by a negative shift tendency of the SW peak potential, as can be seen in Fig. 6, showing that the redox reaction becomes more difficult. This variation is again more pronounced for cytochromec553.
The results now presented at the membrane carbon electrodes show that the presence of a negatively
Table 4
Results for rubredoxin fromD.vulgaris
Electrode (d/mm) E8?/mV9/5vs. SHE 103ks/cm s1 104/Vcm3 104l/cm Reference
Au,d/1.6a 5 0.79/0.2 / / [22]
Au,d/0.025a 8 0.79/0.3 / / [22]
GC,d/3a 16 1.09/0.5 / / [22]
MPG,d/4b 30, 33 (SW) 3.89/0.3 (1.29/0.1) (9.59/0.8) This work
Allvalues shown were computed from CV data, unless otherwise specified: SW, square wave and DP, differential pulse.
a Medium: 0.1 M KCl, Tris buffer, neomycine and Mg2
.
b Medium: 0.1 M KCl, Tris buffer,
charged membrane in close vicinity to the electrode surfaces is effective in entrapping the protein solutions while not disturbing the environment of the imprisoned electroactive species. Indeed, the behavior reported at the MPGE and MGCE for both cytochromes follows previous work more closely , namely a quasi-reversible response was observed for the reduction of cytochrome
c553at a bare PGE in the absence of any activating agent [34] and the same has been reported for horse heart cytochrome c. The isoelectric points of both cyto-chromes c522 and c533 are not as high as that of cytochrome c (pI/10.5) and so the overall positive
charge is not so determining, but still important inter-actions must be operative with the carbon surfaces negatively charged through deprotonation of acidic C/
O functionalities. However, electrostatic effects do not seem to be the major factor determining the electron transfer process since the redox behavior of both cytochromes at the membrane PGE was shown to be much more insensitive to changes in ionic strength. There is some effect on the SW peak potentials, again clearer for cytochrome c553 (Fig. 6) but, in contrast to what was observed at the gold ME, constant SW peak currents were obtained within 5% for NaNO2or NaCl concentrations up to 1 M, as can be seen inFig. 5. This does not rule out that discrete charge interactions are absent but other complementary interactions must be more important. Hydrogen-bonding interactions be-tween the electrode surface C/O functionalities and
most probably lysine groups on cytochromes must be the major factor controlling the efficiency of the electron transfer. Both model building and experimental ap-proaches [35,36] show that interactions between lysine residues and carboxylates on a reaction partner are important features of the physiological situation. These features are mimicked by the interactions of the C/O
functionalities with the protein and a proper orientation towards the electrode surface is then achieved and the electron transfer occurs.
As to the results obtained at the MPGE for rubre-doxin, which presents an overall negative charge of/13
at pH close to 7, the absence of a response in the absence of a positively charge species can be clearly identified with electrostatic barrier at the negatively charged electrode surface: only by inclusion in the entrapped protein solution of poly-L-lysine does the reduction
reaction take place. These results follow from previous results on the electrochemistry of rubredoxin at carbon electrodes [12,23] as well as from what has been observed for [2Fe/2S] spinach ferredoxin entrapped
between a negative membrane and a graphite surface [24]. In any case, once a suitable positive species is included in the protein solution, reduction occurs and the negative charge of the membrane seems not to affect the redox reaction of the negatively charged protein. So, ME remainedvery attractive for the study of these redox
systems since aspects like the very tiny amounts of protein needed and how easily several experimental variables can be changed using the same unit are still valid.
5. Conclusions
Many effects can modulate the electrochemical beha-vior of redox proteins at metal and non-metal electro-des. The good agreement obtained in all situations for the electrochemical parameters, using different strate-gies, helped to gain a further insight into the nature and relative importance of all the factors that can affect charge transfer in complex redox systems like proteins. Different electrodes and experimental conditions were used: metals and non-metals, micro to millimeter size range, absence and presence of facilitators. However, in all cases a favorable domain for electron transfer to occur was certainly achieved which accounts for the similarity of the values encountered for the formal potentials as well as for the heterogeneous charge transfer rate constants. Discrepancies in the literature between, for instance,ksvalues have been attributed to how critically dependent they are on the nature of the electrodejsolution interface. The results discussed show that the electrochemical response of this set of proteins is not very dependent on factors such as the nature of the electrode material, as long as a suitable domain for electron transfer is built up at the electrode solution interface by different types of complementary interac-tions. The results presented in this work of the direct electrochemistry of the cytochromes at the MAuE, together with previous data, show that electrostatic interactions can indeed be very important in determin-ing electron transfer reactions of these biological mole-cules.
Although most redox reactions in the biological environment are highly specific, binding interactions are to be expected where there are complementary domains to engage multi-site interactions. This can be mimicked by different types of electrochemical inter-faces that are then capable of interacting reversibly and specifically with the protein surface, thus creating a favorable domain for electron transfer to occur.
Acknowledgements
References
[1] P. Yeh, T. Kuwana, Chem. Lett. (1977) 1145.
[2] M.J. Eddowes, H.A.O. Hill, J. Chem. Soc. Chem. Commun. (1977) 771.
[3] F.A. Armstrong, H.A.O. Hill, N.J. Walton, Acc. Chem. Res. 21 (1988) 407.
[4] H.A.O. Hill, N.I. Hunt, Methods in Enzymology, vol. 227 (Ch. 19), Academic Press, New York, 1993.
[5] P. Bianco, J. Haladjian, Biochimie 76 (1994) 605.
[6] F.A. Armstrong, G.S. Wilson, Electrochim. Acta 45 (2000) 2623. [7] F.N. Buchi, A.M. Bond, J. Electroanal. Chem. 314 (1991) 191. [8] H.A.O. Hill, N.I. Hunte, A.M. Bond, J. Electroanal. Chem. 436
(1997) 17.
[9] P.M. Allen, H.A.O. Hill, N.J. Walton, J. Electroanal. Chem. 178 (1984) 69.
[10] H.A.O. Hill, D.J. Page, N.J. Walton, D. Whitford, J. Electroanal. Chem. 187 (1985) 315.
[11] P. Bianco, J. Haladjian, R. Pilard, J. Electroanal. Chem. 136 (1982) 291.
[12] F.A. Armstrong, P.A. Cox, H.A.O. Hill, V.J. Lowe, B.N. Oliver,
J. Electroanal. Chem. 217 (1987) 331.
[13] M.A. Harmer, H.A.O. Hill, J. Electroanal. Chem. 189 (1985) 229.
[14] F.A. Armstrong, H.A.O. Hill, B.N. Oliver, J. Chem. Soc., Chem.
Commun. (1984) 976.
[15] F.A. Armstrong, H.A.O. Hill, B.N. Oliver, N.J. Walton, J. Am.
Chem. Soc. 106 (1984) 921.
[16] F.A. Armstrong, A.M. Lannon, J. Am. Chem. Soc. 109 (1987) 7211.
[17] D. Datta, H.A.O. Hill, H. Nakayama, J. Electroanal. Chem. 324 (1992) 307.
[18] J.J. Davis, H.A.O. Hill, A.M. Bond, Coord. Chem. Rev. 200/202
(2000) 411.
[19] F.A. Armstrong, A.M. Bond, H.A.O. Hill, I.S.M. Psalti, C.G. Zoski, J. Phys. Chem. 93 (1989) 6485.
[20] F.A. Armstrong, A.M. Bond, H.A.O. Hill, B.N. Oliver, I.S.M.
Psalti, J. Am. Chem. Soc. 111 (1989) 9185.
[21] M.M.C. Santos, P.M.P. Sousa, M.L.S. Gonc¸alves, H. Lopes, I.
Moura, J.J.G. Moura, J. Electroanal. Chem. 464 (1999) 76.
[22] M.M.C. Santos, P.M.P. Sousa, M.L.S. Gonc¸alves, C. Ascenso, I.
Moura, J.J.G. Moura, J. Electroanal. Chem. 501 (2001) 173. [23] J. Haladjian, P. Bianco, F. Nunzi, M. Bruschi, Anal. Chim. Acta
289 (1994) 15.
[24] J. Haladjian, I. Thierry-Chef, P. Bianco, Talanta 43 (1996) 1125.
[25] E´ . Lojou, P. Bianco, J. Electroanal. Chem. 485 (2000) 71.
[26] M. Bruschi, J. LeGall, Biochim. Biophys. Acta 271 (1972) 279. [27] T. Yagi, Methods in Enzymology, vol. 243 (Ch. 8), Academic
Press, New York, 1994.
[28] L.M. Saraiva, G. Fauque, S. Besson, I. Moura, Eur. J. Biochem.
224 (1994) 1011.
[29] G. Fauque, J.J.G. Moura, S. Besson, L.M. Saraiva, I. Moura,
Ocea´nis 18 (1992) 211.
[30] P.N. Palma, L. Krippahl, J.E. Wampler, J.J.G. Moura, Protein
Sci. 39 (2000) 372 (http://www.dq.unl.pt/bioin/chemera).
[31] A.J. Bard, L.R. Faulkner, Electrochemical Methods, Fundamen-tals and Applications, 2nd ed, Wiley, New York, 2001.
[32] E. Laviron, J. Electroanal. Chem. 101 (1979) 19.
[33] K. Aoki, K. Maeda, J. Osteryoung, J. Electroanal. Chem. 272 (1989) 17.
[34] P. Bianco, J. Haladjin, Electrochim. Acta 39 (1994) 911. [35] T.L. Poulos, J. Kraut, J. Biol. Chem. 255 (1980) 10322. [36] F. Millett, C. de Jong, L. Paulson, R.A. Capaldi, Biochemistry 22