M
ESTRADO
F
INANÇAS
T
RABALHO
F
INAL DE
M
ESTRADO
D
ISSERTAÇÃO
A
RE
CDO
S THE BEAUTY OR THE BEAST OF FINANCIAL
MARKETS
?
J
OÃO
P
EDRO
B
ARATA
C
ORREIA
M
ESTRADO EM
F
INANÇAS
T
RABALHO
F
INAL DE
M
ESTRADO
D
ISSERTAÇÃO
A
RE
CDO
S THE BEAUTY OR THE BEAST OF FINANCIAL
MARKETS
?
J
OÃO
P
EDRO
B
ARATA
C
ORREIA
O
RIENTAÇÃO:
R
AQUELM
EDEIROSG
ASPARi
Acknowledgments
First of all, I would like to thank Prof. Dr. Raquel Medeiros de Gaspar for her supervision, counselling and help in thesis elaboration.
I also would like to thank to my friends by the availability, openness and support provided during the thesis preparation and with whom I had the opportunity to share this rich and profitable experience. More important still, I have to thank to my family for always giving me the best support during the master's program.
In addition, I want to show my gratitude to the teachers of ISEG Master in Finance, by the knowledge and experiences imparted and by the further interest I gained by the subjects taught.
Are also worthy of a note of appreciation my master' colleagues, my teammates and the ISEG Staff by the support provided, and by their permanent friendliness.
Without them the realization of this thesis and especially this Master's degree would not have been possible.
ii
Abstract
The Financial Crisis of 2007-2010 started in the U.S. and speedily was spread among the world. Collateralized Debt Obligations (CDOs) had been strongly involved in the formation and propagation of the crisis. This study analyses the securitization process of CDOs. We review its history with a special emphasis on its role in the recent Financial crisis and expose its main problems and advantages. Afterward, we suggest possible future usage of CDOs.
Three different cases are analysed:(i)European Safe Bonds (ESBs), (ii) Biomedical research programs and (iii)Microcredit. The cases studies start by introduce the industry and expose the existent problem for each situation. After, they follow with the presentation of the proposed approach and why CDOs are an appropriate and enriching solution exposing the benefits CDOs could bring. Finally are done some simulations and illustrations to better explanation and compared the results with alternative proposals, if they exist.
iii
Resumo
A crise financeira de 2007-2010 começou nos EUA e rapidamente se espalhou pelo mundo. Os Collateralized Debt Obligations (CDOs) estiveram fortemente
envolvidos na formação e propagação da mesma. Neste trabalho vamos apresentar e estudar o produto. É analisada a história desde a sua criação, com um ênfase especial sobre a sua participação na recente crise financeira e expostos os seus principais problemas e vantagens. Numa segunda parte, o trabalho aborda três casos para a utilização futura dos CDOs.
Três diferentes possibilidades são analisadas: (i) European Safe Bonds (ESBs), (ii) Financiamento de programas de pesquisa biomédica e (iii) Microcrédito. Os casos de estudo começam por introduzir a indústria e expor o problema existente para cada situação. De seguida, os casos seguem com a apresentação da abordagem proposta, explicando os benefícios que a utilização dos CDOs trariam e porque é que os CDOs são uma apropriada solução para o problema. Por fim são feitas algumas simulações e ilustrações para uma melhor compreensão dos benefícios. Os estudos comparam também a proposta apresentada com alternativas propostas, no caso de elas existirem.
iv
List of Figures
Figure 1. Collateralized Debt Obligation Layout ... 5
Figure 2. Typical CDO Transaction... 6
Figure 3. Proportion of managed synthetic CDOs to static synthetic CDOs, 2000-2003. 9 Figure 4. Global Issuance of CDOs by Motives, 1998-2003 ... 10
Figure 5. Global CDO Issuance, 2000-2012 ... 12
Figure 6. Diabolic loop between Sovereign debt risk and Banking debt risk ... 16
Figure 7. CDO proposed by Euro-nomics Group ... 17
Figure 8. ESB Simulations Results ... 21
Figure 9. New Drug Application (NDA) Review Process ... 24
Figure 10. Research Backed Obligations (RBOs) ... 25
Figure 11. Hypothetical Project Cash Flows (Drug Research) ... 27
Figure 12. Hypothetical Loan Cash Flows (Microcredit) ... 32
Figure A.1 Global CDO Issuance by Purpose ... 41
Figure A.2 Share of CDOs in ABS issuance, in Europe (1996-2001) ... 41
Figure A.3 Expected Loss' Formula ... 41
Figure A.4 Credit Default Swap Mechanism ... 41
Figure A.5 Ali Copula for the Joint distribution ... 42
Figure A.6 Davis-Lo Adapted Contagion Model ... 42
Figure A.7 Domino's Contagion Effect ... 42
Figure A.8 Dependency Process ... 43
Figure A.9 Isolated Project Return Distribution (Drug Research) ... 43
Figure A.10 Net Present Value (NPV) and Internal Rate of Return (IRR) Formulas ... 43
Figure A.11 Expected Results : 1 Project Vs 100 Projects (Drug Research) ... 43
Figure A.12 Hypothetical Isolated Loan Return Distribution (Microcredit) ... 44
v
List of Tables
Table I. Summary of main CDO Problems and Advantages ... 14
Table II. Comparison: ESB Vs Eurobonds ... 22
Table A.I General Government Deficit in Percentage of GDP ... 45
Table A.II General Government Gross Debt in Percentage of GDP ... 45
Table A.III Euro-zone 10 years Yields Correlation Matrix ... 46
Table A.IV Alphanumerical Ratings and Respective Cumulative 10 years Default Rate ... 46
Table A.V CDO Composition in the Year 2014 ... 46
Table A.VI One Simulation to the Independent Default Case ... 48
Table A.VII Euro-zone 10 years CDS Daily Prices Correlation Matrix ... 48
Table A.VIII Using the Default Correlation Matrix to Generate Correlated Random Numbers (Steps) ... 49
Table A.IX Mean Industry Returns and Cost-of-Capital for Different Time Periods of New Chemical Entities (NCES) ... 49
Table A.X Number of Cases of Success and Respective Return to 100 Projects ... 49
vi
Table of Contents
Acknowledgments ... i
Abstract ... ii
Resumo ... iii
List of Figures ... iv
List of Tables ... v
1. Introduction ... 1
2. Literature Review ... 3
3. CDOs - Collateralized Debt Obligations ... 5
3.1 CDOs Structure and Characteristics ... 5
3.2 Role of CDOs in the Financial Crisis – Their Problems and Advantages ... 8
4. CDOs Case Studies ... 15
4.1 European Safe Bonds (ESBs) ... 15
4.1.1 Existent Problem ... 15
4.1.2 Proposed Approach ... 17
4.1.3 Some Numerical Results ... 19
4.2 Drug Research ... 23
4.2.1 Existent Problem ... 23
4.2.2 Proposed Approach ... 25
4.2.3 Illustration ... 26
4.3 Microcredit ... 28
4.3.1 Existent Problem ... 28
4.3.2 Proposed Approach ... 30
4.3.3 Illustration ... 31
5. Conclusions and Limitations ... 34
vii
Appendix ... 42
Figures ... 42
1
1. Introduction
The theme of this dissertation are the so-called Collateralized Debt Obligations (CDOs). The text is written in a way that could be understandable by the scientific community as well as by the general public. The work uses sources of historical information and public knowledge such as web documents, newspapers, articles published in scientific journals, statistical data sources, articles from the investment banks, books and an Oscar-Winning documentary in order to obtain different points of view.
Briefly, a Collateralized Debt Obligation (CDO) is a financial security whose value and income payments depend on a pool of underlying assets. This pool is structured, divided and then commercialized in different tranches which have different return, risk and priority in payment. During the Financial crisis of 2007-2010, also called the “subprime crisis”, securitization and specifically CDOs have been extremely criticized. Due to their crisis connection CDOs issuance and commercialization sharply declined in succeeding years.
The main purpose of this work is to understand and analyse how CDOs contributed for the recent Financial crisis, and how to prevent the same mistakes from occurring, so that CDOs could be used in the future. The study meets CDOs characteristics, and a set of solutions for future use of CDOs.
2
In Chapter 4, are studied three possible ways of CDO applications in three different areas such as the Eurozone sovereign debt problem, the Drug Research financing and the Microcredit. The case studies introduce the industry and expose the existent problem for each situation. They reveal how the CDO potentialities can help change the industries fate by solving some of its current challenges. Furthermore, these studies compare CDOs proposal with alternative proposals, if they exist, and include brief hypothetical simulations to CDO utilization exposing its benefits.
At last, Chapter 5 exhibits the work conclusions and refers limitations to it and to the case studies. It also points some future research that could be done.
3
2. Literature Review
The main purpose of this review is to explain and support theoretically the proposed study. To that end are presented the key papers to the different sections and some relevant studies pre and post crisis.
Regarding the CDOs description, we closely follow the previous documents of Mitchell (2004), Bond Market Association (2004) and Hongwen Du et al (2010). We also use documents provided by the industry as Duff & Phelps (2008), Kaminker (2003) and Hyder (2002). Mitchell (2004) identifies the sources of value creation in the structured finance. Bluhm (2003) analyses the main reasons that have supported the success of CDOs business.
The CDOs problems and its role in the Financial Crisis is analyzed in Barnett-Hart (2009), that relates the story of the CDO market meltdown, and in the Ferguson (2010) Oscar-Winning documentary. There are also studies blaming the credit rating agencies by the CDOs misrating such as Benmelech & Dlugosz (2008) and the Griffin & Tang (2008; 2012). Othersgo further and question the role of rating agencies as for example Hill (2004) and Partnoy (2006). Malhmann (2013) studies the so-called Magnetar trade, a strategy to take advantage of CDO failure. He tests the argument that tranches from Magnetar-sponsored CDOs present overly risky investments than non-Magnetar peers.
4
The use of CDOs to finance Biomedical research comes from an idea of Fagnan et al (2013) that proposed a new industry funding model using financial engineering techniques, similar to CDOs, to raise large amounts of capital. The Biomedical research owns characteristics that turn its funding in an high risk investment. The review of Morgan et al (2011) compiles costs for different time periods and for different group diseases. It shows that the costs of a new drug development are very uncertain. Furthermore its development follows a lengthy path described by Fagnan et al (2013) and Dimasi et al (1991; 2003). Fagnan et al (2013) focus its proposal in the cancer. They conclude that it is a natural application for megafund financing, because it owns a group of unique features such as, its long development cycle and its high cost research.
5
3. CDOs - Collateralized Debt Obligations
3.1 CDOs Structure and Characteristics
A Collateralized Debt Obligation (CDO) is a structured financial instrument that owns multiple classes of liabilities created from a pool of assets, the collateral pool, which could be static or revolving. Typically the CDO underlying pool contains a smaller number of assets (around 100) which are characterized to be fairly heterogeneous (Bond Market Association; 2004) (Byström; 2008). Depending on the nature of the CDOs underlying assets they could present other denominations: Collateralized Loan Obligation (CLO) for a Collateralized Obligation (CO) backed by loans, Collateralized bond obligations (CBO) if it is backed primarily by bonds or even Collateralized Fund Obligation (CFO) when the underlying assets are funds.
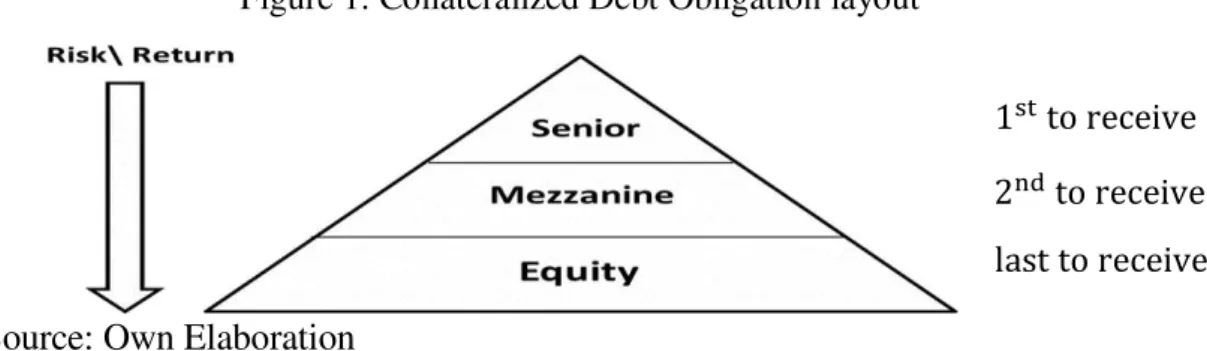
The CDO pool could be divided in multiple tranches with different returns and level of risk. However the most common shape is three tranches, the Senior, the Mezzanine and the Equity or Junior tranche.
The interest and principal payments are made in order of seniority. In other words, based on how much cash flow the CDO collects from the collateral pool,first the Senior tranche receive its stipulated amount, after that receive the Mezzanine tranche and lastly the remaining value goes to the Equity tranche, which deals with a floating interest rate. “The way it works is frequently referred to as a waterfall of cash-flows."
Hongwen Du et al (2010)
Consequently, the Senior tranches are considered the safest securities and the Junior tranches offer a wish yield, to compensate for the additional default risk. The individual assets default risk and the default correlations between them are critical to determine the expected distribution losses of the pool. If the pool is well diversified, it
Source: Own Elaboration
Figure 1. Collateralized Debt Obligation layout
6
leads to a bigger safety in the Senior tranche. If not, it concentrates the losses, leading to less safety in the Senior tranche and could even increase the value of the Equity tranche.
The unequal partitioning of risk among the investors is a feature which differentiates CDOs from other pooled investments. "Unlike a mutual fund, in which investors have rights and risks in proportion to the size of their investment, some CDO investors have more rights and greater security than other CDO investors of the same transaction." Bond Market Association (2004)
CDOs transactions normally involve an asset manager, an investment bank, a trustee, rating agencies, investors, an hedge counterpart, a credit enhancer and are usually issued by a special purpose vehicle (SPV).
The SPV works as an independent entity that is legally isolated from the bank and is used to isolate financial risk making its obligations secure even if the bank goes bankruptcy. The SPV purchases the securities for the underlying pool and split it into several tranches (Mitchell; 2004). However these vehicles became a way for chief financial officers (CFOs) to hide debt and occult the true company financial health. The asset manager primary function is to manage the collateral portfolio shortening or strengthen its asset's position according with it investment outlook. The CDO manager could be more or less active depending on the prospectus of the CDO and his expertise Source: Own Elaboration
7
is essential to the CDO success. Furthermore he receives a management fee by his task and wish to own, as much as possible, assets under management. On the other hand, the hedge counterpart has the purpose of removing all the non-credit-related risk from the CDO transaction. The trustee protects investors’ interests by ensuring that transaction covenants are honored, his functions include supervise the asset manager trading, distribute the cash among the investors and create and hand out deal surveillance reports. The rating agencies assign credit ratings to the CDO tranches based on their perceived levels of risk. The credit enhancer receives a fee and his role is to insure that senior classes of CDO securities no incur in losses. An investment bank represents a multidimensional and crucial role to the creation, but not the ongoing operation, of a CDO (Bond Market Association; 2004). It is often, that the same bank will serve as deal arranger, underwriter and placement agent. Finally, other vital piece of the transaction, the CDO investors. They are typically sophisticated institutional investors, such as insurance companies, banks, pension funds or hedge funds.1
CDO is a broad term that includes several different types of products and can be categorized in several ways according with its source of value, collaterals, purpose and risk exposition. Cash Flow CDOs concentrate primarily on managing the credit quality of the underlying portfolio since its performance is mainly tied to the credit performance of the underlying portfolio. Contrary to cash flow CDOs where the principal risk is of credit, for a Market value CDO the risk is the price. Market value CDO structures are rated based on market value of the collaterals, where current collateral market price and price fluctuations are the key performance drivers.
According to how a CDO is exposed to Credit risk, it could be classified into Cash CDO or Synthetic CDO. If the SPV obtains the credit risk exposure by purchasing debt obligations, the CDO is known as Cash CDO. As an alternative, if the SPV does not own the debt obligations and obtains the credit risk exposure by selling Credit Default Swaps2 (CDSs), the CDO is referred as Synthetic CDO (Lucas et al; 2007). In
1 According to Lehman Brother’s estimates, of November 13, 2007, the biggest holders of
AAA-rated CDO tranches included bond insurers, insurance companies, CDO commercial paper, structured investment vehicles (SIV), asset-backed commercial paper conduits (ABCP), and investment banks.
2 CDSs are essentially insurance contracts protecting against default of specific asset-backed
8
turn, the SPV transfer the credit risk to investors via the tranches it issues. In a synthetic CDO there is no physical transfer of any asset, the CDS seller receives a periodic premium payment and have the obligation of cover the possible credit losses (of the CDS purchaser) (Kaminker;2003). Hybrid CDOs are a middle way instrument between cash CDOs and synthetic CDOs including both types of assets.
Mitchell (2004) argues that tranching only creates value in the presence of market imperfections, such as asymmetric information and adverse selection. In the same line of thought Hongwen et al (2010) say that the costs of constructing and marketing a CDO would inhibit its creation. However, in practice, the markets are imperfect. In light of these imperfections were born two issuance purposes for CDOs: spread arbitrage and balance sheet management. (Figure A.1)
Banks and other financial institutions have regulatory capital requirements that have to accomplish. Basel I required that banks with international presence should hold capital of at least 8% of the risk-weighted assets.3 Afterward, Basel II modified this slightly by imposing different charges based on the riskiness of the asset, often
determined by the assets’ credit ratings.4 (Garcia et al; 2008) These capital requirements and the lack of liquidity of individual assets bring the need for banks securitize or sell some portion of their assets. The balance-sheet CDO, typically in the form of a CLO, is designedto financial institutions achieve a capital relief by removing assets from their balance sheets, thereby it allows free up cash and perhaps also increasing the valuation of the assets through the securitization (Bluhm; 2003) (Criado & van Rixtel; 2008). Arbitrages CDO, on the other hand, seek to capture the positive difference between the total cost of acquiring the collateral assets in the secondary market and the value obtained in the commercialization of the CDO.
3.2 Role of CDOs in the Financial Crisis – Their Problems and Advantages
Despite the existence of some earlier reports, it is generally believed that CDOs were created in 1987 by bankers of the now defunct American investment bank Drexel Burnham Lambert Inc.
3Note that home country sovereign bonds carried a risk weight of zero.
9
By the late 1990s the market of CDOs started its expansion. The CDO technique already has been understood and was well implemented in the market (Hongwen Du et al; 2010). Its issuance volume was rising exponentially and more and more asset classes were being used to construct the collateral pool. Furthermore the concept of the CDOs was also popularized across Europe (Hyder; 2002). (Figure A.2)
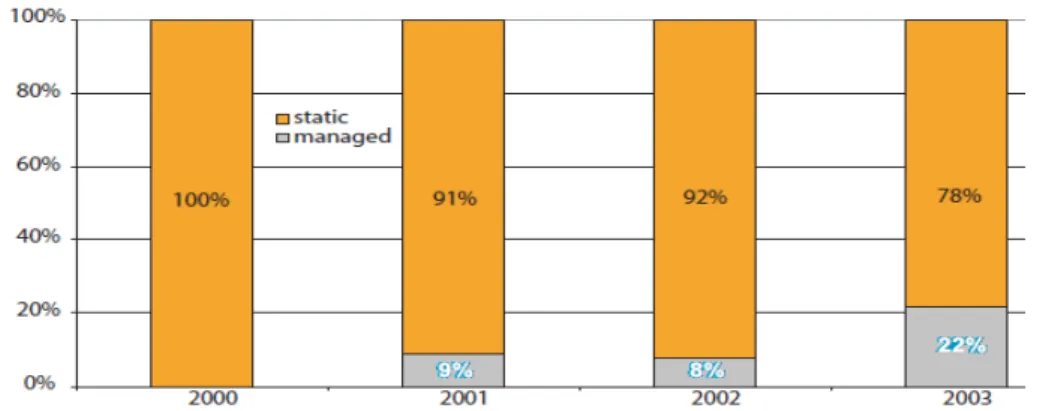
The original CDOs had mostly static underlying pools; however the growing maturity of the CDO market and the increasing number of managers with proven experience leaded to a transition to the managed CDOs.
The Commodity Futures Modernization Act decreed that products offered by banking institutions could not be regulated as future contracts.5 It prevented CDOs from being regulated and lies on the root of America's failure in regulate the debt derivatives as well as it paved the way for an explosive growth in Synthetic CDO market. Thereafter, the volume of traditional Cashflow CDOs has been highly surpassed by Synthetic products (Moore; 2004).
5 It was signed, in 2000, with the purpose of solve a dispute between the Securities Exchange
Commission (SEC) and the Commodities Futures Trading Commission (CFTC). Nevertheless, the result was some overlap between the regulatory scope of both.
Figure 3. Proportion of managed synthetic CDOs to static synthetic CDOs, 2000-2003
10
It seemed that every player was benefiting from CDOs; banks could remove loans from their books and the correspondent credit risk through SPV. The rating agencies were making record profits, the collaterals managers collected fees and the institutional investors were attracted by the apparent safety of senior securities while others by the possibility of earn higher yields. (Barnett-Hart; 2009)
However the CDO market was not what it “promised”. The financial crisis of 2007-2010 has started from the US subprime mortgage financial crisis and CDOs played a decisive role to accentuate and spread it among the world. The existence of a SPV allowed the bank not to worry about whether it was repaid and as collateral managers looked for ways to earn higher yields, they began to be less restrictive in their risk analysis and grant high risk loans (Ferguson; 2010). The risky assets increased its quote in the collateral pool, concretely subprime residential mortgage-backed securities (RMBS), as opposed to corporate bonds (Barnett-Hart; 2009).
The next development was the repackaging of CDO tranches. Basically, it consists in CDOs backed by a pool of other CDO tranches.6 In the boom, it would be no problem while everyone is getting his payment, however in a default situation the damage is promptly spread along the CDO chain.
Additionally, the CDO market experienced some transformations with the arrival of synthetic CDOs. The use of CDS could give the same payoff profile as cash CDOs but did not require the same upfront funding (Financial Crisis Inquiry
6
They could be squared or even cubed and are also referred as .
Figure 4. Global Issuance of CDOs by motives, 1998-2003
11
Commission; 2010). Banks could transfer the credit risk of some assets even without its sale. On the other hand, gave CDO managers the freedom to securitize any asset without the need to locate, purchase, or own it, allowing a quicker issuance (Barnett-Hart; 2009). It came accentuate the asymmetric information between issuers and investors.
Unlike the world of insurance, in derivatives is possible to get insurance for an asset that is not possessed. Investors could take short positions and speculate on the expected performance of the asset. It produced potential conflicts for CDO collateral asset managers. They had to serve the interests of long investors, who were betting that mortgage borrowers would continue to make their payments against the short investors who were betting the housing market would collapse.
Synthetic CDOs also enabled pursue more complex trading strategies, like capital structure arbitrages. Investors tried to take advantage of the “apparent” general mispricing of risk observed in the CDO market. Coval et al (2009), Krahnen & Wilde (2009) and Hamerle et al (2009), among others, show that equity tranches was undervalued due to systematic risks, not captured by traditional ratings. Investors took long positions in equity tranches and at the same time were assuming short positions in mezzanine and senior tranches. An example was the investment strategy of the hedge funds Paulson & Co. and Magnetar, which apparently consisted in the construction of the collateral pool with riskier assets in a way that they could bet that some portions of their own deals would fail7 8 (Malhmann; 2013).Obviously, they did not have a great incentive to monitor the credit risk of the underlying portfolio.
The rating agencies role is to assign individual asset credit ratings according to the expected probability of default and loss rate. However, in a CDO there are no assets specifically referring to a unique tranche but rather all assets as the entire collateral asset pool becoming their task more complex. Rating agencies were paid by the investments banks, being an interested part in that it did not lose its vigour, therefore their lack of
7 Paulson & Co. Inc. had profited billions with the burst of the bubble in the US mortgage
market by betting against synthetic collateralized debt obligations (CDOs).
8 Magnetar Capital was actively involved in the collateralized debt obligation (CDO) market;
12
independence and regulation led to some facilitation in the assignment ratings (Partnoy; 2006); (Hill; 2004); (Ferguson; 2010).
Moreover, with the quality of collateral pools declining and the growing of CDOs issuance, the rating agencies came under enormous pressure to quickly decide CDO ratings and failed to recognize the amount of risk inherent in these products.
Source: Securities Industry and Financial Markets Association (SIFMA)
The CDOs credit analysis became based almost completely on automated models, with very little human intervention and incentives to check the accuracy of the ratings assigned. (Barnett-Hart; 2009)
The introduction of a formula named Gaussian Copula as an industry standard to price CDOs allowed its easier pricing and also contributed to CDOs explosive issuance. But the complex mathematic models that were supposed to protect investors against risk, were not working. The formula has a poor representation of extreme events and was misunderstood by the analysts. David X. Li, the creator of the Gaussian formula, even stated about his formula to The Wall Street Journal in 2005 that "very few people understand the essence of the model." (Salmon; 2009)
Still regarding CDOs rating, Griffin & Tang (2008) detect evidence of assumption errors, misleading inputs, and conflicts of interests affecting it. The same authors, Griffin & Tang (2012) conclude that a credit rating agency frequently made positive adjustments beyond its main model in order to enlarge AAA tranche sizes.
0,0 100.000,0 200.000,0 300.000,0 400.000,0 500.000,0 600.000,0
2000 2001 2002 2003 2004 2005 2006 2007 2008 2009 2010 2011 2012
13
Concluding it was the combination of market imperfections, irresponsible underwriting practices, absence of ethic, misaligned incentives, deregulation, flawed credit rating procedures, human excesses and the securitization opacity that spawned this financial monster.9 Following the burst of the bubble of housing market in the United States, losses in CDOs started spreading among the world. One failure in the web starts to drag down the rest of the system; companies only find out are involved when a company near itself has begun to collapse. It was difficult to stop the losses because the giant amount of money channeled to CDO market, its complexity and the proliferation of derivatives.
After the crisis, occurred a natural “freeze” in CDO market with its issuance sharply declining. Nowadays, it already verifies a shy recuperation (see Figure 5).
However, CDOs also offer many advantages. The diversification of assets and tranches they offer and the ability to increase some assets liquidity were essential to their explosive growing. The next table concentrates the main CDOs disadvantages and advantages, with special focus on the advantages.
9 Everyone involved only was interested in maximize its profit independently of the
14
Source: Own Elaboration
Table I. Summary of main CDO Problems and Advantages
CDOs
Problems Advantages
Asymmetric Information Facility to lead with non-standard assets.
Opacity of assets Ability to customize a security in a way that fits the investor risk-reward profile.
Balance-Sheet Purposes
CDOs could own a large range of tranches. They could provide very attractive yields as well as an extreme secure investment.
Rating Complexity Capacity to attract large flows of capital in a short period of time.
Wrong incentives\Speculation
Via a single investment, offer investors the diversification among a wide number of assets.
Construction, Issuing and Managing Costs
CDOs allow banks to get liquidity. They could sell off some assets, otherwise non-tradable, freeing up capital to invest or loan.
15
4. CDOs Case Studies
In this section are presented three possible applications: (i)European Safe Bonds (ESBs), (ii)Biomedical research programs and (iii)Microcredit.
CDOs have played a central role in the recent financial crisis, nonetheless, with the right incentives and financial structure, tremendous amounts of capital can be gathered in a relatively short period of time. Although, the financial crisis, led to a backlash of skepticism here we present three possible positive applications of such structures to overcome existing financial problems.
The main aim of these case studies are to show that rather than, stay away from such techniques, a more sensible response is to acknowledge CDOs strengths and address their weaknesses, using them wisely and responsibly.
4.1 European Safe Bonds (ESBs)
4.1.1 Existent Problem
Even if the 2007-2010 financial crisis was not European in nature, the slow economic growth of some euro area countries, its financial and external imbalances and the lack of a banking and fiscal union, dragged them for it. (Lane; 2012)
The Eurozone is currently dipped in a Sovereign Debt Crisis. The European' Stability and Growth Pact set limits on the size of annual budget deficits at 3 percent of Gross Domestic Product (GDP) and a total public debt of 60 percent of GDP, however it was not accomplished by many countries. (Table A.I and Table A.II)
16
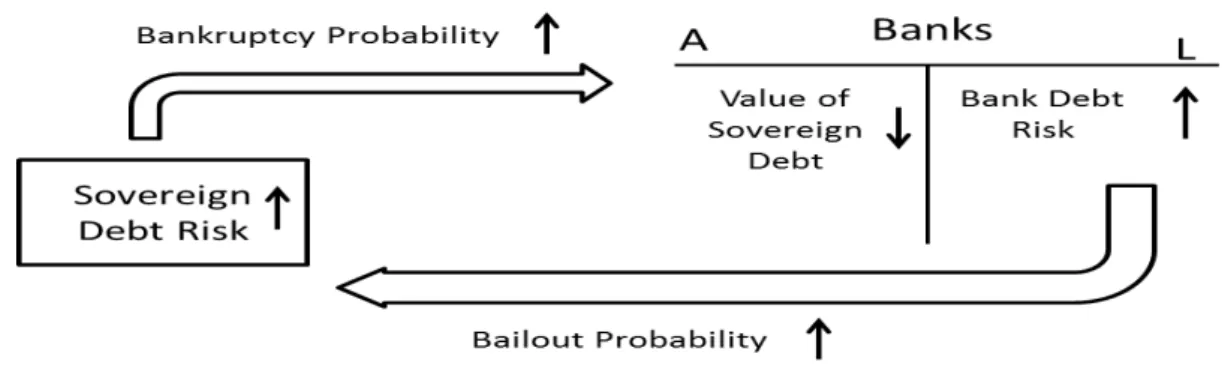
Source: Own Elaboration
Investors started to doubt if peripheral sovereign states will be bailed out or not, at the same time, they also started to speculate on the solvency of their banks. Sovereigns in turn, face a constant risk of having to rescue their banks, also get a risk increase in their bonds. It led their sovereign debt risk and their banking solvency risk entering to a diabolic loop. Greece was the first country to be shut out of the bond
market in May 2010, with Ireland following in November 2010, Portugal in April 2011 and already in 2013 Cyprus.
The explosive growth in the developing world during the last two decades and the recent strong volatility in financial markets have increased the demand for safe assets.10 They are an essential mechanism to smooth the income intertemporally. Households seek a non-risky way to transfer their buying power over time and to plan their future needs. Institutional investors, like pension funds, to accomplish their future responsibilities. The banks need them to make the link between their assets’ risk and their capital. On the other hand, they are essential to central banks conduct their monetary policies. (Farhi et al; 2011)
However, in spite of being home to one of the worlds' reserve currencies, Europe does not supply a safe asset that rivals U.S. Treasuries Bills. Moreover, the problem cannot be solved by national currency devaluation. The monetary union switches off this traditional adjustment mechanism. (Daniel & Shiamptanis; 2010)
10A safe asset should be liquid, has a minimal risk of default and be denominated in a stable purchasing power currency.
17
Source: Own Elaboration
4.1.2 Proposed Approach
Thereby, to solve the European sovereign debt problem, arise the European Safe Bonds (ESBs). The proposal is based in three basic premises, that European financial systems and states are caught in a diabolical loop, markets for Eurozone sovereign debt
are severely distorted, and the world lack of safe assets. The introduction of ESBs requires changes in bank regulation and the creation of an European Debt Agency (EDA) (Brunnermeier et al; 2011).
The main changes are that regulators should give a zero risk weight at ESBs, but not automatically to sovereign bonds. European Central Bank (ECB) would accept ESBs in its main operations. It still would hold sovereign bonds as assets, but now indirectly via the ESBs. EDA would buy sovereign debt of each country in the euro area, totalizing 60% of the Eurozone GDP. Each country would represent a fraction correspondent to its GDP average percentage, during the last five years, in total EZ GDP. The sovereign debts would be used as collaterals by the EDA to issue two securities: European safe bonds (ESBs) and European junior bonds (EJB). ESBs correspond to 70% of the total issued. The payment working mechanism is identical to a standard Collateralized Debt Obligation.
If the income from the pool is not enough to pay off the ESBs, the EDA would hold a reserve capital, similar at the existing European Financial Stability Facility (EFSF), to answer for the deficit. Concluding, any failure by a sovereign state to honor in full its debts would be absorbed first by the holders of the junior tranche security; ESBs only suffer losses when the EJB and the credit enhancement barrier are surpassed.
Figure 7. CDO proposed by Euro-nomics Group
18
Some benefits of the proposal stem from the introduction of ESBs, while others stem from changes in bank regulation and still others from the interaction of the two.
ESBs introduction and bank regulation changes would assign appropriate risk weights to sovereign bonds, eliminating the present mispricing of European sovereign bonds. ESBs would be liquid, as they would be issued in large volumes, and freely traded in the market.
They increase the supply of safe assets and provide Europe with a European-wide safe asset. If banks held such an asset, it would avoid the overexposure to national bonds. The contagion from sovereign bonds to banks would be greatly mitigated breaking the diabolical loop. If, in addition, there were a Europe-wide risky counterpart
to this asset (EJB), then the capital fleeing to safety across geographical regions, is replaced by a flight to safety across tranches (Shambaugh; 2012). This would stop the capital flows from the periphery to the center of Europe and their associated sovereign debt relative-price distortions.
ESBs also increase the "safe haven" premium that investors are willing to pay for safety and liquidity. Currently, it is mostly captured by Germany. ESBs would share it across countries that are as safe but not as liquid, like Austria, Finland, and the Netherlands, and with countries that are not safe at all, like Greece, Ireland, Portugal, Italy and Spain.
It appears there are two groups of correlated bonds inside the Eurozone (Diário Económico; 2013). The diversification arising from this bundling of sovereign bonds allows take advantage of its correlation. (Table A.III) Furthermore, it is important to refer that unlike the opacity of securitization in the financial crisis, in ESBs the collateral composition is totally clear and from public knowledge.
19
Concluding, ESBs are designed to minimize default risk and its main purpose is to create an European safe asset. The safety is provided by the EJB, the pooling and the credit enhancement.
ESBs proposal would not solve all the many problems of the European economies, but by breaking the diabolical loop and preventing sudden stops, it would go to the heart of what has driven the crisis of the last years. It would stop the sharp rise in periphery countries yields and allow that its competitiveness and public debts problems could then be dealt over time, allowing them to be more carefully thought. (Shambaugh; 2012)
4.1.3 Some Numerical Results
In order to attest the safety of ESBs, we realize some simulations. They have to recreate the dependency among the different EZ sovereign debts as well as the threat of contagion if a country defaults. Since the credibility of the simulations lies essentially in the capacity of the model to resemble the propagation of default, I started a research to find models that allowing me construct mechanisms to estimate dependent joint default probabilities.
Given that, this CDO is constituted by a considerable number of assets, heterogeneous both in weight and probability of default; it increases the difficulty to calculate the number of defaults as to identify which assets were to go into default. I also face others constraints to find a model: the high asset correlation, the high complexity of stochastic models, the almost absence of models addressing correlated defaults in monetary unions, its variables and computational skills requirements and my own statistical knowledge. Moreover, it is not known the default distributions limiting the use of jump intensity models and some copulas. Additionally, the lack of data about country defaults does not allow to test the model adaptation to the data.
20
a significant number of possible events that could occur. The first is an independent process and the remaining three are dependent processes.
To perform these simulations, it is necessary extract the euro-countries GDP to compute its weights in the CDO tranches. To obtain the default probabilities are used the euro-countries alphanumerical ratings and respective cumulative 10 years default rate. (Table A.IV and Table A.V) Lastly, in the absence of recovery rates for sovereigns states, it is adopted an analogous recovery rate, the moody’s rate for Non-Financial Corporate-Senior Secured bond, evaluated in 49.3%. (Figure A.3)
The first method passes by simulate random numbers that follow a uniform distribution (unif(0,1)), when the country default probability is lower than its respective number the country does not enter in default, if not the country enters in default. (Table A.VI)
To the last three ways, we utilize the 10 years CDS daily prices of EZ countries to estimate its correlation default. (Table A.VII and Figure A.4) The first dependent process consisted in generate correlated numbers to simulate possible correlated scenarios. It applies the same mechanism of default of the independent process. The generated numbers were modeled by the default correlation matrix and this process could be observed in annex step by step. (Table A.VIII) These numbers are similar at the independent process numbers however, as expected, its standard deviation is lower than in the uniform distribution. (14,79% vs 28,87%)
The last two processes follow two previous procedures: Ali-Mikhail-Haq copula and Davis-Lo's Contagion Model. Davis & Lo (2001), introduced to the credit risk field the contagion models, where the assets may default either directly or indirectly, infected by other asset default. Ali et al (1978) created a Copula that approaches the joint probabilities of correlated events given the marginal probabilities.
21
default probability it was necessary assume the average default correlation value as standard to the "A" and "B" correlation. The correlation is impossible of be measured when there are more than one independent default. It results that the lower the probability of independent defaults and it occurs, the greater the new default probabilities. In the third and last dependent process, is used the Davis & Lo's (2001) contagion model with a slight modification. The model is used to recreate a possible domino or chain reaction effect. For the assets in question did not make sense the default of a country directly imply the default of another neither all the assets have the same contagion effect. Consequently, in our simulation, the country contagion link only is activated when its CDS prices and its yields have a positive correlation and instead take simply values of a Bernoulli Random variable, it will take the default correlation. (Figure A.6 and A.7)
However, these two processes have the limitation of being one step model, since they depend on past events. That is, just give us the probability of default to a certain period and if the infection is not stopped suddenly, it will most likely lead to default of all countries and have to be made more steps. (Figure A.8)
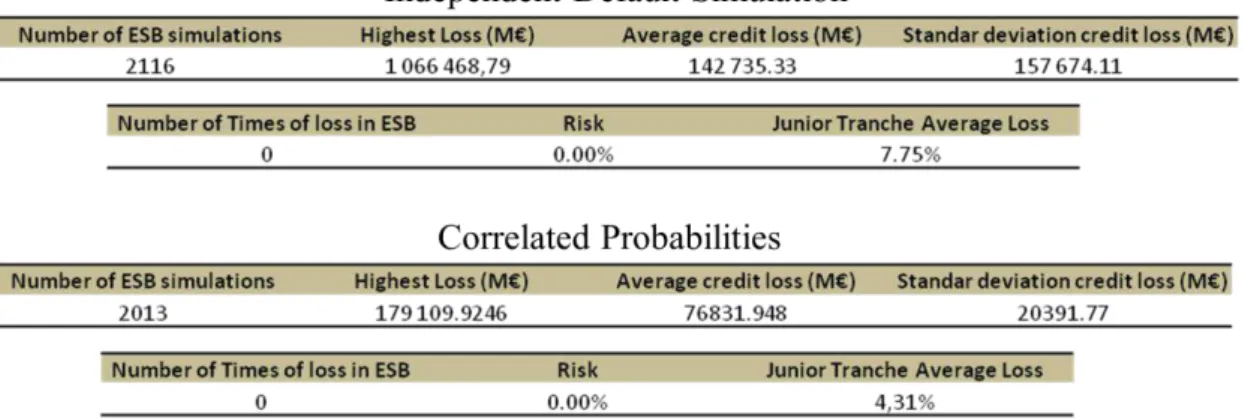
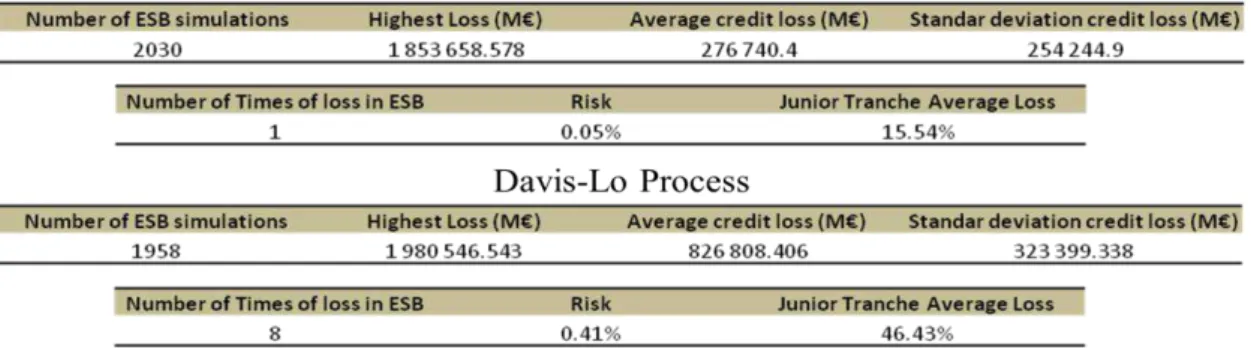
In sum, each one of these processes had around 2000 simulation, totalizing millions of possible cases, once the final results are obtained by a vast path of combinations. There were only 9 cases in that the ESB did not reveal safe and these cases could be solved by the credit enhancement. The EJB average loss was from 4.31% to 46.43%.
22
Comparing with the Eurobonds, the alternative proposal more known, ESBs also gain advantage. Briefly the Eurobonds proposal involves joint and several liabilities by all member states of the Eurozone and replaces their sovereign bonds. Consequently, all member states will face the same interest rate and each one have to be ready to step in with extra payments if other members fail to do so. Unlike Eurobonds, ESBs can be implemented under existing European treaties and would not require more fiscal integration than already in place. They are easier to implement or to undo in case of failure, there is no common bailout structure and thus do not distort the incentives of individual member states. Also contrasting with the Eurobonds, ESBs provide market discipline and avoid free rider problems. Countries continue to get signs from the market, given that, always a country' public debt surpass approximately 60% of its GDP, it would need to get financing in the markets (Brunnermeier et al; 2012).
Table II. Comparison: ESB Vs Eurobonds
Comparison Points ESB Eurobonds
Diabolic Loop Broken Broken if Eurobonds are safe Safe Asset Large Unknown, but less safe Flight to Safety Redirected Inexistent Market discipline Yes Inexistent Launch Time Next month Years
Flexibility Large Require a deep fiscal union In Case of Failure Easy to undo Difficult to undo Hidden transfers Inexistent Yes
Source: Own Elaboration
23 4.2 Drug Research
4.2.1 Existent Problem
The pharmaceutical industry, at heart, dedicates to develop, produce, and apply new drugs to improve human health. This challenge involves thousands of organizations, since small medical device start-ups to giant biotechnology firms and from private research institutes to great universities.
However there is a big cultural gap between scientific research and commercial enterprise. In science, the success is achieved by peer review and measured in reputation, while in business score is kept by capital markets and measured by the profitability (Pisano; 2010). Moreover, since people's lives are a sensible issue, the industry also deals with conflicting non-pecuniary motivations and public-policy implications.
The introduction of a new drug development is a time-consuming, complex, sequential and a highly regulated process. Countries typically have national agencies responsible for authorizing new compounds for sale and to protect the intellectual property.
Normally, in the U.S, the lifecycle of a new drug development follows the path described below (Dimasi et al; 1991) (Dimasi et al; 2003). In the “Preclinical Phase” the
company develop the drug tests in animal trials, until to permit the compound to proceed to human studies. Following this phase, the sponsoring company files an
“Investigational New Drug” (IND) application. If the U.S. Federal Drug Administration (FDA) approves it, the drug moves into Phase I. Here the drug is tested in a small number of healthy volunteers to establish safe dosages and to gather information of body reactions. If the drug is determined to be too toxic or otherwise unfit, it is withdrawn.
24
diseased patients. Following the successful completion of Phase II, the drug moves into the final pre-approval clinical testing phase, Phase III. At this stage the drug is tested in a large sample of patients to uncover side-effects that occur infrequently. Once drug developers believe that they have enough evidence of safety and efficacy, they submit an application at the regulatory authorities to the drug can enter legally in the market. At the end of each phase, the pharmaceutical firm reviews the status of a drug research and make a decision on whether to continue with its development.
Figure 9. New Drug Aplication(NDA) Review Process
The average time since the synthesis to the approval of a new drug application (NDA) has increased significantly, from an average 7.9 years in the 1960s to 12.8 years in the 1990s (Dickson and Gagnon; 2004). Much of the increase is due to the enlargement of the clinical phase. Dickson and Gagnon (2004) attributed it to a variety of factors: the increase in regulatory requirements, the nature of the diseases investigated, the need of more studies and the increasing difficulty of recruiting patients for clinical trials.
According with the review of Morgan et al (2011) and the paper of Dimasi et al (2003), the costs of developing a new drug have been increasing. Dimasi et al (2003) find that even when the results are compared with an earlier study with a similar methodology, the total capitalized costs revealed an increase at the annual rate of 7.4% above general price inflation. Moreover, the same study concludes that the drug development and clinical costs are quite discrepant depending on the area of disease.
Some researchers used processes methodologically strong and have been widely cited in future studies as Hansen & Chien (1979) and Dimasi et al (1991). However, despite three decades of research in this area, no published estimate to the cost of developing a new drug can be considered a gold standard. The fact that the data is kept
25
Source: Own Elaboration
in secret by the big pharmaceuticals becomes very difficult to assess validity and reliability of the studies.
By other side, the project mean returns and the cost of capital for New Chemical Entities (NCES), since 1970 to 1994, also had been increasing (Grabowski et al; 2002). (Table A.IX) The distribution of sales revenues for new drug compounds is described as highly skewed. Grabowski and Vernon (2000a), for NCES introduced between 1988 and 1992, concluded that the top 10% of drugs accounts for more than half of the overall sales generated. The same authors, in other publication, to drugs introduced between 1990 and 1995 estimate the effective patent life in 11.7 years (Grabowski & Vernon; 2000b). Nowadays, the normal patent period is 20 years in the European Union.
Moreover, the current business model for life sciences research and development is flawed and the productivity of big pharmaceutical companies has been declining in last years.11 Concluding, the industry presents some characteristics that potentiate the use of new financing techniques. Biomedical research is complex, expensive, very uncertain, lengthy, and there is a big time lag between capital commitment and return.
4.2.2 Proposed Aproach
Fagnan et al (2013) proposed a new industry funding model that uses financial engineering techniques, similar to CDOs, to raise large amounts of capital. The money is used by a single Megafund to finance a well-diversified portfolio of biomedical research programs. The issued debt is named Research Backed Obligation (RBOs) and is collateralized by this portfolio of assets.
11See the recent studies of Paul et al (2010) and Pisano (2010).
26
The collateralized assets include the initial capital raised from investors and the entire subsequent biomedical R&D acquired, licensed from external entities or created internally. Afterwards, all the profits generated by these activities or through sales of these assets in later periods are distributed by its different tranches, with the appropriate repayment hierarchy. A single entity investing in many diverse programs allow take advantage of the benefits of diversification, increasing the research' likelihood of success and consequently the risk/reward relation.
As CDOs, RBOs also possess its same advantages, but RBOs have a special attribute. RBOs work as a natural hedge to big investors such as Pension Funds or Insurance Companies. Moreover, RBOs are inserted in the group of Social responsible investments (SRI). They could capture investments of companies that want support socially relevant activities but are forbidden of investing in equity. (Fagnan et al; 2013)
Fagnan et al (2013) also believe that this business model eliminates some fixed costs and brings more operating efficiency. The gains are achieved not only through the usual economies of scale, but also through: the ability to allocate capital efficiently, the possibility of redeploy researchers onto more productive projects, and the abandon of less promising projects sooner.
Additionally, RBOs also eliminate existents short-term business pressures. They extend the investment horizon and reduce the financing risk for the programs in its portfolio. By last, but not less important, RBOs could come to create a Social Value invaluable. The American Cancer Society, only for U.S., estimate the new cancer cases to 2013 in 1 660 290 and the number of deaths approximately 600 000. And the cancer is just one of many diseases that affect society.
4.2.3 Illustration
Now, it is presented an example, based in the work of Fagnan et al (2013), of how a CDO could be used to potentiate the pharmaceutical industry.
27
revenues. Subsequently, there is an 11 years period to collect the return where is generated 1.5 Billion Euros per year.
Additionally, it is assumed that the project only have two possibilities, the possibility of a drug being developed with or without success, therefore the project has a zero recovery rate. I used 10% as the likelihood of success and consequently 90% to be an unsuccessful project. As a result, the return only can be evaluated to a 12 years analysis, which is when really is perceived if a drug can be inserted in the market. To an isolated project, the return follows a Bernoulli Random variable presenting a performance of around 4693% with chances of 10 % or of -100% to the remaining 90 % of the times. (Figure A.9)
The low chance of success of a standard drug research project and the unpredictability of sales once a product is marketed create a risky business environment. It leads investors to move away from the drug research financing as an investment opportunity, even if the expected rate of return may be attractive. However if we repackage a considerable number of projects of a drug research, the hypothesis of these portfolio offer a positive return enlarge. For example with 100 projects, the probability is approximately 99% and this problem is strongly mitigated. Moreover, to one isolated project the expected Internal Rate of Return (IRR) is 13.95% and the standard deviation is 417.16%. Nevertheless, if are developed 100 projects at the same time the expected IRR does not change, while the standard deviation decrease to 41.72%. (Figure A.10, A.11 and Table A.X)
To this illustration was assumed a cost of capital of 12 % and, as simplification, no correlation between the chances of success in drug research. The dependence affects the return' standard deviation but this assumption is not critical for the main purposes of
Source: Own Elaboration
28
the example. However, in a more specific real-world application, the success dependency among projects has to be taken in account.
In Summary, the high amount needed to finance new researches, and its high probability of failure challenge the traditional funding vehicles, which are limited in size, scope, and risk appetite. Consequently, Investors, that are risk averse, move away. As a result, many projects are not financed. However, CDOs could invert this situation and help biomedical research to obtain a bigger scale.
4.3. MicroCredit
4.3.1 Existent Problem
Microfinance deals with a large provision of financial services. Microcredit is its most developed sub-discipline. According with United Nations, microcredit can be defined as the sustainable supply of small-scale financial services such as credit, savings accounts, and insurance to poor and low-income people (United Nations; 2005).
Microcredit has the power of change the lives of people and revitalizing communities worldwide. For example, a 100€ loan is “peanuts” in the developed world, but to someone living with one euro per day, that amount could allow them to open its own business and strengthening the local economies.
There is a huge demand for these services. In developing countries, governments and philanthropy aid are not capable of meeting the demand. According to the World Bank, only 4 per cent of worldwide demand for microfinance loans was being met in 2005 and there was around three billion people seeking access to basic financial services in 2006 (World Bank; 2006) (Wardle; 2005). The expected explosive growing of world population will surely still make these numbers grow. It is expected that the microcredit market grows at 15% per year (Wine; 2005).
29
borrower in the developing world, typically, values more the access to a credit than a corresponding people in the developed world. Also, in proportional ways, he can generate much higher returns on his assets. Consequently, it means that many of these
developing world’ borrowers can afford to pay higher interest rates for its capital access. (Byström; 2008)
Other potentiality is that the returns from microloans are largely uncorrelated with returns from most other asset classes. Krauss & Walter (2008) present some early evidence supporting that its inclusion in global portfolios reduces overall portfolio volatility. Galema et al (2011) using mean-variance spanning tests, confirm that investing in microfinance may be attractive for investors who seek a better risk-return profile. Furthermore, since diversification is the only true free lunch in the financial world, an asset class that is largely uncorrelated with the major economic and political events in the world will attract the interest of rational investors.
The investments in microcredit give private investors the chance to do well (financial scale) by doing good (social scale), being a Social responsible investment (SRI). The SRI is especially in vogue in the most developed countries, both for companies and for governments, which are concerned with their communities or by the way are looked by their communities. (Galema & Lensink; 2009)
Nowadays, the developed world is more informed how microfinance works in developing world. However, to the massive microfinance commercialization could move forward still there are numerous hurdles that need to be overcome.
The first step is to transform non-governmental organizations into regulated banks/financial institutions run by professionals (Byström; 2008). Additionally the macro policy and government regulation have to be adapted to accommodate commercial microcredit.
30
The microcredit market is big enough and non-commercial players simply do not have enough capital to satisfy the demand. However, there is evidence of subsidized lending crowding out commercial viable lending. Donors and investors have important and complementary roles (World Bank; 2002a). Byström (2008) and de Sousa-Shields & Frankiewicz (2004) argue that the principal task of donors should be to support institutions with the aim of become microfinance securitization more efficient. Subsequently, they have to identify and redirect their funds to the riskiest MFIs, leaving the viable lenders to commercial investors.
Furthermore, microfinance is often perceived as different from conventional finance. The nonexistence of MFIs historical defaults by the rating agencies to support a
precise estimation of their credit risk, as well as the borrowers’ lack of collateral become microcredit a riskier way of investing.
To sum up, Microcredit industry leads, essentially, with these main problems: the role of donors and governments and how to satisfy the escalating microcredit demand in a way that the microcredit could be commercially viable.
4.3.2 Proposed Approach
The arrival on the scene of financial markets/sector is probably the only way to reach the billions of people in the world who need finance at reasonable terms but have no access to it. CDOs have single characteristics that differentiate them from other securities. Henceforward, the focus is on how this particular tool from the world of structured finance could potentially speed up the commercialization of microfinance.
Microcredit CDOs (MiCDOs), like other CDOs, are funds that pool and repackage assets, dividing the credit risk among different tranches. The only difference is that the underlying pool is composed by microcredit loans.
31
CDOs have the ability to attract big flows of capital to satisfy the increasing microcredit demand. Furthermore, microcredit is propitious to the development of CDOs. Since, there is an unlimited source of potential assets that, can be pooled together, securitized, and sold to investors all around the world.
Microcredit faces a very different reality depending on the country or region. It is a point in favour of CDOs, since they are able to lead with standard and non-rated assets.
The CDOs tranching mechanism allows overcome some flaws in microcredit business, such as the information asymmetries, which are particularly relevant. The protection provided by the tranches help to combat the distrust of investors less informed. The tranching mechanism also allows to attract a large panoply of investors. The safest tranches could be used by investors that normally would never consider, or would not be authorized, investing in an emerging market and even less in rural areas (Byström; 2007). Then, by other side, CDOs equity tranche can be seen as an alternative to real equity (Byström; 2008). The weak corporate governance and the absence of stock markets in many developing countries, leads us to a shortage of equity.
At last, MiCDOs via a single investment are able to diversify its underlying pool among a large number of credits and geographical regions, mitigating the risk of default.
4.3.3 Illustration
Now, a hypothetical, but realistic, example is used to point some of these advantages and to attest its viability. Suppose a microcredit CDO that holds a portfolio of 10.000 microloans, each with a nominal amount of average 1.000 €. The loans have a six years maturity and should be repaid at the maturity. The maturity of our MiCDO is not critical for this discussion, however it is in line with microcredit’ short-term loans.12 The interest rates in microcredit could assume a large range of values according with the countries (20-80%) (Byström; 2008), for this example, we use 30%. The currency risk could be very volatile and is dependent of the weight of country currencies
32
Source: Own Elaboration
in the underlying pool. In this example is used a depreciation of 5%. Taking into account which microcredit is a risky investment, it is assumed a 12 % to the cost of capital.
The administrative costs are assumed in 20% of the loan portfolio, following the World Bank (2002b) estimation that they lie in the 10-25% range, and conservatively are paid at the beginning of the loan. The CDO loans are independent of each other and have an average conservative default rate of 5%, once average default rates were reported in the range 1-5% (Byström; 2008). As in the Drug Research' case, this assumption of independence is not limitative for the MiCDO advantages. However, in a more specific real-world case the default dependency has to be studied since it affects the return' standard deviation. To finalize the assumptions, it is assumed that all the loans have zero recovery rates, that is, if a borrower defaults, he has no collateral as guarantee to repay at the lender.
Consequently the return of an isolated loan, as for the drug research example, follows a Bernoulli distribution. Six years after, its return is 122.67% or all the funds are lost (-100%) if the borrower defaults. (Figure A.12)
However, as predicted, if we repackage a considerable number of loans, in this example, 10.000, the hypothesis of a lender to obtain a positive return enlarges to almost 100%. Nevertheless, the return only is higher than the cost of capital (12%) when the number of successful loans exceeds 8900. Moreover the pooling allows reduce the standard deviation 100 times (√ ). These fantastic results are achieved thanks to the independence of the collateral assets but are demonstrative of CDOs pooling potentialities. The IRR is expected to be 13.30% and each euro allocated generates a Net Present Value (NPV) of 4.69 cents. (Figure A.10, A.13 and Table A.XI)
33
34
5. Conclusions and Limitations
This dissertation aims to understand and explain the contribution of CDOs to the Financial Crisis of 2007-2010, identifying its main strengths and weaknesses. Afterward, it pretend perceive if its potentialities could be exploited without bring the curses shown previously.
To this end, were pointed, studied and deepened some possible CDOs applications. These applications could be untested; however the securitizations techniques are not and had given evidence of its capacity and attractiveness during the run-up to the financial crisis. Nevertheless these solutions still need to mature, to be studied deeper and some political will, given that with exception of microcredit they still remain on the paper.
ESBs and European Sovereign Debt need a change of mindset of European leaders and join the different wills and interests to end up with the existing lobbies, becoming Europe still more united.
In the biomedical research, still is necessary to solve legal issues and change mentalities to an active scientific collaboration. Subsequently, this project can go forward and seriously expand the current scale of biomedical innovation in a sustainable and profitable way.
The area of securitizing microloans is in its infancy and when someone wants to develop a future MiCDOs there are a number of issues, referred previously, that deserve to be raised.
35
During the research, I realized that in the post-crisis stopped to consider CDOs as a mechanism to use, falling into disuse. I also stated a tendency of CDOs applications' post-crisis studies rename it using new terms as for example ESBs or RBOs, hindering my search for applications. Barnett-Hart (2009) even said "the CDO may be unequivocally dead". On the other hand, the work does not let into oblivion a product that has several potentialities because of the crisis. Structured finance and CDOs had, have and still could carry on a crucial role on economic growth.
36
Bibliography
Ali M. M., Mikhail N. N. & Haq M.S. (1978). A Class of Bivariate Distributions Including the Bivariate Logistic. Journal of Mulvariate Analysis8, 405–412
Barnett-Hart, A.K. (2009). The Story of the CDO Market Meltdown: an Empirical Analysis, B.A.Thesis, Economics Department, Harvard University
Benmelech, E. & Dlugosz, J. (2008). The Alchemy of CDO Credit Ratings, Working paper, Harvard University
Byström, H. (2007). Structured Microfinance in China, Working paper, Lund University
(Byström, H. (2008). The Microfinance Collateralized Debt Obligation-A Modern Robin hood. World Development36 (11), 2109–2126
Bluhm, C. (2003). CDO modelling: techniques, examples and applications, Hypo Vereinsbank, Structured Finance Analytics
Bond Market Association. (2004). CDO Primer. Available in: http://www.public.asu.edu/~chliu1/recapmarkets_dese/readings/16_CDO_Primer_Bond MarketAssn.pdf. [Accessed in: 15/03/2013]
Brunnermeier, M. K., Garicano, L., Lane, P. R., Pagano, M., Reis, R., Santos, T., Van Nieuwerburgh, S. & Vayanos, D. (2011). European safe bonds: ESBies, Euro-nomics.com
Brunnermeier, M. K., Garicano, L., Lane, P. R., Pagano, M., Reis, R., Santos, T., Van Nieuwerburgh, S. & Vayanos, D. (2012). Alternatives to Eurobonds, Euro-nomics.com
Criado, S. & Van Rixtel, A. (2008). Structured finance and the financial turmoil of 2007-2008: An introductory overview, Banco de España Documentos Ocasionales no 0808
37
Daniel, B. C. & Shiamptanis, C. (2010). Sovereign default risk in a monetary union, Working Papers 2010-3, Central Bank of Cyprus
Davis, M. & Lo, V. (2001). Infectious defaults. Quantitative Finance1, 382–386
De Sousa-Shields, M., & Frankiewicz, C., (2004). Financing microfinance institutions: The context for transitions to private capital, Accelerated Microenterprise Advancement Project, microREPORT #8
Diário Económico. (2013). Dívida dos periféricos alivia; 'yield' alemã sobe, Economic Portuguese Newspaper (Date:29/04/13)
Dickson, M. & Gagnon, J. P. (2004). The Cost of New Drug Discovery and Development, Discovery Medicine4 (22), 172-179
DiMasi, J.A., Hansen, R.W., Grabowski, H.G. & Lasagna, L. (1991). Cost of innovation in the pharmaceutical industry, Journal of Health Economics10, 107–142
DiMasi, J.A., Hansen, R.W. & Grabowski, H.G. (2003). The Price of Innovation: New Estimates of Drug Development Costs, Journal of Health Economics22 (2), 151–185
Duff & Phelps (2008). CDO Primer. Available in:
http://www.duffandphelps.com/SiteCollectionDocuments/DP_CDO_Primer.pdf
[Accessed in: 2013/03/19]
Eaglesham, J., (2012). SEC probes role of hedge fund in CDOs, The Wall Street Journal, May 17, 2012.
Fagnan D., Fernandez J.M., Stein R. M. & Lo A. W. (2013). Can financial engineering cure cancer? American Economic Review 103(3), 406-411
Farhi, Emmanuel, Gourinchas, P. & Rey H. (2011). Reforming the International Monetary System, Working paper, University of California, Berkeley