Socioeconomic status and the 25 × 25 risk factors as
determinants of premature mortality: a multicohort study
and meta-analysis of 1·7 million men and women
Silvia Stringhini*, Cristian Carmeli*, Markus Jokela*, Mauricio Avendaño*, Peter Muennig, Florence Guida, Fulvio Ricceri, Angelo d’Errico, Henrique Barros, Murielle Bochud, Marc Chadeau-Hyam, Françoise Clavel-Chapelon, Giuseppe Costa, Cyrille Delpierre, Silvia Fraga, Marcel Goldberg, Graham G Giles, Vittorio Krogh,Michelle Kelly-Irving, Richard Layte, Aurélie M Lasserre, Michael G Marmot, Martin Preisig, Martin J Shipley, Peter Vollenweider, Marie Zins, Ichiro Kawachi, Andrew Steptoe, Johan P Mackenbach, Paolo Vineis†,Mika Kivimäki†, for the LIFEPATH consortium‡
Summary
Background In 2011, WHO member states signed up to the 25 × 25 initiative, a plan to cut mortality due to non-communicable diseases by 25% by 2025. However, socioeconomic factors infl uencing non-non-communicable diseases have not been included in the plan. In this study, we aimed to compare the contribution of socioeconomic status to mortality and years-of-life-lost with that of the 25 × 25 conventional risk factors.
Methods We did a multicohort study and meta-analysis with individual-level data from 48 independent prospective cohort studies with information about socioeconomic status, indexed by occupational position, 25 × 25 risk factors (high alcohol intake, physical inactivity, current smoking, hypertension, diabetes, and obesity), and mortality, for a total population of 1 751 479 (54% women) from seven high-income WHO member countries. We estimated the association of socioeconomic status and the 25 × 25 risk factors with all-cause mortality and cause-specifi c mortality by calculating minimally adjusted and mutually adjusted hazard ratios [HR] and 95% CIs. We also estimated the population attributable fraction and the years of life lost due to suboptimal risk factors.
Findings During 26·6 million person-years at risk (mean follow-up 13·3 years [SD 6·4 years]), 310 277 participants died. HR for the 25 × 25 risk factors and mortality varied between 1·04 (95% CI 0·98–1·11) for obesity in men and 2 ·17 (2·06–2·29) for current smoking in men. Participants with low socioeconomic status had greater mortality compared with those with high socioeconomic status (HR 1·42, 95% CI 1·38–1·45 for men; 1·34, 1·28–1·39 for women); this association remained signifi cant in mutually adjusted models that included the 25 × 25 factors (HR 1·26, 1·21–1·32, men and women combined). The population attributable fraction was highest for smoking, followed by physical inactivity then socioeconomic status. Low socioeconomic status was associated with a 2·1-year reduction in life expectancy between ages 40 and 85 years, the corresponding years-of-life-lost were 0·5 years for high alcohol intake, 0·7 years for obesity, 3·9 years for diabetes, 1·6 years for hypertension, 2·4 years for physical inactivity, and 4·8 years for current smoking.
Interpretation Socioeconomic circumstances, in addition to the 25 × 25 factors, should be targeted by local and global health strategies and health risk surveillance to reduce mortality.
Funding European Commission, Swiss State Secretariat for Education, Swiss National Science Foundation, the Medical Research Council, NordForsk, Portuguese Foundation for Science and Technology.
Copyright © The Author(s). Published by Elsevier Ltd. This is an Open Access article under the CC BY license.
Introduction
The 2013–20 World Health Organization (WHO) Global Action Plan for the Prevention and Control of Non-Communicable Diseases (NCDs) targets seven major risk factors, comprising the harmful use of alcohol, insuffi cient physical activity, current tobacco use, raised blood pressure, intake of salt or sodium, diabetes, and obesity (referred to as the 25 × 25 risk factors), with the overall aim of reducing premature mortality from non-communicable diseases by 25% by 2025.1 Similarly, the Global Burden of Disease (GBD) Collaboration, the largest study monitoring health changes globally, performs an annual risk assessment of the burden of
disease and injury attributable to 67 risk factors in 21 world-regions.2 Despite the fact that low socioeconomic status is one of the strongest predictors of morbidity and premature mortality worldwide,3–6 poor socioeconomic circumstances are not considered modifi able risk factors in these important global health strategies.
Socioeconomic circumstances and their consequences are modifi able by policies at the local, national, and international levels,7–9 as are risk factors targeted by existing global health strategies. Evidence also suggests that the burden of most 25 × 25 risk factors is concentrated in lower socioeconomic groups worldwide.10,11 Inter-ventions to reduce premature mortality attributable to
Published Online January 31, 2017 http://dx.doi.org/10.1016/ S0140-6736(16)32380-7 See Online/Comment http://dx.doi.org/10.1016/ S0140-6736(17)30191-5 *These authors contributed equally to this work †Joint last authors ‡Members are listed at end of paper
Institute of Social and Preventive Medicine and Departments of Psychiatry and Internal Medicine, Lausanne University Hospital, Lausanne, Switzerland (S Stringhini PhD, C Carmeli PhD, Prof M Bochud PhD, A M Lasserre MD, Prof M Preisig MD, Prof P Vollenweider MD); Institute of Behavioural Sciences, University of Helsinki, Helsinki, Finland
(M Jokela PhD); Department of
Global Health and Social Medicine, King’s College London, London, UK
(M Avendaño PhD); Harvard T H
Chan School of Public Health, Boston MA, USA (M Avendaño,
Prof I Kawachi PhD); Global
Research Analytics for Population Health, Health Policy and Management, Columbia University, New York, NY, USA
(Prof P Muennig MD); MRC-PHE
Centre for Environment and Health, School of Public Health, Department of Epidemiology and Biostatistics, Imperial College London, London, UK
(F Guida PhD, M Chadeau-Hyam PhD, Prof P Vineis PhD);
Epidemiology Unit, ASL TO3 Piedmont Region, Grugliasco, Italy (F Ricceri PhD,
A d’Errico MD);
EPIUnit–Institute of Public Health, University of Porto,
the 25 × 25 and other risk factors might therefore benefi t from greater focus on socioeconomic adversity so that the preventive toolkit for addressing NCDs can be expanded. To examine this hypothesis, we collated individual-level data from 48 independent prospective cohort studies from Europe, the USA, and Australia and aimed to determine the population attributable fraction (PAF) and years of life lost (YLLs) due to low socio-economic status and compared these with mortality and YLLs attributable to the 25 × 25 risk factors.
Methods
Study population
This study is part of an EC Horizon 2020 consortium, the Lifepath project, which includes ten cohort studies. We have complemented those data with publicly available data from 38 additional cohort studies from the Inter-University Consortium for Political and Social Research and the UK Data Service. Our analyses were based on participants whose occupational position was assessed at baseline between 1965 and 2009, dependent on the study (appendix). The 48 studies comprised a total population of 1 751 479 men and women from seven WHO member countries (UK, France, Switzerland, Portugal, Italy, USA, Australia). All studies included baseline data for socioeconomic status and a mortality follow-up of a minimum of 3 years. Each study was approved by the relevant local or national ethics committees and all participants gave informed consent to participate. We assessed the quality of included studies using the Cochrane Risk of Bias Tool for cohort studies.12 We analysed a selection of exposed and non-exposed groups, assessment of exposure, exclusion of the outcome of interest at study baseline, adjustment for con founding variables, assessment of confounding variables, assessment of outcome, and adequacy of the follow-up.
Two reviewers (SS and MK) independently assessed the studies. The quality of the study was judged as high if all domains were assessed favourably (appendix).
Defi nitions and data collection
Our measure of socioeconomic status is a social class measure based on an individual’s last known occupational title at study enrolment, coded into the European Socio-economic Classifi cation (ESEC). This variable was predefi ned and harmonised across the study cohorts before statistical analyses were done. Occupational position was categorised as high (higher professionals and managers, higher clerical, services, and sales workers [ESEC class 1, 2, and 3]), intermediate (small employers and self-employed, farmers, lower supervisors, and technicians [ESEC class 4, 5, and 6]), or low (lower clerical, services and sales workers, skilled workers, and semi-skilled and unskilled workers [ESEC class 7, 8, and 9]). For one study (E3N), occupational position was current occupation 2 years after baseline. We used ESEC as a classifi cation because it eliminates the need to adjust for diff erences in earnings and standards of living across diff erent national contexts. We used individual’s occupational class only because most cohorts did not collect information about partner’s occupation. This decision could have led to some misclassifi cation of socioeconomic status particularly for older women with low labour force participation rates.
Each 25 × 25 risk factor comprised two or three categories to allow a balanced comparison with socio-economic status, which was grouped into three categories (appendix). Self-reported smoking was categorised into current smoker, former smoker, and never smoked. Alcohol consumption was measured in alcohol units per week and participants were categorised as abstainers (0 units per week), moderate (1–21 units per week for
Porto, Portugal
(Prof H Barros PhD, S Fraga PhD);
Department of Clinical Epidemiology, Predictive Medicine and Public Health, University of Porto Medical School, Porto, Portugal
(Prof H Barros); Center for
Research in Epidemiology and Population Health, INSERM U1018, Villejuif, France
(F Clavel-Chapelon PhD);
Department of Biological and Clinical Sciences, Universtiy of Turin, Turin, Italy
(Prof G Costa MD); INSERM,
UMR1027, Toulouse, France
(C Delpierre PhD, M Kelly-Irving PhD); Université
Toulouse III Paul-Sabatier, UMR1027, Toulouse, France
(C Delpierre, M Kelly-Irving);
Population-based Epidemiological Cohorts Unit, INSERM UMS 11, Villejuif, France (Prof M Goldberg MD,
M Zins MD); Paris Descartes
University, Paris, France
(Prof M Goldberg, M Zins);
Cancer Epidemiology Centre, Cancer Council Victoria, Melbourne, VIC, Australia
(Prof G G Giles PhD);
Epidemiology and Prevention Unit, Fondazione IRCCS Istituto Nazionale dei Tumori, Milan, Italy (V Krogh MD); Department of Sociology, Trinity College Dublin, Dublin, Ireland
(R Layte PhD); University College
London, Department of Epidemiology and Public Health, London, UK
(Prof M G Marmot FRCP, M J Shipley MSc, Prof A Steptoe Dsc, Prof M Kivimäki PhD);
Department of Public Health, Erasmus University Medical Center, Rotterdam, Netherlands
(Prof J P Mackenbach PhD); and
Clinicum, Faculty of Medicine, University of Helsinki, Finland
(Prof M Kivimäki) Correspondence to: Dr Silvia Stringhini, Institute of Social and Preventive Medicine (IUMSP), Lausanne University Hospital, 10 Route de la Corniche, Lausanne 1010, Switzerland
silvia.stringhini@chuv.ch
See Online for appendix
Research in context
Evidence before this study
Low socioeconomic status is one of the strongest predictors of morbidity and premature mortality worldwide. However, global health strategies do not consider poor socioeconomic circumstances as modifi able risk factors. The WHO Global Action Plan for the Prevention and Control of Non-Communicable Diseases, for example, targets seven major health risk factors, including insuffi cient physical activity, current tobacco use. and raised blood pressure, for reducing premature mortality from non-communicable diseases by 25% by 2025. Low socioeconomic status is not included among the 25 × 25 risk factors.
Added value of this study
We used data from more than 1·7 million individuals in 48 independent cohort studies from seven countries, and found that the independent association between
socioeconomic status and mortality is comparable in strength
and consistency to those of six 25 × 25 risk factors (tobacco use, alcohol consumption, insuffi cient physical activity, raised blood pressure, obesity, diabetes). Our study is one of the largest studies to date to examine the association between socioeconomic status and premature mortality and the fi rst large-scale investigation to directly compare the importance of socioeconomic circumstances as determinants of health with six major risk factors targeted in global health strategies for the reduction of premature mortality.
Implications of all the available evidence
By showing comparable health impact of low socioeconomic status to that of major risk factors, our study suggests that socioeconomic adversity should be included as a modifi able risk factor in local and global health strategies, policies, and health-risk surveillance.
For more on the Lifepath
project see http://www.
lifepathproject.eu/ For more on ESEC see https:// www.iser.essex.ac.uk/archives/ esec/user-guide
men, 1–14 per week for women), or heavy (>21 units per week for men, >14 per week for women) drinkers. Although physical activity was measured with diff erent questions in each study, a dichotomised variable indicating the presence or absence of physical activity was defi ned (appendix). Body-mass index (BMI) was categorised as normal (18·5–<25 kg/m²), overweight (25–<30 kg/m²), or obese (≥30 kg/m²). Hypertension was defi ned as the presence of at least one of the following conditions: systolic blood pressure more than 140 mm Hg, diastolic blood pressure more than 90 mm Hg, current intake of anti-hypertensive medication, or self-reported hyper tension. Diabetes was defi ned as the presence of at least one of the following conditions: fasting glucose more than 7 mmol/L, 2 h post-load glucose above 11·1 mmol/L, glycated haemoglobin A1c more than 6·5%, or self-reported diabetes. Data for salt intake were only available from less than a third of the cohort studies; we therefore omitted this risk factor from our analysis.
We considered age, sex, race or ethnicity, and marital status as potential confounders. Race or ethnicity was categorised as white and non-white individuals. Marital status was categorised as married or cohabiting versus living alone.
Participants were linked to national mortality registries that provided information about vital status with the exception of the COLAUS study in which vital status was ascertained through active follow-up. Mean follow-up for mortality ranged between 3·2 years in the National Health Interview Survey 2009, and 27·0 years in men and 29·5 years in women of the Alameda County Study 1965, with a mean across cohorts of 13·3 years [SD 6·4 years]. All-cause mortality, cancer mortality, cardio vascular disease mortality, and mortality from other causes of death were examined separately. We focus on cancer and cardiovascular disease as these diseases are the most common causes of death in our samples. We used codes from the International Classifi cation of Diseases, 10th Revision (ICD-10) to defi ne cancer (C00–C97) and cardiovascular disease (I00–I99) mortality. Other causes of death include all remaining deaths not classifi ed as cancer or cardiovascular disease.
Statistical analysis
Analyses were fi rst performed separately in each study; estimates were subsequently combined in a meta-analytical framework. In study-specifi c analyses, we considered the maximum number of participants without missing values for each exposure. To estimate the association between risk factors and mortality, hazard ratios (HR) and 95% CIs were generated using fl exible parametric survival models on the cumulative hazards scale,13 which, in addition to the HRs, allow direct estimation of the conditional cumulative hazard function. Within these models, we used restricted cubic splines with 0 to 4 (depending on the cohort) internal knots to
model the baseline hazard using age as the timescale. Separate models were fi tted for men and women and included marital status and race or ethnicity (minimally adjusted models). To check for the proportional hazard assumption, we performed tests based on Schoenfeld residuals and inspected log-log plots of Kaplan-Meier curves. Age stratifi cation in 5-year intervals was conducted in all cohorts as a sensitivity analysis to adjust for age calendar eff ects (results not shown).
In further analyses combining men and women, we examined the association of socioeconomic status with cause-specifi c mortality before and after adjustment for the 25 × 25 risk factors. The mutually adjusted models included age, sex, race or ethnicity, marital status, socioeconomic status, and all 25 × 25 risk factors as independent variables with total mortality and deaths from cardiovascular disease, cancer, and other causes as outcomes. To enable balanced comparisons between socioeconomic status and 25 × 25 risk factors as predictors of cause-specifi c mortality, these analyses were restricted to a subgroup of participants with complete data for socioeconomic status and the 25 × 25 risk factors.
To examine whether the association between socio-economic status and mortality is attributable to the higher prevalence of the 25 × 25 risk factors among low socioeconomic status individuals, we repeated the analyses in a subgroup of participants without any 25 × 25 risk factors. Analyses were also repeated specifi cally focusing on premature mortality (<70 years) and by restricting the population to cohorts in which height and weight as well as blood pressure were measured objectively using standard procedures.
To further evaluate the eff ects of socioeconomic status and the 25 × 25 risk factors on mortality, we computed the population attributable fraction. The population attributable fraction is based on the HR and the proportion of participants exposed assuming the association between exposure and outcome is causal.14 The variance of population attributable fraction was estimated via bootstrapping using 1000 independent replications. The proportion of participants exposed (prevalence) was calculated as the mean prevalence across all cohorts for each risk factor.
YLLs were calculated as the diff erence of the areas under the survival curves (from age 40 years to 85 years) comparing the population exposed to a given risk factor with the reference population with no exposure. Area under the curve was computed via numerical integration with a spline-based method. Life expectancies were estimated conditional on survival to age 40 years. In view of the truncation at age 85 years, the theoretical maximal life expectancy at 40 years old is 45 years. Variance of YLLs was estimated via bootstrapping using 1000 independent replications.
Study-specifi c HRs, PAF, and YLLs estimates were meta-analysed using the Hartung-Knapp random-eff ects
method.15 To assess heterogeneity between cohorts, we computed I² and τ² statistics; I²to assess heterogeneity attributable to variation in the true association and τ² to measure the inter-cohort variance. To account for τ² in the uncertainty around the pooled estimates, we further calculated 95% prediction intervals for hazard ratios.16
Role of the funding source
The funding sources had no role in the study design; in the collection, analysis, and interpretation of data; in the writing of the report; or in the decision to submit the paper for publication. CC and MJ had full access to the
datasets. SS, PV, and MK had fi nal responsibility for the decision to submit for publication.
Results
48 studies were included (appendix). After excluding 27 392 (1·5%) of 1 778 871 participants who had missing data for the covariates or mortality, 1 751 479 participants were included in the analysis (appendix). Mean age at study entry was 47·8 years (SD 14·8) and 54% of participants were women. The proportion of participants with low occupational position ranged from 6·9% to 66·9% across studies (mean 41·4% [SD 12·5] for men and 27·1% [SD 14·9] for women). The proportion of people with a high occupational position varied between 5·9% and 84·8% (mean 32·5% [SD 11·7] men and 26·1% [SD 12·3] women). Age stratifi cation revealed no age calendar eff ects (data not shown).
During 12 025 208 person-years at risk for men, 161 524 men died; during 14 580 862 person-years at risk for women, a total of 148 753 women died (mean follow-up for men and women 13·3 years [SD 3·4]). In men, 43 765 (15·2% of total) with low occupational position died and 17 160 (11·5%) with high occupational position
died. In women, 11 835 (9·4% of total) with low
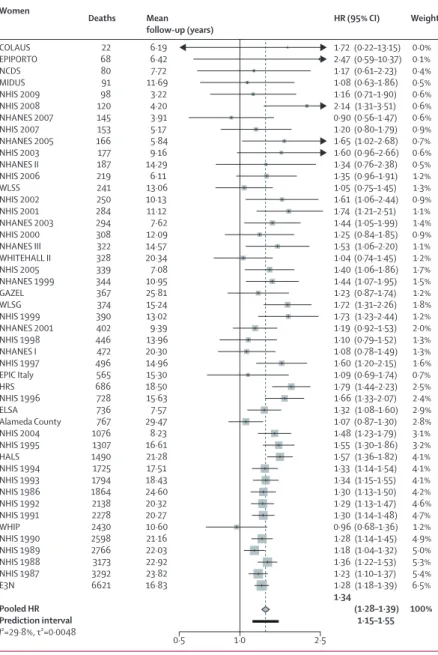
occupational position died and 8292 (6·8%) with high occupational position died. Participants with low occupational position had a higher mortality risk than did those with high occupational position, in both men (HR 1·42, 95% CI 1·38–1·45; fi gure 1) and women (1·34, 1·28–1·39; fi gure 2). Participants with inter-mediate occupational position had a higher mortality risk compared with participants with high occupational position (meta-analytic HR 1·21, 95% CI 1·18–1·24 for men and 1·17, 1·12–1·22 for women). A graded association between occupational position and mortality was observed in both men and women (HR for one unit decrease in SES 1·19, 95% CI 1·17–1·20 in men and
1·15, 1·13–1·18 in women, p<0·0001 for both).
Heterogeneity in study-specifi c estimates was low for men (I²=14·5% [0–41%], p=0·2034, τ²=0·0008) and moderate for women (I²=29·8% [0–51·2%], p=0·0309, τ²=0·0048).
Figure 3 shows mortality associated with the 25 × 25 risk factors (minimally adjusted models). The greatest increases in mortality associated with the 25 × 25 risk factors were for current smoking and diabetes, although physical inactivity, high alcohol intake, and hypertension were also associated (fi gure 3). The eff ect of low occupational position appeared greater than that of hypertension or obesity (fi gure 3); the eff ect of low occupational position on mortality was greater than that of obesity even when the obesity analysis was restricted to cohorts with a mean follow-up more than 10 years (>10 years; HR 1·12, 95% CI 1·05–1·21 for men and 1·24, 1·18–1·31 for women). 33 of 48 studies had complete data for occupational position and all 25 × 25 risk factors and had cause-specifi c mortality data, for a total of HR (95% CI) Weight Mean follow-up (years) Deaths COLAUS NHIS 2009 NHIS 2008 MIDUS EPIPORTO NHIS 2007 NCDS NHIS 2006 NHANES 2007 NHANES 2005 NHIS 2005 NHIS 2003 WLSS NHIS 2002 NHANES 2003 NHIS 2001 NHANES 1999 NHANES 2001 WLSG NHANES II NHIS 2000 NHIS 1999 NHANES III WHITEHALL II NHIS 1998 EPIC Italy NHIS 1997 ELSA NHIS 2004 NHANES I NHIS 1996 HRS HALS Alameda County GAZEL NHIS 1995 NHIS 1994 NHIS 1993 NHIS 1986 NHIS 1992 NHIS 1991 NHIS 1990 NHIS 1989 NHIS 1988 NHIS 1987 WHIP Pooled HR Prediction interval I²=14·5%, τ²=0·0008 55 86 111 133 144 148 159 183 190 234 290 291 360 372 381 463 479 483 502 528 530 540 656 708 719 758 829 840 1115 1147 1247 1279 1359 1547 1935 2293 3029 3090 3331 3898 4152 4590 4848 5564 6018 21 049 0·1% 0·2% 0·2% 0·3% 0·2% 0·3% 0·3% 0·4% 0·4% 0·5% 0·5% 0·6% 0·9% 0·7% 0·9% 0·9% 1·0% 1·1% 1·2% 1·0% 1·1% 1·1% 1·2% 0·7% 1·5% 0·6% 1·7% 1·5% 2·1% 1·9% 2·4% 2·4% 2·0% 2·4% 2·8% 3·9% 4·8% 4·9% 5·1% 5·7% 6·0% 6·3% 6·6% 7·1% 7·4% 5·0% 100% 6·16 3·22 4·18 11·61 6·88 5·13 7·45 6·09 3·86 5·73 7·00 9·10 12·72 10·05 7·39 11·01 10·51 9·12 14·95 13·74 11·94 12·88 14·47 20·40 13·78 16·04 14·73 7·30 8·15 18·58 15·45 17·28 20·23 26·96 25·34 16·31 17·18 18·08 23·69 19·83 19·75 20·59 21·41 22·21 22·93 11·60 (0·98–4·38) (0·72–2·11) (0·78–2·00) (0·81–1·81) (0·94–2·86) (0·85–1·99) (1·15–2·64) (1·29–2·58) (0·85–1·73) (0·85–1·60) (0·80–1·48) (0·86–1·50) (1·04–1·65) (1·47–2·47) (0·94–1·49) (1·49–2·39) (1·07–1·66) (1·19–1·80) (1·23–1·82) (1·05–1·64) (1·19–1·81) (1·34–2·04) (1·14–1·69) (1·21–2·04) (1·23–1·75) (1·05–1·88) (1·23–1·70) (1·22–1·74) (1·32–1·77) (1·27–1·72) (1·36–1·78) (1·31–1·71) (1·25–1·68) (1·12–1·47) (1·48–1·90) (1·25–1·52) (1·34–1·59) (1·32–1·57) (1·29–1·53) (1·26–1·47) (1·22–1·42) (1·28–1·48) (1·31–1·50) (1·29–1·46) (1·29–1·46) (1·36–1·60) (1·38–1·45) 1·33–1·51 2·08 1·23 1·25 1·21 1·64 1·30 1·74 1·82 1·21 1·17 1·09 1·14 1·31 1·90 1·19 1·89 1·33 1·46 1·49 1·32 1·47 1·66 1·39 1·57 1·47 1·40 1·45 1·46 1·53 1·48 1·55 1·50 1·45 1·29 1·68 1·38 1·46 1·44 1·41 1·36 1·32 1·37 1·40 1·37 1·38 1·47 1·42 1·0 0·5 2·5 Men
Figure 1: Mortality for low versus high occupational position in men in 46 cohort studies
HRs are adjusted for age, marital status, and race or ethnicity. Pooled HR is represented with a grey diamond and the 95% prediction interval with a black bar. I² statistic is the percentage of between study heterogeneity; τ² statistic measures the inter-study variance. The prediction interval provides a predicted range for the true association between occupational position and mortality. HR=hazard ratio.
275 973 participants with 21 923 deaths during the follow-up (fi gure 4). The association between low socioeconomic status and mortality was consistent across causes of death and remained signifi cant in the minimally adjusted models and the mutually adjusted models (fi gure 4). The highest minimally adjusted HR was current smoking (fi gure 4).
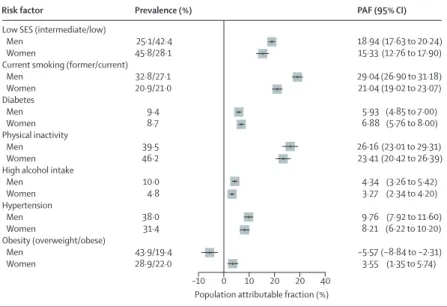
We assessed the PAF for socioeconomic status and the 25 × 25 risk factors, assuming the associations with mortality are causal and that the risk could be reduced to the level of the most favourable category for each factor (fi gure 5). We estimated the achievable reduction in mortality during the follow-up period should the death risk in the whole population equate that of high occupational position or the reference group for each of the 25 × 25 risk factors. The PAF for low SES was 18·94% (95% CI 17·63–20·24) for men and 15·33% (12·76–17·90) for women. The highest PAF was for smoking for men (29·04%, 26·90–31·18) and for physical inactivity for women (23·41%, 20·42–26·39).
In men and women combined, partial life expectancy at 40 years was reduced by more than 2 years because of
low socioeconomic status (fi gure 6). All other
25 × 25 factors assessed were associated with decreased life expectancy, apart from BMI (fi gure 6).
Additional sensitivity analyses including only western European cohorts, restricting the analysis to premature mortality (<70 years), to a subset of participants without the 25 × 25 risk factors (HR for low SES vs high SES 1·26, 95% CI 1·12–1·42), and to high quality studies or to cohorts with height and weight or blood pressure measured using standard procedures, yielded similar results (appendix).
Discussion
We used individual-level data from more than 1·7 million individuals in 48 independent cohort studies to compare the association of low socio economic status with mortality to those of six WHO 25 × 25 risk factor targets for the reduction of premature mortality. We found that the independent association between socioeconomic status and mortality is com parable in strength and consistency across countries to those for the 25 × 25 risk factors. Low socioeconomic status was associated with 2·1 YLLs between ages 40 and 85 years, while the corresponding years of life lost were 0·5 for high alcohol intake, 0·7 for obesity, 3·9 for diabetes, 1·6 for hyper-tension, 2·4 for physical inactivity and 4·8 for current smoking in men and women combined. These fi ndings are largely consistent with previous studies,17–19 which used income or education as a measure of socioeconomic status.
The strong infl uence of socioeconomic factors on health, morbidity and mortality is well established,3,20–25 with studies showing a widening in inequalities in mortality22,25 despite absolute inequalities falling in some countries.22,23 Our study is one of the largest to examine
the eff ect of low socioeconomic status on premature mortality and is to our knowledge the fi rst large-scale study to directly compare the importance of socio-economic circumstances as determinants of health with the six major risk factors targeted in global health strategies for the reduction of premature mortality. The association between low socioeconomic status and premature mortality was consistent across causes of death, whereas the 25 × 25 risk factors were generally more strongly associated with cardiovascular disease mortality than with cancer and with mortality of other causes. HR (95% CI) Weight Mean follow-up (years) Deaths COLAUS EPIPORTO NCDS MIDUS NHIS 2009 NHIS 2008 NHANES 2007 NHIS 2007 NHANES 2005 NHIS 2003 NHANES II NHIS 2006 WLSS NHIS 2002 NHIS 2001 NHANES 2003 NHIS 2000 NHANES III WHITEHALL II NHIS 2005 NHANES 1999 GAZEL WLSG NHIS 1999 NHANES 2001 NHIS 1998 NHANES I NHIS 1997 EPIC Italy HRS NHIS 1996 ELSA Alameda County NHIS 2004 NHIS 1995 HALS NHIS 1994 NHIS 1993 NHIS 1986 NHIS 1992 NHIS 1991 WHIP NHIS 1990 NHIS 1989 NHIS 1988 NHIS 1987 E3N Pooled HR Prediction interval I²=29·8%, τ²=0·0048 22 68 80 91 98 120 145 153 166 177 187 219 241 250 284 294 308 322 328 339 344 367 374 390 402 446 472 496 565 686 728 736 767 1076 1307 1490 1725 1794 1864 2138 2278 2430 2598 2766 3173 3292 6621 0·0% 0·1% 0·4% 0·5% 0·6% 0·6% 0·6% 0·9% 0·7% 0·6% 0·5% 1·2% 1·3% 0·9% 1·1% 1·4% 0·9% 1·1% 1·2% 1·7% 1·5% 1·2% 1·8% 1·2% 2·0% 1·3% 1·3% 1·6% 0·7% 2·5% 2·4% 2·9% 2·8% 3·1% 3·2% 4·1% 4·1% 4·1% 4·2% 4·6% 4·7% 1·2% 4·9% 5·0% 5·3% 5·4% 6·5% 100% 6·19 6·42 7·72 11·69 3·22 4·20 3·91 5·17 5·84 9·16 14·29 6·11 13·06 10·13 11·12 7·62 12·09 14·57 20·34 7·08 10·95 25·81 15·24 13·02 9·39 13·96 20·30 14·96 15·30 18·50 15·63 7·57 29·47 8·23 16·61 21·28 17·51 18·43 24·60 20·32 20·27 10·60 21·16 22·03 22·92 23·82 16·83 (0·22–13·15) (0·59–10·37) (0·61–2·23) (0·63–1·86) (0·71–1·90) (1·31–3·51) (0·56–1·47) (0·80–1·79) (1·02–2·68) (0·96–2·66) (0·76–2·38) (0·96–1·91) (0·75–1·45) (1·06–2·44) (1·21–2·51) (1·05–1·99) (0·84–1·85) (1·06–2·20) (0·74–1·45) (1·06–1·86) (1·07–1·95) (0·87–1·74) (1·31–2·26) (1·23–2·44) (0·92–1·53) (0·79–1·52) (0·78–1·49) (1·20–2·15) (0·69–1·74) (1·44–2·23) (1·33–2·07) (1·08–1·60) (0·87–1·30) (1·23–1·79) (1·30–1·86) (1·36–1·82) (1·14–1·54) (1·15–1·55) (1·13–1·50) (1·13–1·47) (1·14–1·48) (0·68–1·36) (1·14–1·45) (1·04–1·32) (1·22–1·53) (1·10–1·37) (1·18–1·39) (1·28–1·39) 1·15–1·55 1·72 2·47 1·17 1·08 1·16 2·14 0·90 1·20 1·65 1·60 1·34 1·35 1·05 1·61 1·74 1·44 1·25 1·53 1·04 1·40 1·44 1·23 1·72 1·73 1·19 1·10 1·08 1·60 1·09 1·79 1·66 1·32 1·07 1·48 1·55 1·57 1·33 1·34 1·30 1·29 1·30 0·96 1·28 1·18 1·36 1·23 1·28 1·34 1·0 0·5 2·5 Women
Figure 2: Mortality for low versus high occupational position in women in 47 cohort studies
HRs are adjusted for age, marital status, and race or ethnicity. Pooled HR is represented with a grey diamond and the 95% prediction interval with a black bar. The prediction interval provides a predicted range for the true association between occupational position and mortality. HR=hazard ratio.
We used occupational position as a proxy of socioeconomic status and social circumstances in general. This measure is one of the most commonly used indicators of socioeconomic status, data for this indicator were widely available across the cohort studies included in our analysis and occupational position is comparable between countries. Occupational position also has the advantage of reducing reverse causality—we assessed last known occupation, which is less likely to change with illness than is one’s income. However, socio economic status is a complex factor that comprises several dimensions and by using a single indicator of socioeconomic status we might have underestimated its full eff ect on mortality. Addressing several components of socioeconomic status (ie, low occupational position, income poverty, low education) could be important for population health improvement.
This study has some important limitations. First, risk factors (ie, hypertension, physical activity, obesity, and diabetes) are interconnected making it diffi cult to establish their independent contribution. For example, low socioeconomic status might induce changes in one or more risk factors, but risk factors for chronic diseases might also reduce labour supply and earnings, thereby lowering socioeconomic status. Furthermore, factors other than those considered in the 25 × 25 list could be involved in the pathways between socioeconomic status and mortality. In view of these complex relationships, our estimates of the population attributable fraction, assuming unidirectional causal associations, should be interpreted with caution. Second, diff erent measures of socioeconomic status can themselves be intertwined, and can infl uence risk factors for health or disease at diff erent points over a person’s life. For example, increased educational levels might contribute to increased life expectancy via multiple pathways including better occupational position, higher income, less smoking, reduced occupational hazard, more physical activity, healthier diet, increased self-care, and
adherence to medical treatments.26 However, the
fi nding that socioeconomic status is associated with death risk independently of conventional risk factors suggests that both socioeconomic adversity and 25 × 25 risk factors should be targeted by health strategies. Third, with broad two-level or three-level categorisations, the assessment of both socioeconomic status and risk factors was crude, potentially underestimating the strength of associations with mortality outcomes. However, the comparison between risk factors should be balanced because they were all measured with the same relative level of precision. The observed associations of smoking, physical activity, high alcohol intake, diabetes, and hypertension with mortality were comparable with those of previous studies.27–30 The non-signifi cant outcome observed between obesity and all-cause mortality in men might be an underestimate due to pre-existing morbidity HR (95% CI)
Time at risk (years) Deaths Participants Risk factor
Low SES (reference high SES) Men
Women
Current smoking (reference never smoking) Men Women Diabetes Men Women Physical inactivity Men Women
High alcohol intake (reference moderate alcohol intake) Men
Women Hypertension Men Women
Obesity (reference normal BMI) Men Women 87 716 48 791 37 238 46 447 39 655 38 162 39 794 45 353 33 151 37 864 41 034 44 340 131 882 136 680 9 835 775 9 538 159 3 150 820 5 271 704 3 089 811 3 749 493 3 029 468 4 941 600 2 808 575 4 649 162 3 184 326 4 752 337 17 632 210 22 310 188 619 402 592 157 276 686 423 861 262 745 325 540 259 265 398 992 235 245 363 666 273 190 391 681 636 779 815 005 (1·38–1·45) (1·28–1·39) (2·06–2·29) (1·91–2·14) (1·56–1·83) (1·73–2·03) (1·50–1·70) (1·48–1·67) (1·38–1·64) (1·49–1·92) (1·24–1·36) (1·21–1·36) (0·98–1·11) (1·10–1·24) 1·42 1·34 2·17 2·02 1·69 1·88 1·60 1·58 1·50 1·69 1·30 1·28 1·04 1·17 1·5 0·5 1·0 2·0 1·5 Mutually adjusted HR (95% CI) Risk factor and
outcomes
Low SES (reference high SES) All-cause
CVD Cancer Other
Current smoking (reference never smoking) All-cause CVD Cancer Other Diabetes All-cause CVD Cancer Other Physical inactivity All-cause CVD Cancer Other
High alcohol intake (reference moderate intake) All-cause CVD Cancer Other Hypertension All-cause CVD Cancer Other
Obesity (reference normal BMI) All-cause CVD Cancer Other 1·26 (1·21–1·32) 1·29 (1·16–1·43) 1·26 (1·19–1·34) 1·25 (1·17–1·33) 2·21 (2·10–2·33) 2·21 (2·00–2·44) 2·52 (2·32–2·74) 1·99 (1·85–2·14) 1·73 (1·60–1·88) 1·92 (1·64–2·27) 1·18 (1·04–1·34) 2·08 (1·91–2·26) 1·28 (1·19–1·37) 1·35 (1·25–1·46) 1·14 (1·06–1·23) 1·34 (1·22–1·47) 1·36 (1·23–1·51) 1·19 (1·08–1·32) 1·38 (1·21–1·56) 1·46 (1·30–1·65) 1·31 (1·24–1·38) 1·69 (1·53–1·88) 1·07 (0·99–1·16) 1·29 (1·21–1·38) 1·05 (0·97–1·14) 1·22 (1·06–1·40) 1·02 (0·94–1·11) 1·01 (0·92–1·10) Minimally adjusted HR (95% CI) 1·46 (1·39–1·53) 1·52 (1·37–1·67) 1·43 (1·34–1·52) 1·45 (1·35–1·56) 2·27 (2·14–2·39) 2·19 (1·98–2·42) 2·64 (2·40–2·91) 2·05 (1·91–2·20) 1·87 (1·72–2·03) 2·18 (1·86–2·55) 1·21 (1·06–1·38) 2·21 (2·01–2·42) 1·43 (1·34–1·53) 1·54 (1·43–1·65) 1·25 (1·15–1·36) 1·50 (1·37–1·64) 1·64 (1·44–1·87) 1·45 (1·26–1·66) 1·70 (1·44–1·99) 1·76 (1·52–2·03) 1·38 (1·30–1·46) 1·83 (1·66–2·03) 1·08 (0·98–1·18) 1·38 (1·28–1·47) 1·18 (1·09–1·27) 1·46 (1·28–1·66) 1·01 (0·92–1·10) 1·17 (1·08–1·26) 2·0 1·0 0·5 1·5 2·5 3·0
Figure 4: Pooled hazard ratios of socioeconomic status and 25 × 25 risk factors for all-cause mortality and cause-specifi c mortality
The minimally adjusted models were only adjusted for sex, age, and race or ethnicity; in the mutually adjusted models, SES and the 25 × 25 risk factors are mutually adjusted. BMI=body-mass index. CVD=cardiovascular disease. SES=socioeconomic status.
Figure 3: Pooled hazard ratios of socioeconomic status and 25 × 25 risk factors for mortality
leading to weight loss and increased mortality risk among lean or underweight individuals.31,32 Hetero-geneity in study-specifi c estimates was generally low for occupational position, but larger for some of the risk factors (appendix). This diff erence could be due to varying degrees of precision in the measurement of the 25 × 25 risk factors in the diff erent cohorts, and random-eff ect meta-analysis partially takes this uncertainty into account for the estimation of pooled eff ects. Finally, the cohort studies participating in the LIFEPATH consortium were from high-income countries. Thus, our results might not be generalisable to other populations. Previous studies suggest that socio economic factors and the 25 × 25 risk factors are also strong predictors of premature mortality in low and middle income countries.33 Further research should assess socioeconomic status and 25 × 25 risk factors in predicting mortality in diff erent economic settings.
Despite these limitations, our study has important implications. Our fi ndings suggest that existing global strategies and actions defi ned in the 25 × 25 health plan and the Global Burden of Diseases surveillance programme potentially exclude a major determinant of health from the agenda. A lack of consideration of the interrelation between social circumstances and health is also evident in the Sustainable Development Goals (SDGs): SDG 3 focuses on health but it makes no mention of the role of social circumstances. Similarly, SDG 1 and 4 focus on the elimination of poverty and the achievement of universal primary education but they do not mention reducing health inequalities as an explicit goal. Similar to the risk factors targeted by existing global health strategies, socioeconomic circumstances are modifi able by policies at the local, national, and international levels,26,34 through interventions such as promotion of early childhood development, poverty reduction, improve ments to access to high-quality education, enacting of compulsory schooling laws, and creation of safe home, school, and work environments.8,9 Over the past decade, socioeconomic factors have started making their way into international agencies and global reports, as evidenced in the report of the WHO Commission on the Social Determinants of Health (CSDH) in 200826 and in the Rio Political Declaration on the Social Determinants of Health.35
Although these eff orts have raised awareness of
socioeconomic inequalities in health, global prevention strategies still appear to be centred on the treatment of proximal risk factors. Such approaches fail to address powerful upstream structural solutions such as investment in early education programmes for children (allowing parents to work while their children are cared for) and work incentive programmes (ie, earned income tax credit) that might be a cost-eff ective way to reduce
inequalities in health.10,36–38 By showing low
socioeconomic status has a comparable health eff ect to that of major risk factors, the results of our study
suggest that socio economic circumstances, in addition to the 25 × 25 factors, should be treated as a target for local and global health strategies, health risk surveillance, interventions, and policy.
PAF (95% CI) Prevalence (%)
Risk factor
Low SES (intermediate/low) Men
Women
Current smoking (former/current) Men Women Diabetes Men Women Physical inactivity Men Women High alcohol intake Men Women Hypertension Men Women Obesity (overweight/obese) Men Women 25·1/42·4 45·8/28·1 32·8/27·1 20·9/21·0 9·4 8·7 39·5 46·2 10·0 4·8 38·0 31·4 43·9/19·4 28·9/22·0 (17·63 to 20·24) (12·76 to 17·90) (26·90 to 31·18) (19·02 to 23·07) (4·85 to 7·00) (5·76 to 8·00) (23·01 to 29·31) (20·42 to 26·39) (3·26 to 5·42) (2·34 to 4·20) (7·92 to 11·60) (6·22 to 10·20) (−8·84 to −2·31) (1·35 to 5·74) 18·94 15·33 29·04 21·04 5·93 6·88 26·16 23·41 4·34 3·27 9·76 8·21 −5·57 3·55 10
Population attributable fraction (%)
–10 0 20 20 40
Figure 5: Population attributable fraction for socioeconomic status and 25 × 25 risk factors
Calculations assume risk in the population at the level of the least exposed group. SES=socioeconomic status. PAF=population attributable fraction.
Figure 6: Life expectancy from age 40 years to 85 years and years of life lost due to low socioeconomic status and 25 × 25 risk factors
SES=socioeconomic status. BMI=body-mass index. 20 25 30 35 40 45
Life expectancy (years)
–2·6 (–2·8 to –2·4) –5·6 (–6·1 to –5·2) –4·1 (–4·7 to –3·4) –2·8 (–3·4 to –2·2) –0·6 (–1·1 to –0·1) –1·9 (–2·3 to –1·6) –0·4 (–0·8 to 0·1) Men
Years of life lost (95% CI)
20 25 30 35 40 45
Life expectancy (years)
High Low SES –1·5 (–1·8 to –1·3) –4·0 (–4·5 to –3·6) –3·9 (–4·6 to –3·2) –2·0 (–2·5 to –1·5) –0·4 (–0·8 to 0·0) –1·3 (–1·7 to –1·0) –0·9 (–1·3 to –0·6) NeverCurrent Smoking No Yes Diabetes No Yes Physical inactivity Moderate High Alcohol intake No Yes Hypertension Normal Obese BMI Women
Contributors
MK, SS, and PV conceived the study. SS wrote the fi rst and successive drafts of the manuscript. CC and MJ modelled and analysed the data. CC, MA, JPM, PM, CD, IK, MK-I, RL, AS, MC-H, and Ad’E contributed to study conception and design. FG and FR contributed to data analysis. HB, MB, FC-C, GC, SF, MG, GGG, VK, AML, MGM, MP, MJS, AS, PV, MZ, MK, PV, and MJ collected the data. All authors revised the manuscript for important intellectual content.
LIFEPATH Consortium
Harri Alenius, Mauricio Avendano, Henrique Barros, Murielle Bochud, Cristian Carmeli, Luca Carra, Raphaele Castagné, Marc Chadeau-Hyam, Françoise Clavel-Chapelon, Giuseppe Costa, Emilie Courtin,
Cyrille Delpierre, Angelo D’Errico, Pierre-Antoine Dugué, Paul Elliott, Silvia Fraga, Valérie Gares, Graham Giles, Marcel Goldberg, Dario Greco, Allison Hodge, Michelle Kelly Irving, Piia Karisola, Mika Kivimäki, Vittorio Krogh, Thierry Lang, Richard Layte, Benoit Lepage, Johan Mackenbach, Michael Marmot, Cathal McCrory, Roger Milne, Peter Muennig, Wilma Nusselder, Salvatore Panico, Dusan Petrovic, Silvia Polidoro, Martin Preisig, Olli Raitakari, Ana Isabel Ribeiro, Ana Isabel Ribeiro, Fulvio Ricceri, Oliver Robinson, Jose Rubio Valverde, Carlotta Sacerdote, Roberto Satolli, Gianluca Severi, Martin J Shipley, Silvia Stringhini, Rosario Tumino, Paolo Vineis, Peter Vollenweider, and Marie Zins.
Declaration of interests
PV reports grants from GlaxoSmithKline. JPM reports grants from European Commission. MK reports grants from the Medical Research Council and NordForsk, the Nordic Research Programme on Health and Welfare. MP reports grants from GlaxoSmithKline and Swiss National Science Foundation, during the conduct of the study. All other authors declare no competing interests.
Acknowledgments
This study was partly supported by the European Commission (Horizon 2020 grant number 633666) and the Swiss State Secretariat for Education, Research and Innovation SERI. SS is supported by an Ambizione Grant (PZ00P3_167732) from the Swiss National Science Foundation. SF is supported by the Portuguese Foundation for Science and Technology (SFRH/BPD/97015/2013). AML is supported by an MD-PhD grant (323530_151479) from the Swiss National Science Foundation. Various sources have supported recruitment, follow-up, and measurements in the 48 cohort studies contributing to this collaborative analysis. MK is supported by the UK Medical Research Council (K013351) and NordForsk.
References
1 WHO. Global action plan for the prevention and control of noncommunicable diseases 2013–2020. Geneva, Switzerland: World Health Organization, 2013.
2 Lim SS, Vos T, Flaxman AD, et al. A comparative risk assessment of burden of disease and injury attributable to 67 risk factors and risk factor clusters in 21 regions, 1990–2010: a systematic analysis for the Global Burden of Disease Study 2010. Lancet 2012;
380: 2224–60.
3 Mackenbach JP, Stirbu I, Roskam AJ, et al.
Socioeconomic inequalities in health in 22 European countries. N Engl J Med 2008; 358: 2468–81.
4 Stringhini S, Sabia S, Shipley M, et al. Association of socioeconomic position with health behaviors and mortality. JAMA 2010; 303: 1159–66. 5 Stringhini S, Rousson V, Viswanathan B, Gedeon J, Paccaud F,
Bovet P. Association of socioeconomic status with overall and cause specifi c mortality in the Republic of Seychelles: results from a cohort study in the African region. PLoS One 2014; 9: e102858. 6 Hosseinpoor AR, Bergen N, Mendis S, et al. Socioeconomic
inequality in the prevalence of noncommunicable diseases in low- and middle-income countries: results from the World Health Survey. BMC Public Health 2012; 12: 474.
7 Rasella D, Aquino R, Santos CA, Paes-Sousa R, Barreto ML. Eff ect of a conditional cash transfer programme on childhood mortality: a nationwide analysis of Brazilian municipalities. Lancet 2013; 382: 57–64.
8 Lleras-Muney A. The relationship between education and adult mortality in the United States. Rev Econ Stud 2005; 72: 189–221.
9 Heckman JJ. Skill formation and the economics of investing in disadvantaged children. Science 2006; 312: 1900–02.
10 Lopez-Arana S, Avendano M, van Lenthe FJ, Burdorf A. The impact of a conditional cash transfer programme on determinants of child health: evidence from Colombia. Public Health Nutr 2016; 19: 1–14. 11 Stringhini S, Viswanathan B, Gedeon J, Paccaud F, Bovet P.
The social transition of risk factors for cardiovascular disease in the African region: Evidence from three cross-sectional surveys in the Seychelles. Int J Cardiol 2013; 168: 1201–06.
12 Higgins JPT, Green S, (eds). Cochrane Handbook for Systematic Reviews of Interventions Version 5.1.0 [updated March 2011]. The Cochrane Collaboration, 2011. http://www.handbook.cochrane. org (accessed June 15, 2016).
13 Royston P, Parmar MK. Flexible parametric proportional-hazards and proportional-odds models for censored survival data, with application to prognostic modelling and estimation of treatment eff ects. Stat Med 2002; 21: 2175–97.
14 WHO. Metrics: Population Attributable Fraction (PAF). Quantifying the contribution of risk factors to the Burden of Disease. 2016. http://www.who.int/healthinfo/global_burden_disease/metrics_ paf/en/2016 (accessed June 15, 2016).
15 IntHout J, Ioannidis JP, Borm GF. The Hartung-Knapp-Sidik-Jonkman method for random eff ects meta-analysis is straightforward and considerably outperforms the standard DerSimonian-Laird method. BMC Med Res Methodol 2014; 14: 25. 16 IntHout J, Ioannidis JP, Rovers MM, Goeman JJ. Plea for routinely
presenting prediction intervals in meta-analysis. BMJ Open 2016;
6: e010247.
17 Muennig P, Fiscella K, Tancredi D, Franks P. The relative health burden of selected social and behavioral risk factors in the United States: implications for policy. Am J Public Health 2010; 100: 1758–64. 18 Muennig P, Franks P, Jia H, Lubetkin E, Gold MR.
The income-associated burden of disease in the United States. Soc Sci Med 2005; 61: 2018–26.
19 Maki NE, Martikainen PT, Eikemo T, et al. The potential for reducing diff erences in life expectancy between educational groups in fi ve European countries: the eff ects of obesity, physical inactivity and smoking. J Epidemiol Community Health 2014;
68: 635–40.
20 Townsend P, Davidson N. Inequalities in health: The Black report. Harmondsworth, UK: Penguin Books, 1982.
21 Marmot MG, Shipley MJ, Rose G. Inequalities in death—specifi c explanations of a general pattern? Lancet 1984; 1: 1003–06. 22 Chetty R, Stepner M, Abraham S, et al. The Association between
income and life expectancy in the United States, 2001–2014. JAMA 2016; 315: 1750–66.
23 Mackenbach JP, Kulhanova I, Artnik B, et al. Changes in mortality inequalities over two decades: register based study of European countries. BMJ 2016; 353: i1732.
24 Stringhini S, Dugravot A, Shipley M, et al. Health behaviours, socioeconomic status, and mortality: further analyses of the British Whitehall II and the French GAZEL prospective cohorts. PLoS Med 2011; 8: e1000419.
25 Mayhew L, Smith D. An investigation into inequalities in adult lifespan. London, UK: Cass Business School, City University London, 2016.
26 Commission for the Social Determinants of Health. Closing the gap in a generation: health equity through action on the social determinants of health. Final Report of the Commission on Social Determinants of Health. Geneva: World Health Organization, 2008.
27 Gellert C, Schottker B, Brenner H. Smoking and all-cause mortality in older people: systematic review and meta-analysis.
Arch Intern Med 2012; 172: 837–44.
28 Di Castelnuovo A, Costanzo S, Bagnardi V, Donati MB, Iacoviello L, de Gaetano G. Alcohol dosing and total mortality in men and women: an updated meta-analysis of 34 prospective studies. Arch Intern Med 2006; 166: 2437–45.
29 Nocon M, Hiemann T, Muller-Riemenschneider F, Thalau F, Roll S, Willich SN. Association of physical activity with all-cause and cardiovascular mortality: a systematic review and meta-analysis. Eur J Cardiovasc Prev Rehabil 2008; 15: 239–46.
30 Seshasai SR, Kaptoge S, Thomson A, et al, for Emerging Risk Factors Collaboration. Diabetes mellitus, fasting glucose, and risk of cause-specifi c death. N Engl J Med 2011; 364: 829–41.
31 Berrington de Gonzalez A, Hartge P, Cerhan JR, et al. Body-mass index and mortality among 1·46 million white adults. N Engl J Med 2010; 363: 2211–19.
32 Whitlock G, Lewington S, Sherliker P, et al, for the Prospective Studies Collaboration. Body-mass index and cause-specifi c mortality in 900 000 adults: collaborative analyses of 57 prospective studies. Lancet 2009; 373: 1083–96.
33 Di Cesare M, Khang YH, Asaria P, et al. Inequalities in non-communicable diseases and eff ective responses. Lancet 2013;
381: 585–97.
34 Marmot MG, Atkinson T, Bell J, et al. Fair society, healthy lives: a strategic review of health inequalities in England post-2010: The Marmot Review. London: UCL Institute, 2010.
35 WHO. Rio Political Declaration on Social Determinants of Health. Rio de Janeiro, Brazil: World Health Organization, 2011.
36 Levin H, Belfi eld C, Muennig P, Rouse C. The costs and benefi ts of an excellent education for America’s children. New York, NY: Teachers College, 2006.
37 Elesh D, Lefcowitz MJ. The eff ects of the New Jersey-Pennsylvania Negative Income Tax Experiment on health and health care utilization. J Health Soc Behav 1977; 18: 391–405.
38 Muennig PA, Mohit B, Wu J, Jia H, Rosen Z. Cost eff ectiveness of the earned income tax credit as a health policy investment. Am J Prev Med 2016; published online Aug 26. DOI:10.1016/ j.amepre.2016.07.001.