M
ASTER OF
S
CIENCE IN
FINANCE
M
ASTER
’
S
F
INAL
W
ORK
PROJECT
EQUITY RESEARCH
:
S
PORT
L
ISBOA E
B
ENFICA
–
F
UTEBOL
,
SAD
F
RANCISCO
S
ILVÉRIO DE
M
ATOS
M
ASTER OF
S
CIENCE IN
FINANCE
M
ASTER
’
S
F
INAL
W
ORK
PROJECT
EQUITY RESEARCH
:
S
PORT
L
ISBOA E
B
ENFICA
–
F
UTEBOL
,
SAD
F
RANCISCO
S
ILVÉRIO DE
M
ATOS
S
UPERVISOR
:
C
LARA
R
APOSO
Abstract
This project contains a detailed evaluation of Sport Lisboa e Benfica
– Futebol, SAD,
according to ISEG´s Master in Finance final work project. This report was written in
accordance with the recommendations of the CFA Institute. The choice of this company
was mainly due to the great interest for the sports industry and for the company itself in
order to understand even better the financial side and potential of this business. This report
was written with respect to the public information available on September 10, 2016, any
information or event subsequent to this date has not been considered. The target price
was obtained using an absolute valuation method, the method of Discounted Cash Flow
(DCF), complemented by a relative valuation method, the method of Comparable
Multiples. With a final target price of € 1.63, representing an upside potential of 79% from
the current price of € 0.91, our final recommendation for the Benfica SAD (SLBEN) is to
Buy, despite the risks that the company faces as it depends highly on the sports results
that can affect strongly the company results and affect the target price of the company.
JEL classification: G10; G32; G34; Z23.
Keywords: Equity Research; Valuation; Mergers & Acquisitions; Sports Industry;
Football; Sport Lisboa e Benfica – Futebol, SAD.
ii
Resumo
Este projeto contem uma avaliação detalhada da Sport Lisboa e Benfica – Futebol, SAD,
de acordo com o trabalho final do programa de Mestrado de Finanças do ISEG. Este
relatório foi elaborado de acordo com as recomendações do CFA Institute. A escolha
desta empresa deve-se, principalmente, pelo grande interesse na indústria desportiva e
também na empresa em si, com o objetivo de entender cada vez melhor o lado financeiro
e o potencial desta indústria de negócio. Este relatório foi elaborado de acordo com a
informação pública disponível a 10 de Setembro de 2016. Qualquer informação ou evento
subsequente a esta data não foi considerada. O preço-alvo foi obtido através de um
método de avaliação absoluto, o método dos Fluxos de Caixa Descontados (DCF em
inglês), reforçado por um método de avaliação relativo, o método dos múltiplos
comparáveis. Com um preço alvo final de € 1.63, representando um potencial de
valorização de 79% face ao preço atual
de € 0.91, a nossa recomendação final para
Benfica SAD (SLBEN) é de Compra, apesar dos riscos que possam ocorrer como o risco
desportivo a que a empresa está exposta, dado que a empresa depende em parte dos
resultados desportivos, que pode influenciar fortemente os resultados e afetar o
preço-alvo da empresa.
Classificação JEL: G10; G32; G34; Z23.
Palavras-Chave: Equity Research; Avaliação de Empresas; Fusões e Aquisições de
Empresas; Indústria Desportiva; Futebol; Sport Lisboa e Benfica – Futebol, SAD.
Acknowledgements
After much effort, dedication and hard work, this Project represents the final step of an
important and long journey in my live. None of this would be possible without the strong
support of my family, friends, colleagues and professors.
To my Family, for the unconditional support, encouragement and all the conditions that
gave me the possibility to achieve all my personal and academic goals.
To my friends and colleagues, for the friendship, lived experiences and all the remarkable
moments along all these years.
To my supervisor Professor Clara Raposo, for the guidance, patience, effort to help me
and valuable insights that pushed me to right path and for the long hours spent discussing
and making this project real.
iv
Index
Abstract
i
Resumo
ii
Acknowledgements
iii
Index
iv
List of Figures
vi
List of Tables
vii
1.
Research Snapshot
1
2.
Business Description
2
3.
Management & Corporate Governance
7
4.
Economic and Industry Overview
8
5.
Investment Summary
10
6.
Valuation
11
7.
Financial Analysis
15
8.
Investment Risks
17
Appendices
20
Appendix 1: Statement of Financial Position
20
Appendix 2: Income Statement
21
Appendix 3: Cash Flow Statement
22
Appendix 4: Historical Share Price
23
Appendix 5: Forecasting Assumptions: Consolidated Balance Sheet
24
Appendix 6: Forecasting Assumptions: % of sales method for Consolidated
Balance Sheet
25
Appendix 7: Forecasting Assumptions: Consolidated Income Statement
27
Appendix 8: Forecasting Assumptions: % of sales method for Consolidated
Income Statement
28
Appendix 9: Business Structure
29
Appendix 10: Valuation Methods
30
Appendix 11: Discounted Cash Flow Assumptions
31
Appendix 12: Discounted Cash Flow Analysis
32
Appendix 13: Comparable Multiples
33
Appendix 14: Sensitivity Analysis
34
Appendix 15: Monte Carlo Simulation
35
Appendix 16: Risk Matrix
36
Appendix 17: Ownership Structure
37
Appendix 18: International Recognition
38
References
42
vi
List of Figures
Figure 1: Share Price
1
Figure 2: Benfica SAD Operating Earnings
1
Figure 3: Benfica SAD Operating Income without Athletes
1
Figure 4: Benfica badge
2
Figure 5: Benfica SAD participations
2
Figure 6: Benfica SAD revenues in 2015
2
Figure 7: Benfica SAD expenses in 2015
2
Figure 8: Benfica SAD Asset evolution 2012-2015
3
Figure 9: Benfica SAD Debt evolution 2012-2015
3
Figure 10: Porter’s Five Forces
5
Figure 11: Portuguese League Winners in the last 6 years
7
Figure 12: Portugal Annual GDP growth rate
8
Figure 13: Benfica SAD Operating Revenues/Costs without Athletes Transactions
2012-2015
8
Figure 14: Benfica SAD Operating Income 2012-2015
8
Figure 15: Deloitte Money League 2007 Top 20
9
Figure 16: Benfica SAD EPS during the forecast period
10
Figure 17: Operating Earnings: Services vs Others
11
Figure 18: Athlete Transactions
11
Figure 19: Financial Revenues vs. Expenses
11
Figure 20: Benfica SAD Asset
11
Figure 21: Benfica SAD Equity
12
Figure 22: Benfica SAD Debt
12
Figure 23: Benfica SAD EBITDA
15
Figure 24: Benfica SAD Operating Earnings
15
Figure 25: Operating Earnings: Services
15
Figure 26: Operating Earnings: Other
15
Figure 27: Benfica SAD Personal Expenses
15
Figure 28: Benfica SAD Operating Income without Athletes
15
Figure 29: Benfica SAD Net Profit
16
Figure 30: Historical Share Price
16
Figure 31: Risk Matrix
17
List of Tables
Table 1: Analyst Risk Assessment
1
Table 2: Sensibility Analysis to growth rate (g)
1
Table 3: Largest Benfica SAD Athlete Sales until 2015
4
Table 4: SWOT Analysis
5
Table 5: Benfica SAD Board Compensation plan
7
Table 6: Benfica SAD Shareholder Structure
7
Table 7: Portuguese Economy Projections
8
Table 8: Portuguese League Winners in the last 6 years
8
Table 9: Deloitte Money League 2008 Top 20
9
Table 10: Deloitte Money League 2013 Under Top 20
9
Table 11: Deloitte Money League 2015
9
Table 12: Valuation Summary
10
Table 13: Benfica SAD NWC
12
Table 14: DCF Output
12
Table 15: Benfica SAD FCFF calculations
12
Table 16: Benfica SAD FCFF
12
Table 17: WACC
13
Table 18: EV/Sales Output
14
Table 19: Comparable Companies
14
Table 20: Sensibility Analysis Summary
18
Table 21: Monte Carlo Percentile Distribution
19
1
SLBEN: Setting Records
(YE2016 Price Target of € 1.63 (+79%); recommendation is to BUY)
BUY is our recommendation for Sport Lisboa e Benfica – Futebol, SAD (SLBEN) with a
price target of € 1.63 at the end of 2016, using the discounted cash flow method. Relative valuation through multiples supports our view that SLBEN is currently undervalued. This offers a potential 79% upside gain from its June 30th, 2015 closing price of € 0.91, although with high risk.
Figure 1: Share Price
Source: Reuters and FM edition
Highlights
Operating Income and Earnings are reaching values never reached before. It is expected that in 2016 it achieves the highest value ever and that it can maintain in that level in the future. We predict this increase due to the sporting success that the football team has been achieving over the last few years. Items like UEFA premiums, tickets, TV broadcasting rights and sponsors are directly linked with Benfica’s sporting performance. The Operating Income without Athlete Transactions is expected to be always positive in the forecast period, accomplishing an objective of the board of directors. Also the Net Income is expected to start being constantly positive. With the good results Benfica SAD expects to, in the future, change its capital structure to a value closer to the target 70% debt and 30% equity. The board has already started a program to substitute its bank debt with non-convertible bond loans in order to diminish its financial expenses and to transform its current debt in more long term debt.
A new perspective of the use of the resources that SLBEN already has at home is one of the main drivers of the board for the future. The objective is to start to take advantage of the investments made in its training center and incorporate the best players formed in the club in the main football team and, with this, decrease the costs in signing new athletes.
Table 2: Sensitivity analysis to g
Source: FM edition
1.
Research Snapshot
Benfica SAD
BUY
High risk
September 2016Portugal
Table 1: Risk Assessment
Low Medium High
Our risk assessment is a high risk estimation for SLBEN.
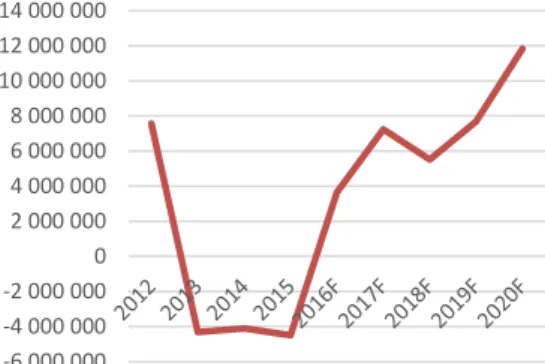
Figure 3: Benfica SAD’s Operating Income Without Athletes
(at 30-06 of each year) Values in €
Source: SAD Report and FM estimates
-6 000 000 -4 000 000 -2 000 000 0 2 000 000 4 000 000 6 000 000 8 000 000 10 000 000 12 000 000 14 000 000
Figure 2: Benfica SAD’s Operating Earnings
(at 30-06 of each year) Values in €
Source: SAD Report and FM estimates
0 20 000 000 40 000 000 60 000 000 80 000 000 100 000 000 120 000 000 140 000 000
Sport Lisboa e Benfica – Futebol, SAD is the company which gives legal personification to Sport Lisboa e Benfica’s professional football team. It was established on February 10th, 2000, under the special arrangements provided in the Decree-Law No. 67/97 of April 3rd. According to the website www.portaldaempresa.pt, a “SAD” is a privately held company owned by shareholders, whose purpose is to participate in sports competitions, as well as the promotion and organization of sports shows and/or development of activities related to professional sports”. The creation of SADs was imposed by law, in order to maintain the balance in tax treatment between the sports clubs and citizens. Before the creation of these entities known as “SAD”, all sports business passed on the margins of social contributions, since most players' salaries were not declared and, consequently, also there were no discounts for social security.
Sport Lisboa e Benfica (the club) was founded on February 28th, 1904, and it competes in more than 20 other different sports like basketball, handball, roller-hockey or volleyball. Particularly in football, it counts with lots of glorious achievements in its history, such as 10 European finals, including 2 UEFA Champions Leagues titles, 35 Portuguese domestic leagues or 25 Portuguese Cups.
The development of the main activity of Benfica SAD presupposes the existence and maintenance of a privileged relationship with SL Benfica, based on agreements and protocols that ensure Benfica SAD, in particular, the use of the brand "Benfica" by the professional football team and at any sports events. Any change in this situation, which is not expected at all to happen, could affect significantly the development of Benfica SAD’s normal activity.
In name of that, Benfica SAD has to ensure all functions related to the professional management of that team, such as: the participation in sports competitions of professional football at national and international level; training of football players; exploitation of television rights in open and closed channel; management of image and economic rights of the players, exploitation of the brand "Benfica", and, management of the exploitation rights of part of the Sports Complex of Sport Lisboa e Benfica’s Stadium necessary to the practice of professional football.
In a special meeting held on May 21st 2007, the Governing Board of the Portuguese Securities Market Commission deliberated the approval of the circular of admission to the negotiation in Euronext Lisbon of 15,000,001 representative shares of the totality of Sport Lisboa e Benfica - Futebol, SAD equity capital. The shares are common, book-entry and nominative and have a face value of 5 €.
Benfica SAD is the parent-company of a group of companies, which is called “Benfica SAD Group”. Sport Lisboa e Benfica SAD holds interests in the following entities: 100% of “Benfica Estádio, SA” (sports facilities); 100% of Benfica TV, SA (media); 50% of Clínica do SLB, Lda (healthcare), and, 2% of Benfica Seguros, Lda (insurance) (Figure 5).
The main revenues of Benfica SAD should be separated in two groups: revenues with athlete rights transfers and revenues without athletes, since athlete rights transactions are the main heading revenues. The main revenues without athlete rights transactions are the following: UEFA participation and performance premiums/bonus; television/broadcasting revenues, sponsorships and advertisement, and, tickets sales (Figure 6).
Just like the revenues, the principal expense that Benfica SAD has is directly linked with the professional football team: athletes’ salaries. The other main costs the company affords are supplies and external services, and, depreciations/amortizations (Figure 7).
Company Strategies
When this board of directors took over the company administration it was facing a highly difficult situation, both sporting and financially speaking.
In sports matters, the professional football team was facing, successively, bad seasons with recurrent bad sporting results being, inclusively, 10 years without reaching its eternal main sporting goal, the Portuguese Championship. In order to achieve the desired
2.
Business Description
Figure 5: Benfica SAD participations
Source: SAD Report
Figure 4: Benfica Badge
Source: Benfica Website
Figure 6: Benfica SAD Revenues in 2015
Source: SAD Report
Figure 7: Benfica SAD Expenses in 2015
Source: SAD Report
30,23% 55,98% 12,63% -0,74% 1,90% Supplies and external services Salaries Depreciations/ Amortizations Provisions/Im pairments
3
results, the Board decided to start a leverage policy to reach the required funds needed to make the investments that the Board had defined as fundamental to the future of the club. Initially, the investments made by the company were mainly in the construction and improvement of infrastructures, like the football stadium and the training center, and also in specialized staff. In the following years, the Board decided that it was time to invest more in talented players for the professional football team, and this required also a significant investment. With this investment, the professional football team improved significantly and has started to reach more frequently its goals.
Season 2009/2010: The season 2009/2010 was a crucial year for the club’s present and
future. The board hired a new coach, Jorge Jesus, and signed with some talented players like Javier Saviola, Javi García or Ramires. Benfica won the Portuguese Championship, an achievement that was not accomplished since season 2004/2005, and also won the Portuguese League Cup. It was important to motivate the fans to the upcoming years and to break the sequence of championships won by the one of the major rivals, FC Porto, in the last years. In the 3 subsequent seasons Benfica did not win the championship but ended the league always on the 2nd position and did well in the European competitions and in the Portuguese League Cup.
Season 2010/2011: This season was not a good season for the club in the national
competitions because the club only reached one goal, the Portuguese League Cup, and, despite having ended the league in the 2nd position, it did so with 21 points behind the 1st place, FC Porto. In the European competitions, thought, Benfica reached the semi-final of the UEFA Europa League.
Season 2011/2012: This was a similar season to the previous one because the club
ended, again, the league in the 2nd position and also won the Portuguese League Cup. The main difference was in the European competitions because the club reached the quarter-finals of the UEFA Champions League, which is the UEFA’s main football club competition.
Season 2012/2013: This was an atypical season for the club. In this season, Benfica was
a strong competitor until the end, but lost 3 competitions in about one week. After being the league leader in a large part of the season, Benfica lost the championship in the last round to its rival, FC Porto. In the European competitions, Benfica reached the final of the UEFA Europa League. It was the 9th European final overall for Benfica, the first since the 1990 European Cup Final. The last competition that Benfica lost in this season was “Taça de Portugal”, the traditional domestic Cup, after reaching the final 9 years after its last presence.
Season 2013/2014: This was a highly distinct season when compared with the previous
ones. In this season, Benfica won all the internal competitions: Portuguese Championship, “Taça de Portugal” and Portuguese League Cup. In what concerns the European competitions it was also a positive season because Benfica reached, for the second consecutive year, the final of the UEFA Europa League but lost again the final match.
Season 2014/2015: This season started with a high distrust by the fans in general
because during the summer transfers market the administration sold 7 of the best players of the team. Despite this, and with some in-transfers of new players arriving, Benfica achieved a very important win in the league becoming back-to-back Portugal champion, an achievement the club had missed for the last 31 years. Beside the championship, Benfica also won, for the second consecutive year, the Portuguese League Cup. The major disappointment of this season was the European competitions where the club was eliminated in the group stage of UEFA Champions League.
Season 2015/2016: This season also started on a hard way but this time for different
reasons. Benfica’s coach, Jorge Jesus, has left the club to join the historical rival Sporting CP. A new coach, Rui Vitória, was hired. Also in the pitch it wasn’t a good start for the club with some bad results in the pre-season and in the first games of the championship. Although, the team moved up and improved and ended the season winning again the Portuguese Championship, becoming triple champions, and had a great performance on the UEFA Champions Leagues reaching the quarter-finals of the competition.
Over the years, this board of directors developed a strategy to take advantage of the fact that Benfica is the most popular club in Portugal with about 6 million supporters in Portugal and 14 million in the whole world.
Casas do Benfica: The so called “Casas do Benfica” (“Benfica’s Houses” in English) is a
project developed to allow a greater proximity and connection between the club and its supporters and associates. In the present, there are around 220 Houses spread all over
the world. Besides Portugal, these houses are located in 12 other countries: Australia, Belgium, Canada, Cape Verde, France, Germany, Guinea Bissau, Luxembourg, Macao, South Africa, Switzerland and United States of America. The main concern of this project is the capacity to reach the supporters spread all over the world where they can watch Benfica’s games, buy Benfica merchandise, tickets for matches, among other.
Club Associates: The members of Benfica democratically elect the club president for a
four-year term by voting in each candidate list, forming the highest board of the club. They also participate in the general assemblies, submit proposals, take part in discussions, and so forth. In order to increase significantly its number of associates/members, Benfica started, in 2004, an aggressive marketing campaign, known as “Kit Sócio” (“Member’s Kit” in English). In 2006, Benfica set the Guiness World Record for the “most widely supported football club” with 160,398 paid-up members, according to the Guinness World Records. In 2014, Benfica has revalidated and established a new record as the “biggest club in the world” with about 240,000 members, according to the Guinness World Records. In August 2015, after a scheduled renumbering, Benfica lost its record after announcing that the actual members’ number was about 160,000.
Benfica TV: In December 2008 Benfica launched Benfica TV, becoming the first club in
Portugal to have its own TV channel. The creation of the club’s TV channel had always been one of the main promises that the club’s president made in his presidential campaign, as a mean for the club to better communicate with its members and supporters. In the first years of this project, Benfica TV was broadcasting mainly shows about the club and matches from other sports and youth teams. In 2011, Benfica announced that Benfica TV has ended the year’s exercise with profit for the first time. In 2013 the channel suffered a real transformation. After rejecting a new 5-year TV rights deal from Olivedesportos, the board decided to start transmitting, from season 2013/2014, the professional football team’s home championship matches on its own, becoming the first football club in the world broadcasting its own official matches. For this project to be valid, the channel needed to change its nature from free access to become a premium-paid-channel. In order to make the TV channel even more competitive and attractive, the board decided that it was necessary to buy some other valuable rights of sports contents and acquired some new contents like the English Premier League, the Italian Serie A, the French League1, the American Major League Soccer or the Ultimate Fighting Championship. Nowadays, Benfica TV has about 300,000 subscribers, it’s fully broadcasted in 12 countries and in 2014 it had revenues of about 30 Million €. Although, in December 2015, Benfica SAD announced that has reached an agreement with NOS, one of the biggest Portuguese media and telecommunications company and also main sponsor of the Portuguese Football League called “Liga NOS”, to the sale of the television broadcasting rights of the principal professional football team of Benfica SAD’s home games of the Portuguese Football League, Liga NOS, as well as the transmission and distribution rights of Benfica TV channel. The contract will start in season 2016/2017, being initially a three years deal that can be renewed, by decision of either party, until a total of 10 sports seasons that can reach a total financial amount of 400 Million €, divided into progressive amounts. This contract will force to a strong change in the SAD’s politics for the channel as it will lose almost all of its more attractive contents. Benfica SAD expects to overcome, with this contract, the revenues that would have with the previous politic.
Cosme Damião Museum: One of the main desires of the president Luís Filipe Vieira
always was the construction of a new and modern club’s museum. On July 2013 that ambition was fulfilled with the grand opening of the club’s museum, called Cosme Damião Museum, in honor of the club’s founder, Cosme Damião. Only a year later of its inauguration, the museum received the “Portuguese Museum of the Year 2014 Award”.
Social Responsibility: Since its foundation that the club has a high impact in the
Portuguese society. With this big responsibility, the club always had programs to help the most in need. In 2009, it was founded “Fundação Benfica” (Benfica Foundation, in English) with the purpose of developing integrated projects to prevent deviant behaviors and promoting educational success of children as determinants of social mobility.
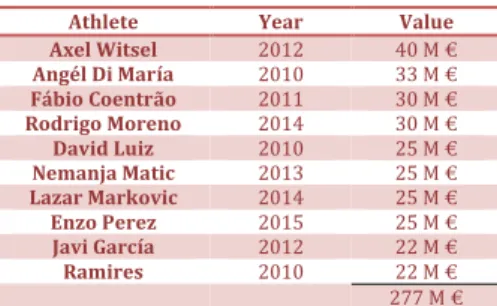
As mentioned before, firstly, the board of Benfica SAD decided to invest mainly in infrastructures, and later in talented players. This investment strategy led to the buildup of a high debt level but also a valuable asset base (Figure 8 and 9). To face all the costs and liabilities that come hand in hand with this strategy, the club designed a strategy to have extra gains with player transactions. A highly specialized scouting network spread all over the world identifies talented, and mainly unknown, players that are liable to evolve and, in the future, bring gains, both sport and financial, for the club. This has been a well succeeded policy and there are many examples of players that were bought relatively cheap and sold in millionaire transactions (Table 3).
Figure 8: Benfica SAD Asset Evolution 2012-2015
(at 30-06 of each year) Values in €
Source: SAD Report
390 000 000 400 000 000 410 000 000 420 000 000 430 000 000 440 000 000 450 000 000 2012 2013 2014 2015
Figure 9: Benfica SAD Debt Evolution 2012-2015
(at 30-06 of each year) Values in €
Source: SAD Report
410 000 000 420 000 000 430 000 000 440 000 000 450 000 000 460 000 000 2012 2013 2014 2015
Table 3: Biggest Benfica’s athletes transactions until
2015
Athlete Year Value
Axel Witsel 2012 40 M € Angél Di María 2010 33 M € Fábio Coentrão 2011 30 M € Rodrigo Moreno 2014 30 M € David Luiz 2010 25 M € Nemanja Matic 2013 25 M € Lazar Markovic 2014 25 M € Enzo Perez 2015 25 M € Javi García 2012 22 M € Ramires 2010 22 M € 277 M € Source: Transfermarket
5
Recently, the board has decided to change a bit the strategy followed until here. In order to reduce costs and to monetize the significant investments that have been made (both in human resources and logistics, innovation and financial, to transform the high level training center, “Caixa Futebol Campus”, in the “Best Academy of the Year” in the World according to Global Soccer on 15 December 2015), the board decided that it was time to start to, gradually, incorporate in the main professional football team, the most talented players that are formed in the club’s center and, with this, reduce some costs related with new player signings. This is a strategy that will take time to affect significantly the club’s financials.
Since its first days of existence, Benfica is a worldwide recognized club. Regarding this fact, the board always developed a strategy for the club that was capable to overcome the national boundaries. Recently, Benfica signed a main sponsoring deal with one of the main airlines company in the world, Emirates, becoming a member of an elite group of major world clubs bearing on their jerseys Emirates as main sponsor. This is all part of an internationalization strategy that the board has been following in the past recent years being always trying to find new markets and revenue sources. For the next few years, the club has planned to start expanding its brand to other markets like the Asian, American and Middle East.
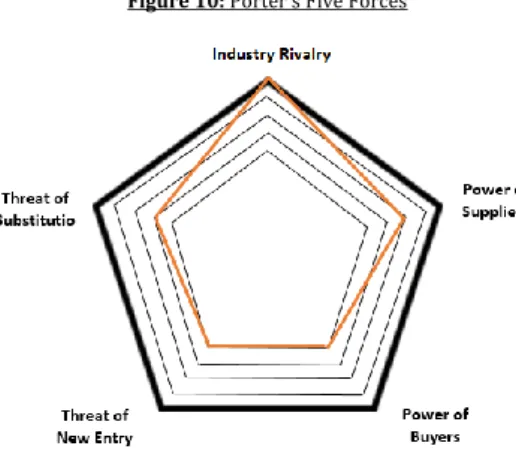
Porter’s Five Forces
Porter’s Five Forces is a framework analysis to the level of competition within an industry and business strategy development. This analysis includes two forces from vertical competition, power of suppliers and power of buyers, and three from horizontal competition, industry rivalry, threat of substitution and threat of new entry.
Industry rivalry (High)
At national level, Benfica has the traditional rivals, Sporting CP and FC Porto. When comparing the clubs, we can verify some equilibrium between Benfica and Porto and Sporting still at a little distance but in a growing process. In the last 6 years, Benfica and
Table 4: SWOT Analysis STRENGHTS
1. Portuguese club with the largest fan/supporters and member-base;
2. Partnerships with some of the most recognized national and international companies;
3. Portuguese club with the largest capacity to generate revenues;
4. The only Portuguese club that have appeared in Deloitte Money League and Brand Finance Football Brand; 5. High value portfolio of athletes;
6. High value physic asset: stadium, training center, museum, pavilions, etc;
7. Many points of sale and interactions (“Casas do Benfica”); 8. Many channels of communication (Benfica TV, “O Benfica”
newspaper, “Mística” magazine, among others); 9. History and achievements.
WEAKNESSES
1. High debt level;
2. Still some dependence on athlete transactions to have profit; 3. High interest expenses;
4. High expenses with athletes salaries;
5. Dependence on sports performance to reach good financial results.
OPPORTUNITIES
1. Recovery of Portuguese economy;
2. Operational Revenues are at a constant increase; 3. Export and expansion of Benfica brand to new
countries/markets;
4. Globalization of the football industry; 5. New international sponsors;
6. Process to start decreasing SAD’s debt level;
7. Development and innovative methods at the training level.
THREATS
1. Growing competition;
2. Lower investment in sports by the Portuguese Government; 3. Many companies that could be potential partners are in
financial distress; 4. UEFA Financial Fair Play;
5. Need to diversify the sources of revenues;
6. Appearance of new clubs with more economic power (most Arabic and Asian) that can buy or inflate some players that Benfica was interested in.
Source: FM edition
Figure 10: Porter’s Five Forces
Porto have won 3 Portuguese Leagues each. The rivalry for the main Portuguese competitions is relatively high.
Power of suppliers (Medium)
The suppliers’ power in Benfica is significant. The club’s main technical partner/sponsor is the world recognized Adidas. Benfica and Adidas have a long and healthy relation that is predictable to continue lasting for the following years. The other suppliers that can have a relevant part in Benfica’s business are the clubs from which Benfica buys the players to incorporate in the strategy of buy cheap, develop and sell by a higher price. The negotiation capacity of these clubs has an important role in Benfica’s business.
Power of buyers (Low)
The buyers’ power in Benfica is relatively low. The three main Benfica’s clients that are relevant to talk about are the fans/supporters, the sponsors/partners and the clubs that want to buy Benfica’s athletes. The fans are the ones that buy Benfica’s merchandise and games/season tickets. The merchandise and tickets prices are tabled and defined and it cannot be negotiated. The sponsors that have partnerships with Benfica are, normally, large and recognized companies that want to see their name linked with the brand “Benfica”. The visibility that Benfica allows their partners to have, principally in the European and Portuguese competitions, gives to the club a large negotiation capacity to reach good deals for the club. Nowadays, Benfica is capable to stablish more valuable partnerships than some years ago and not only with national but, increasingly, with international companies. Finally, the negotiation of athletes’ sales to other clubs depends, mainly, on the relevance of the referred player in the team and also on the player’s desire. The clubs that want to buy Benfica’s athletes face some difficulties in the negotiations because Luís Filipe Vieira, the president, is a difficult and recognized negotiator and always try to combine the player’s will with the club’s interest.
Threat of substitution (Medium-low)
In the last years Benfica has been gaining some power in football industry that did not had some years ago. In the present, Benfica is capable to find better players at good prices and has been closing better deals than its rivals. Recently, Benfica has also started a process to incorporate the best players from the training academy in the main football team in order to optimize the resources the club has.
Threat of new entry (Low)
In the football industry it is very difficult to enter and reach rapidly some gains. It is sometimes referred that football has barriers at entry.
7
The Statutes of Benfica SAD define a governance model comprised by a Board of Directors, an Audit Committee and the Statutory Auditor. The Board of Directors is headed by Luís Filipe Vieira, the Chairman; Rui Cunha, the Vice President; Domingos Soares de Oliveira, vowel and CEO; Rui Costa, vowel and executive director, and José Eduardo Moniz, also vowel and executive director. The Audit Committee is presided by Rui Nascimento Barreira. The Statutory Auditor of Benfica SAD is PwC.
According to this model, the Board of Directors is the governing body responsible for the Company’s management whose members are appointed and removed by the General Assembly. The supervision of the Company is responsibility of the Audit Committee and the Statutory Auditor.
The compensation plan only incorporates two members of the board: Domingos Soares de Oliveira, vowel and CEO, and Rui Costa, vowel and executive director. In the season 2014/2015, the total compensation (fixed and variable) of these two members was, respectively, 328,000€ and 230,000€, which makes a total of 558,000€. All the other members of the board don’t receive any compensation from Benfica SAD (Table 5).
Luís Filipe Ferreira Vieira is a Portuguese business man with experience in the real estate and construction sectors but no significant academic experience. Vieira was elected for the first time, by the club’s associates, president of Sport Lisboa e Benfica (the club) on 31st October 2003 and remains in this position until the present day, having been reelected 3 times. Since his first Club election, Vieira is also Chairman of the Board of Directors of Sport Lisboa e Benfica – Futebol, SAD.
Under his direction, Benfica SAD had a significant improvement, both in terms of sports results and financially speaking. In the first years of management, Benfica SAD was under one of the most struggling situations in its history. Certain developments have led Benfica SAD to reach a terrible sport and economic situation as well as the destruction of the prestigious name of the club. One of the main guidelines that the board followed to face this situation was a strong leverage policy in order to reach the necessary funds to make the investments that, in the board’s vision, were essential to the future of the club. Investments in physical infrastructures, such as the football stadium and the training center, and in highly specialized staff and athletes, were seen as fundamental for the club’s rebuild and growth. After some years with negative financial results, Benfica SAD has finally achieved positive numbers in the last 2 years, reaching 7 Million € of net profit in season 2014/2015. In sports matters, after a few years winning titles only sporadically, the professional football team is currently triple Portuguese champion (Figure 11).
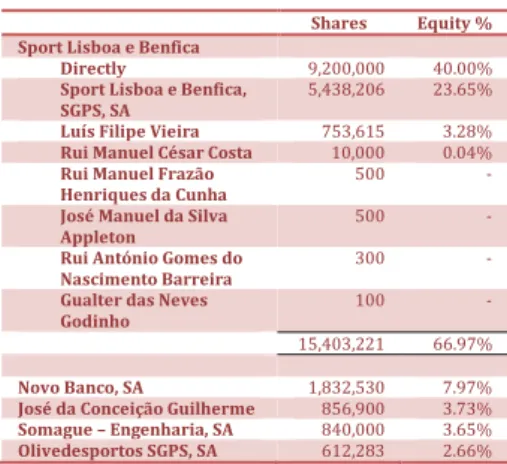
Shareholder Structure: The Club, Sport Lisboa e Benfica, is the only shareholder who
owns, directly or indirectly, more than 50% of the equity capital of the company. In its total, Sport Lisboa e Benfica owns 66.97% of the capital and voting rights of Benfica SAD. The other main shareholders are Novo Banco, SA with 7.97%, José da Conceição Guilherme with 3,73%, Somague – Engenharia, SA with 3.65% and Olivedesportos SGPS, SA with 2.66% (Table 6 and Appendix 17).
3.
Management & Corporate Governance
Table 5: Board’s Compensation Plan
Fixed Variable Total Domingos Soares de Oliveira 233 95 328 Rui Costa 230 - 230 463 95 558 (thousands €)
Source: SAD Report
Figure 11: Portuguese League Winners in the last 6
years
Source: www.zerozero.pt
Table 6: Benfica SAD Shareholder Structure
Shares Equity % Sport Lisboa e Benfica
Directly 9,200,000 40.00%
Sport Lisboa e Benfica,
SGPS, SA 5,438,206 23.65% Luís Filipe Vieira 753,615 3.28%
Rui Manuel César Costa 10,000 0.04%
Rui Manuel Frazão
Henriques da Cunha 500 - José Manuel da Silva
Appleton 500 -
Rui António Gomes do
Nascimento Barreira 300 - Gualter das Neves
Godinho 100 -
15,403,221 66.97%
Novo Banco, SA 1,832,530 7.97%
José da Conceição Guilherme 856,900 3.73%
Somague – Engenharia, SA 840,000 3.65%
Olivedesportos SGPS, SA 612,283 2.66%
Table 8. Benfica’s titles connection with economic growth
Source: FM edition
Portuguese Economic Outlook
Portugal is one of the European countries that have suffered most with the recent crisis. As well as the global world economy, the Portuguese economy has been recovering since 2013, achieving a growth rate of 0.9% in 2014 and 1.5% in 2015 (Figure 12). The economic activity was fueled through a great reduction in public consumption followed by a slowing in imports as well as a boost in exports. In 2014, GDP is mainly driven by an improvement in private consumption, which in turn increased imports above expectations. According to Banco de Portugal’s projections, it is expected that Portugal will continue its recovery, attaining in 2016 an economic growth of 1.5%, against a deteriorating international environment, decelerating business investment and resilient non-durable private consumption; of 1.7% in 2017, reflecting buoyant investment and exports, and of 1.6% in 2018, reflecting ongoing structural constraints on the potential growth of the Portuguese economy (Table 7).
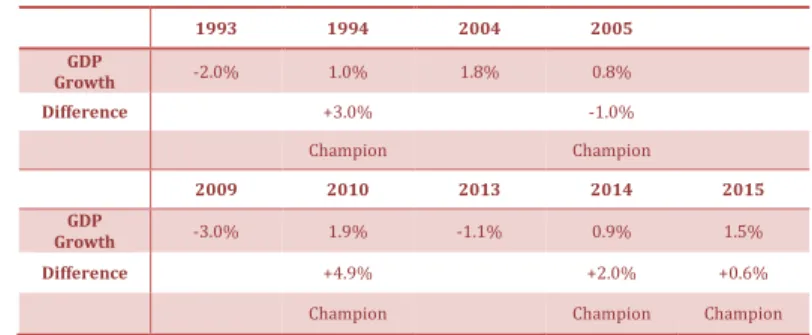
Benfica’s Titles linked with the Economy’s Growth
Coincidence or not, looking at the past 21 years, in all the years in which Benfica won the Portuguese League, the Portuguese GDP has always grown (Table 8). In fact, in four of the five national titles won in this period (1994, 2010, 2014 and 2015), the economic growth has always been higher than in the previous year (Table 8). In this period the only exception is 2005 because in 2004 Portugal hosted the EURO 2004. Regarding the last decade, the year in which the economy grew more was in 2010, expanding 1.9%, precisely a year in which Benfica won the championship. In 2014, Benfica’s championship win also had a symbolic meaning. After three years with the presence of the so called Troika, a period during which FC Porto was triple champion, the economy was always in recession (-1.3% in 2011, -3.2% in 2012 and -1.4% in 2013). The year of 2014 marks the return of growth at 0.9%. It is inevitable to make the parallel with what happened exactly 21 years ago. In 1994, the last championship that Benfica won in the twentieth century coincided with a recovery that ended the longest recession since 1984.
1993 1994 2004 2005 GDP Growth -2.0% 1.0% 1.8% 0.8% Difference +3.0% -1.0% Champion Champion 2009 2010 2013 2014 2015 GDP Growth -3.0% 1.9% -1.1% 0.9% 1.5% Difference +4.9% +2.0% +0.6%
Champion Champion Champion
Football Industry Outlook
The Industry of football is a complex and different market to analyze when compared with some other industries. Football is the most popular sport in Portugal and it’s an industry that has been growing in the past recent years. The number of federated athletes has increased from 95,000 in 2005/2006 to 135,000 in 2015/2016. One of the main constraints that many football clubs face is the large difficulty to generate revenues. As we can see in the portrait of the country´s situation, the situation of the clubs and SADs is very dependent on external revenues and exports. In other words, the weight that athlete transactions, bonuses from UEFA and sponsoring deals haves in the accounts of a “SAD” is massive. In order to get these revenues, clubs can’t in any way detract from the sporting results aimed and reached. Clubs have been designing through the years, new ways to reinvent and stimulate their capacity to generate revenues. In order to reach new sources of revenues, clubs have been exploiting new markets to expand their brands and to reach new and different sponsors.
4.
Economic and Industry Overview
Figure 13: Benfica SAD Operating Revenues/Costs without
athlete transactions 2012-2015
(at 30-06 of each year) Values in €
Source: SAD Report
0 20 000 000 40 000 000 60 000 000 80 000 000 100 000 000 120 000 000 2012 2013 2014 2015 Revenues Costs
Figure 14: Benfica SAD Operating Income 2012-2015
(at 30-06 of each year) Values in €
Source: SAD Report
-10 000 000 0 10 000 000 20 000 000 30 000 000 40 000 000 2012 2013 2014 2015
Without athletes transactions Whit athletes transactions
Figure 12: Portugal Annual GDP Growth Rate
Source: OECD Data
-1,1% 0,9% 1,5% 1,2% 1,9% 2,1% -2,0% -1,0% 0,0% 1,0% 2,0% 3,0% 4,0% 2013 2014 2015 Portugal OECD
Table 7: Portuguese Economy Projections
9
Competitors
The main competitors that Benfica has are FC Porto and Sporting CP. These are the principal and historic rivals that Benfica has been facing over the years. It is appropriate to take an overview on the main financial results and indicators of these clubs and compare it with Benfica SAD´s results.
In the season 2014/2015, Benfica SAD registered an Asset value of 430.2 Million €, Liabilities with a value of 429.6 Million € and an Equity Value of 0.6 Million €. The consolidated Net Income reached a value of 7.1 Million €, becoming the second consecutive year achieving positive annual income. It is important to make a differentiation between the Operating Income with and without athlete transactions. The consolidated Operational Income, including athlete transactions, exceeded 30.4 Million € while the Operating Income excluding athlete transactions did not reach positive numbers, with a value of -4.5 Million €. The Operating Revenues, without athlete transactions, reached a value of 102 Million €, being the second consecutive year to exceed the 100 Million € barrier (Figures 13 and 14). This is a boundary value that none of its competitors have ever reached. The main conclusion possible to take from this data is that despite the large amount of operating earnings that Benfica SAD is capable to reach, the club is still dependent of athlete transactions to face all the operating costs and achieve good results.
Sporting SAD had, in season 2014/2015, an Asset value of 235.5 Million €, 228.4 Million € in Liabilities and an Equity value of 7.1 Million €. It is important to state that Sporting SAD is currently under a debt restructuring process with its creditors and has about 127.9 Million € in Mandatorily Convertible Securities (VMOC in Portuguese). Considering the financial results, Sporting SAD had Operating Income, excluding athlete transactions, of 6.3 Million € while the Operational Income including athlete transactions were about 23.5 Million €. The Operating Revenues, without athlete transactions, reached a value of 58.4 Million € while the Operating Costs, without athlete transactions, were about 52.1 Million €.
FC Porto SAD registered, in season 2014/2015, an Asset value of 359.2 Million €, Liabilities of about 276.1 Million € and an Equity value of 83.1 Million €. Considering the financial results, Porto SAD had Operating Income, including athlete transactions, of about 34.4 Million €. The Operating Revenues, without athlete transactions, were lower than its costs having a value of 93.6 Million € and 110.3 Million €, respectively, and consequently negative Operating Income, excluding athlete transactions, of -16.7 Million €.
International Recognition
It is also relevant to refer that in the last years Benfica has had an increasing recognition by international entities.
Benfica is the only Portuguese club to ever appear in the “Deloitte Football Money League” and in the “Brand Finance Football 50”.
The “Deloitte Football Money League” is a study developed annually by Deloitte UK which aims to show which are the European clubs with higher revenues and what their main sources of income are. In the 2007 report, considering season 2005/2006, Benfica appeared for the first, and last until the present, in the top 20 of this “Money League”. Since then, despite of the fact that Benfica’s revenues increased significantly, the club has appeared 6 times more (2008, 2011, 2012, 2013, 2014 and 2015) on the report but always below the top 20. This can be justified with the globalization process and the high development that the football industry has been facing. (Figure 14 and tables 9, 10 and 11)
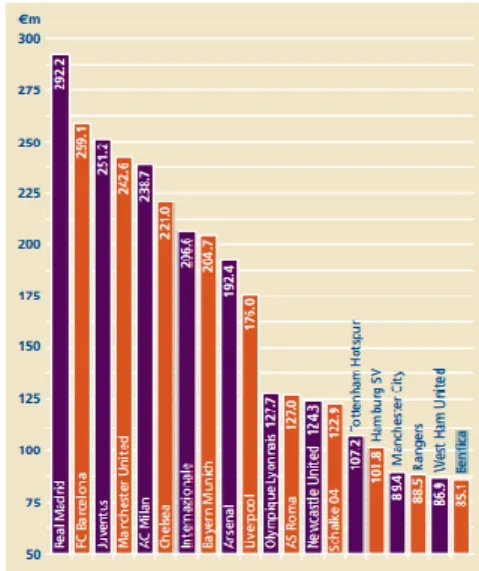
The “Brand Finance Football 50” is a study developed by Brand Finance that analyses and ranks football clubs by the value of their brands, defined as the trademark and associated intellectual property of a club. Since the first “Football 50” report in 2007, Benfica has been included in it for almost every year. In 2008 Benfica appeared in the 16th position of the ranking with a brand value of 53 Million € while in the last report of 2016 Benfica is ranked in the 47th position with a brand value of 86 Million €. This decline in the ranking, despite the higher valuation, is justified with the evolution of the football business and mainly with the strength of clubs from the major football leagues headed by the English Premier League, the most valuable football league in the world.
Figure 15: Deloitte Money League 2007 Top 20
Source: Deloitte analysis
Table 9: Deloitte Money League 2008 Under Top 20
Source: Deloitte analysis
Table 11: Deloitte Money League 2015 Below Top 20
Source: Deloitte analysis
Table 10: Deloitte Money League 2013 Under Top 20
As was said before, Benfica is the most titled Portuguese club, with more supporters and with the largest capacity to generate revenues, both operating and athlete transactions. The recent sporting success gives the club the lead in the Portuguese football.
It is expected that SLBEN will reach its best results ever, in terms of revenues, during the forecast period.
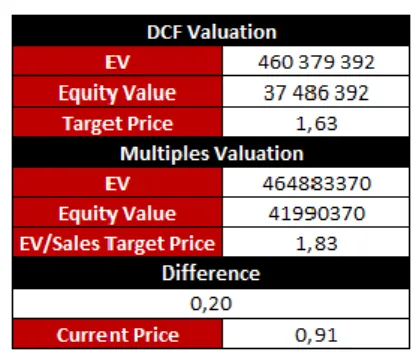
With a target price of € 1.63 and an upside potential of 79% at the end of 2016, our recommendation for Sport Lisboa e Benfica – Futebol, SAD stands for BUY, using the DCF model. Using the relative valuation method, the Comparable Multiples, we reached a target price of € 1.83, what supports our view of an upside potential level. We consider that the results of the absolute method are more accurate than the results from the relative method and for further conclusions we consider the DCF model results. Both methods indicate that SLBEN is currently undervalued (Table 12). The major reasons for the existence of an upside potential consists in the growing revenues over the years and the unique capacity of generating revenues that Benfica SAD has, when compared with other Portuguese SADs, as well as the sporting success that the company has had which is directly linked with the financials results.
We predict that the EPS of SLBEN will be positive in every year except one because of the loss verified in that year. It has its highest value in 2016 having a EPS of 0.62 (Figure 16).
The discount rate applied to the future cash flows in the DCF valuation is the Weighted Average Cost of Capital that was deducted for SLBEN. This rate is descripted more detailed in the next section.
For the Multiples Valuation it was selected a group of football clubs that are listed and comparable with SLBEN to compute the pretended multiples, EV/EBITDA, EV/Sales and P/EPS. We could only take conclusions with the EV/Sales multiple. It is important to refer that for Sales we mean the Operating Income and Earnings without Athlete Transactions. Besides the other three Portuguese clubs that are listed we choose other three foreign listed clubs.
In the football industry, the major risk that companies are exposed to is the sports risk. In fact, a year of a bad performance in the national and international competitions can affect strongly the financial results. But this is a risk difficult to measure. Because of that, we considered that is realistic to assume that in a 5-year period it is possible to have a year where the football team can underperform. In our forecast, that year is 2018.
In order to compute the Risks to the Price Target we computed a sensitivity analysis and a Monte Carlo simulation. For the sensitivity analysis we only used variables inherent to the DCF model. For the Monte Carlo we also have considered some variable intrinsic to the DCF model but also with one of the most relevant costs, Personal Expenses.
The Monte Carlo simulation gave us a mean of the price target equal to the DCF target price, € 1.63, with a probability of 56% of our recommendation being accurate (Appendix 15).
5.
Investment Summary
Figure 16: Benfica SAD EPS during the forecast period
Source: FM estimates 0,62 0,09 -0,16 0,31 0,06 -0,20 0,00 0,20 0,40 0,60 0,80 2016F 2017F 2018F 2019F 2020F
Table 12: Valuation Summary
11
To evaluate SLBEN we used two different valuation methods, an absolute and a relative valuation model: the Discounted Cash Flow (DCF) and the Comparable Multiples, respectively.
For our absolute approach we used the Discounted Cash Flow (DCF) model. This method is one of the most used in company valuations and it is also the most appropriate for this company due to the fact that this is a listed company and the amount of available information that we found led us to reach the company’s enterprise value. The Dividend Discount Model is not suitable for this company because, normally, Benfica doesn’t distribute dividends. It was also computed the Free Cash Flow to the Firm (FCFF) of the group in order to reach the enterprise value. The Free cash flow to Equity (FCFE) is not suitable for this company since its capital structure is changing.
For the relative approach we used the Comparable Multiples model. To develop this model and to achieve the target price, were considered as comparable companies the two main rivals, FC Porto and Sporting CP, the other Portuguese club that is listed, SC Braga, and also three foreign clubs, Juventus from Italy, Olympique Lyonnais from France and Celtic Glasgow from Scotland.
Forecast Analysis
For the year of 2016 we considered mainly the interim third quarter report of season 2015/2016 to make our projections. We think that with this valid information we can predict it more precisely for 2016.
The Operating Income and Earnings are divided in two: Services and Other
Operating Income and Earnings. For Services we considered that from 2017 until 2020
it will round a value of 85 Million €. The Other Income and Earnings is an item that is highly linked with the UEFA Premiums. Because of that, after 2016 being an excellent year in what that concerns, we considered that it will not outcome the 40 Million € boundary and we varied that item over the years because it is possible that Benfica can underperform, some year, in the UEFA’s competitions. (Figure 17)
In the Operating Expenses and Losses, we used the percent of sales method to predict it for the next years, except the sub-item of Personnel Expenses. As it is the main expense, we assumed that it will be around 60 Million € annually.
In the Athlete Rights section, we also did some assumptions. For the Amortizations
and Impairment Losses w/ Athlete Rights we considered some fixed amounts that we
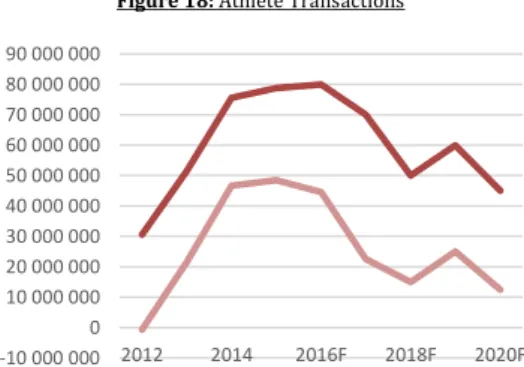
believe that are predictable, being higher in the first two years, 2016 and 2017, and lower in the last years until 2020. The Revenues w/ Athlete Transactions, being one of the main sources of revenues, were projected by the same logic, being assumed some values that we believe that will happen with some certain. (Figure 18)
The Financial Revenues and Expenses are not expected to change significantly in the next years. The Revenues assume a constant amount of 4 Million € while the Expenses will vary around an amount of 20 Million €, being expected to be lower. (Figure 19)
The Asset of SLBEN is expected to vary over the next years. The Intangible Asset is a very important item of this type of companies because is where the athlete rights are accounted. (Figure 20)
The Equity of SLBEN is expected to change, in a positive way, over the next years. In the past years, Benfica SAD had negative Equity but it is expected that, with the forecasted improvement of the results, it will increase to values around the 20 Million €. (Figure 21) The Liabilities are a sensible point in SLBEN management because it has grown significantly over the last years. It is expected that it will stabilize and even decrease in the next years. (Figure 22)
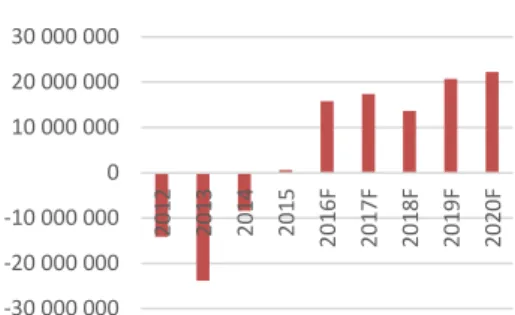
To compute the Net Working Capital (NWC) and its changes we need to subtract the Current Liabilities to the Current Asset (liquid of Cash & Equivalents). Since the Current Liabilities that were forecasted for the period are always higher than the Current Asset we will have a negative NWC. Although the NWC variations are not negative in all years. As we can see in table 13, we can only verify negative variations in the forecasted years of 2017 and 2020.
6.
Valuation
Figure 17: Op. Earnings: Services vs Other(at 30-06 of each year) Values in €
Source: SAD Report and FM estimates
0 20 000 000 40 000 000 60 000 000 80 000 000 100 000 000 120 000 000 140 000 000
Services Other Op. Earn.
Figure 18: Athlete Transactions
(at 30-06 of each year) Values in €
Source: SAD Report and FM estimates
-10 000 000 0 10 000 000 20 000 000 30 000 000 40 000 000 50 000 000 60 000 000 70 000 000 80 000 000 90 000 000 2012 2014 2016F 2018F 2020F
Athlete Trans.. Revenues Amort.&Imp. w/ Athletes
Figure 19: Financial Revenues vs Expenses
(at 30-06 of each year) Values in €
Source: SAD Report and FM estimates
-30 000 000 -25 000 000 -20 000 000 -15 000 000 -10 000 000 -5 000 000 0 5 000 000 10 000 000
Fin. Revenues Fin. Expenses
Figure 20: Benfica SAD Asset
(at 30-06 of each year) Values in €
Source: SAD Report and FM estimates
390 000 000 400 000 000 410 000 000 420 000 000 430 000 000 440 000 000 450 000 000 460 000 000
Table 13: Benfica SAD NWC
(at 30-06 of each year) Values in €
Source: SAD Report and FM estimates
We computed the D&A and CapEx of Tangible and Intangible Assets separately. The Depreciations and Amortizations of Tangible Assets follows, for the forecast period, the same line that in the historical period. The values of D&A are similar for the forecast period.
The CapEx in Tangible Assets were computed by adding the depreciations of the year to the change in the value of the Tangible Asset from the last year.
For the Intangible Assets we used the Net Investment in Intangible Assets in the DCF formula to make it simpler. With this, we have in the same item the depreciations of the assets and the investment made on it.
DCF Valuation
The result of the DCF valuation was a target price of € 1.63 for the end of 2016 (Table 14), representing an upside potential of 79%. In our perspective, SLBEN is currently
undervalued, so, our recommendation, based on the DCF valuation, is to BUY. More
details about the DCF Valuation can be seen below and in Appendix 11 and 12.
We started by computing the Free Cash Flows to the Firm (FCFF) for the forecasted years.
The formula used to compute the FCFF is the one below:
FCFF = EBIT * (1-Marginal tax rate) + Depreciations/Amortizations – CapEx – Net Investment in Intangible Assets – Net increase in NWC
Table 15: Benfica SAD FCFF Calculations
(at 30-06 of each year) Values in €
Source: SAD Report and FM estimates
Table 16: Benfica SAD FCFF
(at 30-06 of each year) Values in €
Source: SAD Report and FM estimates
DCF Assumptions
The Valuation Period considered was 5 years (from July 1, 2015 until June 30, 2020). After this valuation period, the Terminal Value is then added (it’s the forecasted FCFF of 2020, multiplied by 1 plus the assumed growth rate and divided by the discount rate
Figure 21: Benfica SAD Equity
(at 30-06 of each year) Values in €
Source: SAD Report and FM estimates
-30 000 000 -20 000 000 -10 000 000 0 10 000 000 20 000 000 30 000 000 201 2 201 3 201 4 201 5 201 6F 201 7F 201 8F 201 9F 202 0F
Figure 22: Benfica SAD Liabilities
(at 30-06 of each year) Values in €
Source: SAD Report and FM estimates
340 000 000 360 000 000 380 000 000 400 000 000 420 000 000 440 000 000 460 000 000 Table 14: DCF Output Values in €
13
minus the growth rate). The growth rate (g) considered was 0.00%. This rate is based in the low estimates of economic growth for the future and that the level of revenues that the company is expected to achieved in 2016 is very difficult to surpass in the following years.
Because in the DCF model we are discounting the free cash flow that will be paid to both debt and equity holders, the Discount Rate that should and was considered was the
Weighted Average Cost of Capital (WACC) of SLBEN. This rate is the average cost of
capital the company must pay to all its investors, both debt and equity holders. This rate is assumed to be constant over the period due to the constant capital structure target that was considered for the company. The formula used to estimate the company’s WACC rate was the following:
WACC = (E/(D+E)) * Re + (D/(D+E)) * Rd * (1-t)
The Cost of Equity (Re), which is the return that stockholders require to invest in a company was computed using the Capital Asset Pricing Model (CAPM). The CAPM theory says that the expected return equals the rate on risk-free security plus a risk premium. We used a modification of the CAPM which includes a Country Risk Premium (CRP) due to the fact that Portugal is considered a peripheral country. The formula used to compute the Cost of Equity was the following:
Re = Rf + β * MRP + CRP
For the Risk Free Rate (Rf) we used the 10 year Portuguese Government Bond. The rate considered was observed on June 30, 2016 and it is 3.006%.
For the Beta (β) we used the available information on Reuters.com, that we consider reliable, of a 1.25 beta.
For the Market Risk Premium (MRP) we used the Aswath Damodaran's calculations, from July 2016, of 6.25%.
For the Country Risk Premium (CRP) we also used the Aswath Damodaran's calculations, from July 2016, of 3.92%.
Finally, the total estimated a Cost of Equity (Re) is about 14.74%.
The Cost of Debt (Rd) refers to the effective rate a company pays on its debt. It was assumed a 5% rate because it is the mean of interest expense over debt that the company has paid over the years and also the mean of the rates of the last issued bond loans.
The Tax Rate (t) considered was 21%, which is the income tax rate that is referred in the company reports. Although, in the past years, the company was taxed with lower rates manly due to bad results over the years. As we predict that the company will improve its results, will pay the tax rate imposed by law to this type of companies.
After all this assumptions, we were able to estimate the WACC of SLBEN and we reached a rate of 7.19%.
To compute the Terminal Value (TV) we assumed a Perpetuity WACC of 7.19%, and a Perpetual Growth Rate (g) of 0.00%. The objective of the TV is to estimate the value of the remaining free cash flow beyond the forecast period. The formula used was the following:
TV = [FCFF * (1 + g)] / [(WACC – g)]
After all these procedures we discounted each year’s FCFF at the WACC rate using the following formula: 𝐸𝑉 = ∑ 𝐹𝐶𝐹𝐹𝑛 (1 + 𝑅𝑤𝑎𝑐𝑐)𝑛 𝑡=𝑛 𝑛=1 + 𝑇𝑉 (1 + 𝑅𝑤𝑎𝑐𝑐)𝑛 Table 17: WACC
After this, we have to subtract the Net Debt to the Enterprise Value in order to reach the Equity Value and, after all, divide it by the total number of shares outstanding. More information can be found in Appendix 10.
Comparable Multiples Valuation
In order to obtain a relative valuation, by the Comparable Multiples method, we considered the multiples EV/EBITDA, EV/SALES and P/EPS.
Given the specificities of this industry, for the multiples EV/EBITDA and P/EPS we obtained values with large differences between each other as well as negative values in the calculations of the ratios. For these reasons we decided not to include these multiples in our valuation because of the inconsistent results we have reached. More detailed information about this is shown in Appendix 10 and 13.
For the EV/Sales we reached a target price of € 1.83, what would make an appreciation of 100.62% (Table 18).
These results strengthen the prediction that SLBEN stocks are currently undervalued. Although, it is important to refer that this model resulted in a very optimistic prediction for the target price with an exaggerated upside potential. We still consider that the DCF valuation provides a better and more realistic estimation of SLBEN target price and value and our recommendation is still BUY.
Comparable Multiples Assumptions
There are only 27 clubs in Europe that are listed in stock exchange including only 13 from the top five leagues (England, Spain (having none), Italy, France and Germany). From this sample, there are some companies that can not be compared with Benfica SAD. Manchester United, for example, makes yearly more than 500 Million € in operating revenues. More details about the companies’ selection can be found in Appendix 13. The selected clubs were: the two main rivals, FC Porto and Sporting CP, the other Portuguese club that is listed, SC Braga, and also three foreign clubs, Juventus from Italy, Olympique Lyonnais from France and Celtic Glasgow from Scotland (Table 19).
Table 18: EV/Sales Output
Source: FM edition
Table 19: Comparable Companies