IOP Conference Series: Materials Science and Engineering
PAPER • OPEN ACCESS
E-City Planning: Geospatial Data Technologies
To cite this article: Olga Goncalves and Ana Virtudes 2019 IOP Conf. Ser.: Mater. Sci. Eng. 603 022025
WMCAUS 2019
IOP Conf. Series: Materials Science and Engineering 603 (2019) 022025
IOP Publishing doi:10.1088/1757-899X/603/2/022025
E-City Planning: Geospatial Data Technologies
Olga Goncalves1, Ana Virtudes2
1Civil Engineer, University of Beira Interior, Covilhã, Portugal
2C-MADE Centre of Materials and Building Technologies, University of Beira Interior, Covilhã, Portugal
Abstract. The use of new technologies such as ICT (information and communication
technologies) is already a reality in several domains of the scientific development. In this context, this paper aims to present an example of the use of ICT in the spatial planning domain at the local level. It is focused on the e-City Planning, based on the example of the municipal master plan, which is the most iconic figure of the planning system framework in Portugal. The conclusions show that the uses of e-platforms and e-City Planning instruments have several advantages, considering the geospatial data technologies. Among these advantages, there is the sharing of knowledge in between local authorities and the citizens in general, who have direct access to the spatial planning contents information, at the distance of a click. With e-City Planning tools and platforms, it is possible to update the planning strategies automatically and therefore, according to the real territory needs, opportunities, and features.
1. Introduction
In recent years the implementation of Geographic Information Systems (GIS) in the domain of city planning by local authorities has been a reality. Despite some barriers, municipalities feel that the use of GIS is a prime tool for urban planning and local power decision making process.
Nowadays, GISs are essential in city planning approach and in management of the territory, as well as in the day-to-day life of citizens in general. On the one hand, GISs allow having access to several geo-referenced pieces of information which are coming from the local level of the spatial planning process with high standards of accuracy. On the other hand, they allow gathering knowledge by cross-layers of complex information, coming from various sources. Consequently, they promote more efficient analysis and the determination of solutions more accurate and appropriate to the reality and more understandable for the users.
2. ICT at city planning
2.1. Meanings and tools of Geographical Information Systems
Increasingly, citizens do research or analysis using Geographical Information Systems (GIS), even without having taken it for granted. For example, they know the best way to get to a nearby city, analyse and cross-reference a prospective business, or to obtain references for a better choice. Thus, GIS should be a necessary component in a wide system for the management, analysis and dissemination of information, at the service of all users.
WMCAUS 2019
IOP Conf. Series: Materials Science and Engineering 603 (2019) 022025
IOP Publishing doi:10.1088/1757-899X/603/2/022025
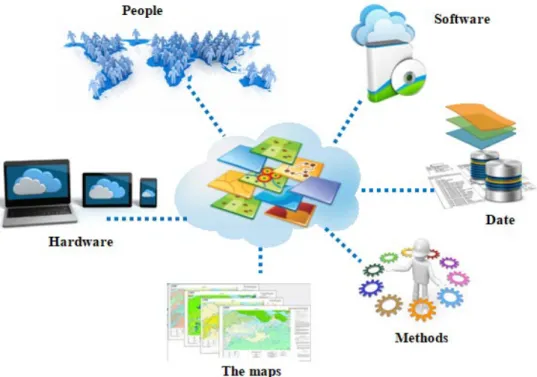
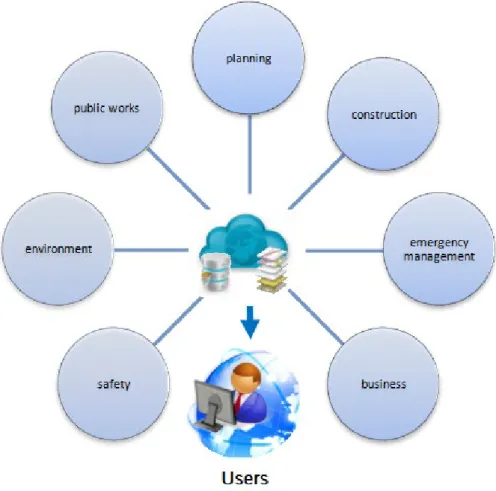
A GIS is a structure composed of hardware, software, people and data, which together make it possible to locate geographically, store, search and cross-reference the characteristics of the elements present in the real world. They allow the integration of the information in order to produce new information (Figure 1 and 2) [1].
Figure 1. Composition of a Geographical Information System (GIS)
Figure 2. Cycle of GIS around the real world
Data collection Data entry manipulation and analysis of data Information for decision making Intervention in the territory
WMCAUS 2019
IOP Conf. Series: Materials Science and Engineering 603 (2019) 022025
IOP Publishing doi:10.1088/1757-899X/603/2/022025
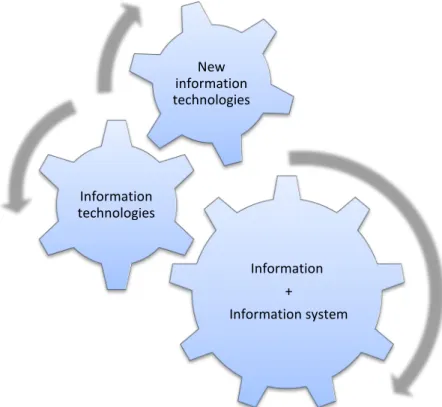
GIS has gained a very positive boost with the current technological evolution, boosted by New Information Technologies (ICT), namely the Internet and mobile communications. Geographic Information systems are nothing more than the gear of the composition of Information, Information System, Information Technologies and New Information Technologies (Figure 3).
Figure 3. Gear mechanism of the composition of a GIS
Information: a set of data that, when provided in a coherent and anticipated way, contributes to the knowledge of any individual, being abler to develop an activity or to consider taking a particular action or decision. Information is only accessible when connected to an Information System (SI), which associates, stores, processes and makes available information relevant to a particular organism. Being the information accessible and useful for those who want to use it, including politicians, technicians, employees or citizens in general, the information system can be automated or manual, which covers people, machines and / or methods with the central aim of disseminating information. Information Technology (IT) is defined as the set of all activities and solutions provided by computing resources that provide the production, storage, transmission, access, security and use of information.
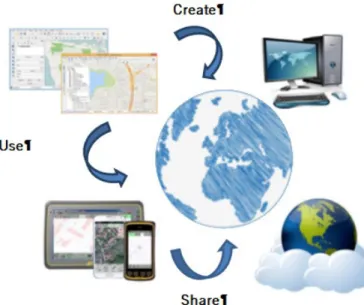
New Information Technologies (NTI) cover the new modes of satellite communication, the democratization of micro-computing and multimedia technologies, as well as the generalization of global networks such as the Internet [2]. The introduction of New Information Technologies allowed access to information about the municipality where one lives, works, and moves, with the feasibility of knowing the political and technical proposals about the present and future of this municipality. [2]. In recent years the languages of systems and technology have changed, with the introduction of e-commerce and e-business. More and more e-commerce and business from home using the internet, making it common these days, the new terms "e-" have introduced new importance for Information Technologies and Information Systems, increasing their interest among organizations and bodies. In summary, the Geographic Information Systems have a unique premise with the real world that is: Create - Share - Use the information (Figure 4).
Information + Information system Information technologies New information technologies
WMCAUS 2019
IOP Conf. Series: Materials Science and Engineering 603 (2019) 022025
IOP Publishing doi:10.1088/1757-899X/603/2/022025
Figure 4. Function of GIS in the real world
2.2 Structure and contents of data
What differs from Geographic Information Systems of other Information Systems is its ability to manage geographical information based on topology, being one of the basic and fundamental characteristics of its operation. That is, a GIS is a database system with specific skills to interrelate with referenced spatial data. It consists of a mathematical procedure that allows the operations of spatial relations, facilitating the storage and treatment of the data in a more efficient way, still allowing the accomplishment of complex analytical functions. Thus, Geographic Information Systems should ensure three information components [3]:Space: a component that describes the space occupied by the phenomena represented, usually referenced to a coordinate system. These phenomena are classified into one of three types of basic elements (points, lines, polygons); Attributes: spatial objects have a set of associated properties that indicate their nature; Metadata: describes a set of structured data that identifies the data of a given document and which can provide information about the mode of description, administration, legal requirements of use, technical functionalities, use and preservation, thereby ensuring correct use of Geographic Information.
WMCAUS 2019
IOP Conf. Series: Materials Science and Engineering 603 (2019) 022025
IOP Publishing doi:10.1088/1757-899X/603/2/022025
Thus, the spatial data used in the GIS environment, in the representation of the geographic reality, are grouped into two categories: cartographic data (graphic component) and attribute data (non-graphic component). The (non-graphical component (maps) describes the location, geo(non-graphic objects, and spatial relationships between these objects, and may include coordinates, codes, and symbols that define map-specific map elements. The attribute data, or non-graphical or alphanumeric component (tables), describe the facts and phenomena, social and natural, reported on a map, and can also be called textual or attributive since they represent the characteristics, qualities or relationships of these components at the level of cartographic representation. The connection of the two components, graphical and non-graphical, is processed at the level of a GIS, by sharing common codes in the two bases, which univocally relate the elements of each category (Figure 5).
The graphical data in the GIS are organized in the form of layers or layers of information, where each layer contains information underlying a theme or class of information (e.g. contours, road, river network, equipment). They are positionally related to each other through a common coordinate system (Figure 6). This way of storing graphical information gives the process high flexibility, allowing selecting specific information, or fractions of information, according to the intended objectives. It uses several resources for operations involving the overlapping of two or more themes, allowing the user to compose and model the final product according to the objectives established for each project.
Figure 6. Visualization of spatial data in layers - raster and vector
2.3 Procedures
Processing GIS designates the authors [4] Fischer, Scholten and Unwin, by “perceived geographical reality”, where the process of abstraction and sorting information results in decomposition and categorization of the different elements that comprise it (graphics, not graphic or attributive). It goes through four stages of processing: data entry; storage, retrieval and data management; analyse; data output [5](Figure 7).
At the initial stage of the process - data entry, we will proceed to the analysis and selection of the typology of spatial data that result from the decomposition and categorization of the “perceived geographical reality”. In this stage, the question should be asked which digital graphic base model best represents the research area.
WMCAUS 2019
IOP Conf. Series: Materials Science and Engineering 603 (2019) 022025
IOP Publishing doi:10.1088/1757-899X/603/2/022025
Figure 7. Basic functions of GIS data
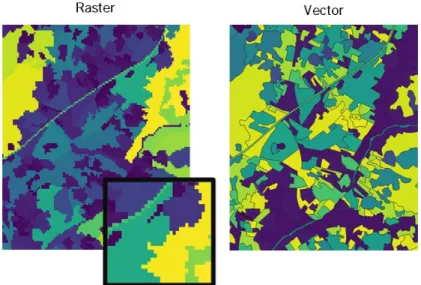
There are two main ways of representing graphical data in GIS: the matrix model and the vector model. In the vector model, should be questioned “all objects or conditions in the real world can be accurately represented on a map through points, lines, areas or surfaces” [5]. In the matrix or raster model, space is regularly divided into cells that make up the array of cells (pixels) (Figure 8).
WMCAUS 2019
IOP Conf. Series: Materials Science and Engineering 603 (2019) 022025
IOP Publishing doi:10.1088/1757-899X/603/2/022025
Figure 8. Comparison of raster and vector data models
It is important to emphasize the existence of an indispensable task and that is of the utmost importance, it consists of the compatibilization of graphical and non-graphical data, produced in different formats, scales and projection systems. This task which is fundamental for guaranteeing the success of the other stages of the system is usually quite time-consuming and a routine, consuming large amounts of time in data processing and compatibility and “cleaning”. Whenever possible, involve automated processes in order to minimize the introduction of possible errors, very common in the initial stages of contact with GIS. Also in the pre-processing phase, the validity of the “geocodes” should be checked and ensured, in order to ensure the interconnection of the different categories of data in the system [5].
WMCAUS 2019
IOP Conf. Series: Materials Science and Engineering 603 (2019) 022025
IOP Publishing doi:10.1088/1757-899X/603/2/022025
At the second level of the process: Data storage, retrieval and management subdivides the input data into two components: Spatial component, where the graphic data is placed, with location and topology information; Non-spatial component, which includes non-graphical data, characterizing the different elements involved in the phenomenon to be investigated. Data storage, retrieval and management is a dynamic process since it allows the entry into the system of new data that can be incorporated into the project, whose need can be felt when a first approach of the existing data. Spatial data can be derived from a variety of sources, such as aerial photography, cartographic surveys, remote sensing, drone surveys, censuses, samplings, among others. The third level includes procedures for manipulation, exploration and confirmatory analysis. Users can benefit from different statistical, spatial and non-spatial analysis tools that incorporate GIS software, or with which they allow portability. The last step of the process: data output, emphasizes the visualization process, allowing, in this way, the multiple information obtained, either by exploratory analysis of data, conventional or spatial, or by the confirmatory analysis of data, and can be read, systematized and interpreted in various forms. These can be maps, tables, graphs, through the web, among others, constituting instruments to support the understanding and decision making of end users. Figure 9 is indicative of the mediators in the GIS procedure.
3. GIS application at the urban management
3.1. Application advantages
With the advancement of information technology has been accepted spontaneously by society the Geographic Information Systems (GIS), part of the everyday life of most citizens / residents who end up using geography and geographic information. When you want to buy land to build a house, the first question we ask ourselves is where? The second is: how much does it cost? The third: what and how can I build? [2].
Although the order of the previous issues may change, GIS, therefore, appears as an important component in the consultation plan and in the information availability plan. Ideally, municipalities should be equipped with online tools, such as Municipal Planning Plans, so as to take the municipality as much as possible to the “discovery”: where, how much does it cost and what can it build on land owned by it, even on a plot of land. Still with the possibility of consultations of analyses of geographical data combined with the alphanumeric information and thematic cartography.
The advantages of GISs associated with web platforms perfectly fit the interests of municipalities, residents and investors in the management of data and the resources resulting from human action, planning, planning and rational and sustainable management resources. This online tool allows a better knowledge of the territory, better communication between politicians, technicians, citizens and economic agents that interfere in the history of the municipality. Consequently, it will help advance the modernization of processes in the administration of the territory due to the necessary updating. 3.2 Fields of application
Regarding the applicability of Geographic Information Systems, the existence of four large areas of applicability is considered, with practical results. A first area focuses on road networks where address searches, traffic control and management, location analysis and site selection can be mentioned, as well as the planning of evacuation strategies.
Another area involves natural resources. In this field, geographic information is used to manage forest areas, including where there are fire risks, water conservation, management of areas that can be flooded in the event of flooding, management of aquatic resources for recreational areas, maintenance of agricultural land, analyses of environmental impacts, as in the case of accidents with pollutants, among other aspects.
WMCAUS 2019
IOP Conf. Series: Materials Science and Engineering 603 (2019) 022025
IOP Publishing doi:10.1088/1757-899X/603/2/022025
The third area of applicability relates to the management of plots of land, applied for example to the management and maintenance of records of ownership of records, to the analysis of environmental impacts and to the management of water quality.
The fourth area involves the management of infrastructures, covering, for example, the location of plumbing and cables, maintenance planning, and the monitoring and management of their use in the area of energy or telecommunications. It is also worth mentioning the use of GIS for the management of situations for which it is useful to visualize information in three dimensions, such as the planning of large infrastructures such as mines, quarries, dams and geological research areas. As can be seen, all these materials, in which GIS is used, are part of the content of the municipal plans.
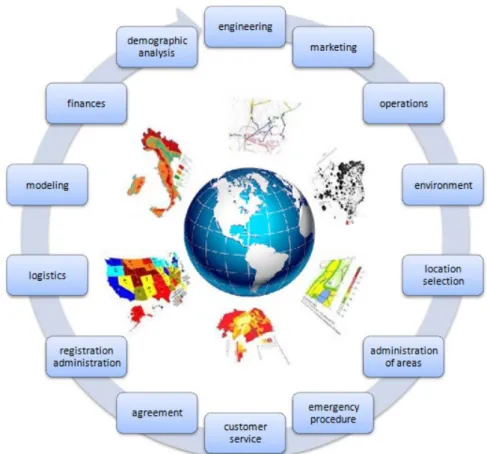
In summary, it is now possible to find the most diverse geographic information systems with a wide heterogeneous field of application (Figure 10), covering a diversity of disciplinary areas (environment, regional and urban planning, agriculture, biology, medicine, geography, administration, logistics, tourism, marketing, etc.) (Figure 11).
WMCAUS 2019
IOP Conf. Series: Materials Science and Engineering 603 (2019) 022025
IOP Publishing doi:10.1088/1757-899X/603/2/022025
Figure 11. Scope of applicability of GIS
4. Conclusions
Geographic Information Systems appear as a powerful decision support tool capable of storing and managing geographic and alphanumeric information in an interconnected and structured way. As this research aimed to show, GIS guarantees the conditions for the quality in terms of urban plan approach, with a representation of the territorial reality, satisfying the desires of citizens, investors in urban development and political decision-makers.
As mentioned previously, the municipalities are responsible for organizing and managing the territory, being their responsibility to promote the enhancement of resources and the careful use of spaces in a sustainable development perspective. Undoubtedly, geo-referenced information is a key component in the elaboration or revision of any urban plan, through the use of GIS.
Currently, the Internet and more recently the mobile communications have triggered the opening of GIS to the outside world. This evolution, plus the need for quality and up-to-date information have resulted in a pivotal aspect regarding the spatial planning instruments such as the Municipal Master Plan, making available their contents, through the WEB, by e-platforms.
Thus, GIS is a key element in the implementation of the e-City, including other activities whose competence is under the umbrella of local authorities. In the sense that the information becomes quite strict, GIS is a way of allowing more reliable management of the territory, making more assertive decisions and monitoring the changes that occur over time, given that the software allows a permanent and non-stop updating of the data.
WMCAUS 2019
IOP Conf. Series: Materials Science and Engineering 603 (2019) 022025
IOP Publishing doi:10.1088/1757-899X/603/2/022025
This research has concluded that the use of GIS, with the example of the WebSIG, is an essential tool in land-use planning, in the elaboration of territorial management tools and in the management of the territory under the responsibility of the local administration.
The application of webSIG technologies gives the required data without barriers of time or distance, and obstacles to the citizens, urban developers, political decision-makers and spatial planning experts.
Acknowledgment(s)
This work is supported by Portuguese national funds by FCT – Foundation for Science and Technology within the UID/ECI/04082/2019 project.
References
[1] S. Almeida, “Proposal model for dissemination of geographic information among local authorities” [Online] 2018 [Accessed 9th December] Available from: http://repositorium.sdum.uminho.pt/handle/1822/8156 2007 (in Portuguese).
[2] J. A. Tenedório, C. D. Henriques and J. C. Silva, “Municipalities, Ordenamento do Território e Sistemas de Informação Geográfica”. Spatial Planning and Geographical Information Systems, [Online] 2004 [Accessed 9th December, 2018], Available from: http://geoinova.fcsh.unl.pt/revistas/files/n7-11.pdf (in Portuguese).
[3] S. Cunha, “The GIS in spatial planning: implementation model – application to the Municipality of Felgueiras”, [Online] 2009 [Accessed 25th November, 2018] Available from:
https://repositorio-aberto.up.pt/bitstream/10216/20358/2/mestsaracunhasig000085086.pdf (in Portuguese).
[4] L. Anselin and A. Gedis, “Spatial statistical analysis and geographic information systems”, University of Chicago at San Diego State University, 1993.
[5] P. Nossa, “Geographical approach about health care services consuming”, [Online] 2005
[Accessed 3rd January, 2019] Available from: