COB-2019-1159
Analysis of the influence of vortex generators by means of the study of their
positions and geometries in small wind turbines
COB-2019-1159
Análise da influência dos geradores de vortex por meio do estudo de suas
posições e geometrias em pequenas turbinas de vento
DOI:10.34117/bjdv6n9-512
Recebimento dos originais: 20/08/2020 Aceitação para publicação: 22/09/2020
Luann Marcos Gondim Lopes
Bacharel em Engenharia Mecânica pela UFERSA UFPE - Universidade Federal do Pernambuco
Avenida da Arquitetura, s/n, Cidade Universitária, Recife/PE – Departamento de Engenharia Mecânica – Laboratório de Mecânica dos Fluidos, CEP: 50740-550
luanngondim@gmail.com
Pâmela Larissa de Sousa Vieira
Bacharel em Engenharia Mecânica pela UFERSA UFERSA - Universidade Federal Rural do Semi-Árido Rua José Rufino, 413, Petrópolis, Pombal/PB, CEP: 58840-000
pamelalarissa30@hotmail.com
Rafael Luz Espindola
Doutorado em Engenharia Mecânica com ênfase em Energia pela UFPE UFERSA - Universidade Federal Rural do Semi-Árido
Avenida Universitária Leto Fernandes, s/n, Sítio Esperança II, Zona Rural, Caraúbas/RN - Bloco de Salas de Professores I - Sala 26 - CEP: 59780-000
rafael.espindola@ufersa.edu.br
Alex Maurício Araújo
D. Sc. em Engenharia Civil pela UFRJ UFPE - Universidade Federal do Pernambuco
Avenida da Arquitetura, s/n, Cidade Universitária, Recife/PE – Departamento de Engenharia Mecânica – Laboratório de Mecânica dos Fluidos, CEP: 50740-550
ama@ufpe.br
ABSTRACT
In order to improve the efficiency of small wind turbines, the present study aims to analyze the influence of devices known as Vortex Generators (VG) from the variation of their positions and geometries. These have the function of generating turbulences in the flow in a controlled and known way. For the position analysis, the simulations were performed without the use of VG’s and with VG’s at 25% and 50% of the chord. For the geometric analysis, were used in the simulations the co-rotating and counter-co-rotating matrix, placed at 25% and 50% of the chord. Were also considered air at 25 °C, steady-state and wind speed rate of 3 m/s. A relative velocity was calculated to suit the conditions used. As a result, there was increase in lift force, deflection, drag and rotation for 25% of the chord. As well as an increase in drag forces and a decrease in lift, rotation and deflection forces
in cases to 50% of the chord. Therefore, it was verified that the VG's directly influence the flow, causing an increase of efficiency in the equipment in the condition a 25% of the chord and a reduction of efficiency in the condition of 50%.
Keywords: Vortex generators, Wind turbines, CFD, Turbulent flow.
RESUMO
Com o objetivo de melhorar a eficiência de pequenos aerogeradores, o presente estudo tem como objetivo analisar a influência de dispositivos conhecidos como Vortex Generators (VG) a partir da variação de suas posições e geometrias. Estes têm a função de gerar turbulências no escoamento de forma controlada e conhecida. Para a análise de posição, as simulações foram realizadas sem o uso de VG's e com VG's a 25% e 50% do acorde. Para a análise geométrica, foram utilizadas nas simulações a matriz corrotante e contra-rotativa, posicionada a 25% e 50% da corda. Também foram considerados ar a 25 ° C, regime permanente e velocidade do vento de 3 m / s. Uma velocidade relativa foi calculada para se adequar às condições utilizadas. Como resultado, houve aumento da força de sustentação, deflexão, arrasto e rotação para 25% da corda. Bem como um aumento nas forças de arrasto e uma diminuição nas forças de sustentação, rotação e deflexão em casos para 50% da corda. Portanto, verificou-se que os VG's influenciam diretamente na vazão, causando um aumento de eficiência no equipamento na condição de 25% do cordão e uma redução de eficiência na condição de 50%.
Palavras-chave: Geradores de vórtice, Turbinas eólicas, CFD. Fluxo turbulento.
1 INTRODUCTION
The possibility of generating electricity from small wind turbines shows that the production of clean energy is advancing and becoming increasingly accessible. However, it is worth mentioning that such mechanism suffers direct influence from the quality and availability of winds. The local winds often do not allow the installation of large wind farms in certain regions or reduce the generation of energy by small wind generators. (INSTITUTO PARA O DESENVOLVIMENTO DE ENERGIAS ALTERNATIVAS DA AMÉRICA LATINA, 2014.).
The use of VG’s could be one of the ways of influencing and improving the efficiency and feasibility of small wind turbines. Such elements are small devices coupled to aerodynamic surfaces with the purpose of creating fluid dynamic turbulences, with behavior and place of formation known in the flow. The formation of such turbulence injects energy into the fluid and makes the flow faster, delaying the separation between the fluid and the blade. (NATIONAL AERONAUTICS AND SPACE ADMINISTRATION, 2008).
According to Griffin (1996), analyzing the NREL S815 (asymmetric) airfoil applied to large size wind turbines, the VG's used in situations with angles of attack between -6º and 6º act in a way to reduce drag, but do not increase lift. For angles of attack between 6º and 18º, the VG's can increase lift and delay the stall phenomenon, besides reducing the drag. For angles between 18º and 35º, the airfoil is already in stall and the effects of the devices are no longer noticed.
Hwangbo et al. (2017) present a case study using two different evaluative methods to determine the influence of the use of VG's in the production of wind farms. Using two real farms, each with four pairs of turbines, half with VG's and the other half without, verified that the use of VG's is capable of increasing production between 1% and 5%.
In this theme, this work seeks to evaluate the influence of the position and geometry of vortex generators on the blades of a small size wind generator, seeking to identify possible ways to optimize the productive capacity of these machines so that they can produce with low wind speed.
2COMPUTATIONAL PROCEDURE
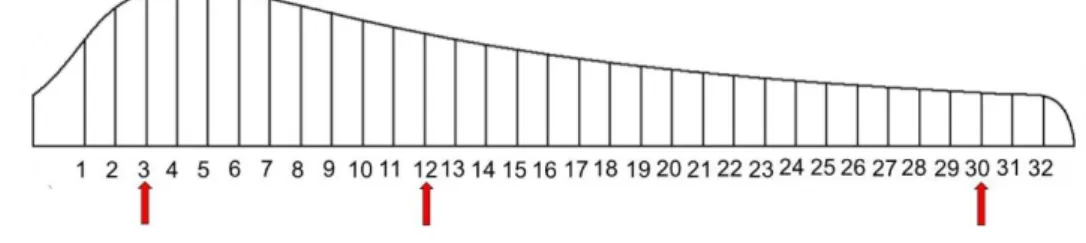
For the accomplishment of the procedures, the model and the characteristics of the blade, were defined from the work of Morais (2018). In it, the blade was divided into 32 sections, each with its respective angulation, position and chord value.
Were used simulations to define the refinement of the mesh, the dimensions of the simulation domain, the properties involved, etc. Due to computational limitations, it was necessary to use simplifications for the blade. For this reason, it was decided to define three profiles among the thirty-two present in the modeling of the blade to be used in the simulations in order to identify the behavior of the flow in different regions of the analyzed object. The profiles selected were located at the beginning of the blade (high local angle of flow), at a more central location of the blade (median local flow angle) and at the end of the blade (low local flow angle), respectively. Figure 1 shows the blade profiles used during the simulations.
Figure 1. Identification of the 32 profiles of the blade and which were used in the simulation.
For the modeling of the chosen profiles, the angle of flow of each one of them was disregarded. Besides, a width of 150 mm was used in order to avoid the effect of wing tip. Figure 2 shows the aerodynamic profiles used in the simulations and their respective angle of attack, disregarding the local flow angle.
Figure 2. Aerodynamic profiles used in the simulation and their respective angle of attack, disregarding the local flow angle.
For the position test, it was defined that the VG's would be placed in two different positions of the profile, 25% and 50% of the chord from the leading edge. Based on the method for sizing the turbulence generators present in Lögdberg's (2006) work, the dimensions of the VG's used were defined (Fig. 3). The numerical values of such dimensions were defined after the identification of the boundary layer thickness identified with the simulation execution without the use of the turbulence generators.
Figure 3. Parameters used for the sizing of vortex generators (WANG et al., 2017).
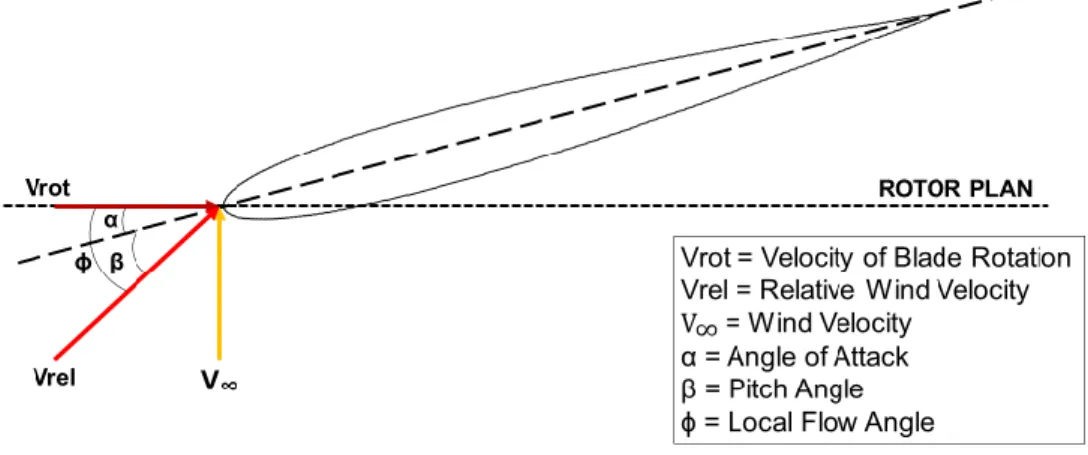
For the contour conditions, a wind velocity of 3 m/s was considered, since it was tried to identify the influence of the VG's at low speeds. However, considering the existence of the local flow angle, it was necessary to define a relative velocity in order to generate an incidence in the profile at an angle of attack of 4º, as defined in the project. In this way, it was defined that, for the velocity of entry, the relative velocities for each simulated profile would be used. Figure 4 shows the velocities. It was considered the pressure of 1 atm.
Figure 4. Relationship of speeds to define the input speed in the simulation domain.
Figure 5 shows the dimensions used for the simulation domains. The same figure also shows the dimensions of the box used for a better refinement of the mesh.
Figure 5. Dimensions used in the box and in the domains of simulations
Figure 6. Union between domain of simulation and box of refinement.
For mesh definition in the simulation domain, it was configured that the faces should have elements of maximum 10 mm, growth rate of 1.2, slow transition and elements with tetrahedral geometry. For the refinement box, the element size was defined as 1 mm, grout rate of 1.2 and 10 layers around the airfoil (inflation command) to avoid distortion in the geometry. The other configuration fields were taken as default.
In the solution configurations, the turbulence model was defined as k-epsilon. This model corresponds to the software standard. It has a lower processing robustness than the other models, however, it generates good results, besides stable meshes (Autodesk, s.d.). Low computational demand when compared to others of the same type (Rocha, 2019) is another characteristic of this model of turbulence. In addition, the simulation was limited in 300 iterations.
The simulations were performed using a CFD simulation software. Firstly, they were performed for the three selected profiles of the blade without the use of vortex generators, in order to analyze which, one had a better flow for the insertion of the VG's. Then, using the selected profile, simulations were performed with the addition of the VG's located at 25% and 50% of the chord from the leading edge. Thus, the simulations were performed by varying the positions and geometries of the VG's. Figure 7 shows the four simulated models.
Finally, the simulation results were analyzed in order to identify the effects of the variation of the positions and the geometries of the VG's, also describing their influence on the efficiency of the small wind turbines.
3 RESULTS AND DISCUSSIONS
3.1SELECTION OF PROFILES AND DIMENSIONING OF VG'S
During the simulation test, when considering the twist of the blade, there was no significant wake formation and the thickness of the boundary layer was small. In this way, turbulence generators would not be well applied, as they would cause perturbations that instead of increasing the energy in the flow would reduce the efficiency of the flow. Thus, it was decided to carry out the simulations to define a more suitable profile for the use of the turbulence generators without considering the twist of the blades.
Thus, we followed the simulations for the chosen profiles of the wind turbine blade, disregarding the torsion because, in these cases, the suitability for the projected angle is disregarded. With the obtained results, the flow behavior of the fluid in each case was observed in order to establish the best profile for the use of the VG's. Figure 8 shows the velocity diagrams generated by the simulations of profiles 3, 12 and 30 without VG's and disregarding the torsion.
Figure 8. Speed diagram for profile 3, profile 12 and profile 30, without VG's and torsion.
In profile 3 (Fig. 8) it was observed a significant flow disturbance promoted by the stall phenomenon. Thus, as suggested by Griffin (1996), at high angles of attack, even in different profiles, this phenomenon occurs and the effect of VG's cannot be identified. For this reason, this profile was not chosen for the VG's tests.
For profile 12 (Fig. 8), it was observed that the boundary layer had a much less expressive behavior when compared to profile 3. The region with the lowest speed is located near the trailing edge in the upper camber of the airfoil, where fluid displacement occurs. With the detachment occurring furthest from the leading edge of the profile, it becomes more suitable for the use of vortex generators, if compared to the case of profile 3 without torsion. If we compare the result of this simulation with the
results of Griffin (1996), even analyzing a different profile, we observed that the behavior of this situation might be more suitable for the VG's tests.
In profile 30 (Fig. 8), a more significant perturbation was observed near the trailing edge, but the boundary layer still presenting low thickness when compared to profile 3 and 12 without torsion, besides a significant velocity, around 7-8 m/s, in most of the boundary layer, reducing the need to use the analyzed devices. Again, according to Griffin (1996), with this speed range even decreasing the drag values the VG's do not generate modifications in the values of the sustentation force.
With the analysis of the three untwisted profiles, it was defined that profile 12 was the most suitable to use the VG's. The most central region of the blade corresponded to the most appropriate zone to use such devices.
Figure 9 shows the thickness of the boundary layer generated in the analysis of profile 12. With this value, the geometric dimensions of the VG's matrices were defined, as shown in Fig. 10.
Figure 9. Identification of the thickness of the boundary layer for the profile 12 without torsion.
Figure 10. Dimensions of the counter-rotating and co-rotating vortex generators.
3.2 ANALYSIS OF PROFILE 12 SIMULATION WITHOUT TORSION AND WITH VG'S Figure 11 shows the velocity diagram obtained in the profile 12 simulation with VG's counter-rotating at 25% of the chord. It is possible to notice that the boundary layer has a smaller thickness when compared to the case of profile 12 without VG's. In addition, it was noted that the air velocity
increased over the upper camber, with values of about 4 m/s. Thus, there was a gain in the kinetic energy in the air flow in the portion most attached to the airfoil. In the figure, it is also possible to identify the air current lines as it passes through the VG's counter-rotating to 25% of the chord.
Figure 11. Velocity diagram for profile 12 (without torsion) with counter-rotating matrix VG's at 25% of the chord.
Figure 12 shows the velocity diagram obtained in the profile 12 simulation with VG's counter-rotating at 50% of the chord. It was noticed that the thickness of the boundary layer presented a slight modification, when compared to the case of profile 12 without VG's, observed by the abrupt increase of the speed after the VG's. By this analysis, it was not possible to determine if there was an increase in the kinetic energy near the upper camber of the airfoil. However, it was possible to identify the lines current of the air when it passes through the VG's counter-rotating to 50% of the chord and to perceive that the behavior differs from the previous case, therefore, in this position the VG's cannot perform their function.
Figure 12. Velocity diagram for profile 12 (without torsion) and with VG's counter-rotating at 50% of the chord.
Figure 13 shows the velocity diagram obtained in the profile 12 simulation with VG's co-rotating at 25% of the chord. It was possible to notice a slight reduction in the thickness of the boundary layer, when compared to the case of airfoil 12 without VG's. A small increase in velocity was observed in air flow over the upper camber and closer to the trailing edge, with values of approximately 3.9 m/s. Thus, it is not possible to define by this analysis if there was gain in the kinetic energy in the air flow since the lines of current very close to the upper camber of the profile did not undergo visible changes. However, it was possible to identify the air current lines as it passes through the VG's co-rotating to 25% of the chord.
Figure 13. Velocity diagram for profile 12 (without torsion) and with VG's co-rotating at 25% of the chord.
Figure 14 shows the velocity diagram obtained in the profile 12 simulation with VG's co-rotating at 50% of the chord. It was noticed that the thickness of the boundary layer increased when compared to the case of profile 12 without VG's. It is possible to notice a reduction in velocity values near the upper camber of the profile after the VG's, however, it was not possible to determine if there were significant modifications in the kinetic energy near the upper camber of the airfoil. In the figure, it was possible to identify the air current lines and observe when passing through the VG's co-rotating to 50% of the chord.
Figure 14. Velocity diagram for profile 12 (without torsion) and with VG's co-rotating at 50% of the chord.
3.3 ANALYSIS OF THE ACTING EFFORTS OF THE SIMULATION OF PROFILE 12 WITHOUT TORSION AND WITH VG'S
With the results obtained by the simulation it was possible to identify the drag, FD, and lift, FL,
that act on the airfoil due to the flow. Figure 15 shows how these forces are related to each other and allows to define the values of the deflection, FDE, and rotational forces, FR, that act on the airfoil.
Figure 15. Efforts acting in the airfoil.
Table 1 shows the FD and FL values obtained in the simulations, in addition to the calculated FDE
and FR values for the situations analyzed.
Table 1. Values found for drag and lift forces acting on the airfoil.
SIMULATION FD (N) FL (N) FDE = FL”+FD” (N) FR=FL’-FD’ (N) (1) Without VG 0.0660656 0.296621 0.137456691 -0.301687982 VG counter-rotating a 25% 0.0669901 0.301638 0.139874028 -0.306621338 VG counter-rotating a 50% 0.0668206 0.290185 0.133425837 -0.297063072 VG co-rotating a 25% 0.0677089 0.295514 0.136038387 -0.302220982 VG co-rotating a 50% 0.0663446 0.293603 0.135602469 -0.299453379
(1) The negative sign observed in F
R indicate the direction of rotation.
Comparing with the simulation without VG's, it is observed that the situation with VG's of matrix counter-rotating to 25% of the chord, generated a positive influence to the flow, amplifying the rotational force by 1.6%, but also generated an increase of 1.8% of the deflection force. For the case with VG's of counter-rotating matrix at 50% of the chord, the use of VG's caused a loss in the rotational force by 1.5% and amplified the deflection force by 2.9%. In the situation with VG's of co-rotating matrix at 25% of the chord, there was an abrupt growth of the rotation force by 0.2% and loss of the deflection force by 1%. Finally, for the case with matrix VG's co-rotating at 50% of the chord, there was a decrease of 0.7% of the rotational force and 1.3% of the deflection force. These results showed that the use of vortex generators directly influences flow on an aerodynamic surface, and the cases with positions upstream of the profile have the best results, proposing that the VG's should be installed in portions closer to the profile attack border.
4 CONCLUSIONS
It was noticed that the angle of attack of the airfoil is quite influential in the effects caused by the vortex generators.
It was observed that the flow presented very different behaviors for the profiles in the three defined regions of the blade, without considering the twist, being unnecessary in regions closer to the blade tip.
The increase of the kinetic energy in the part of the flow closest to the upper camber of the profile was observed when using VG's in situations without considering the torsion. This growth was more significant in the situation with VG at 25% of the chord than in the other cases, proving its direct influence on the flow.
Both the co-rotating matrix and the counter-rotating matrix were efficient when fixed to 25% of the chord.
As for the forces involved, it was observed that in the cases with VG's before and near the beginning of the fluid detachment, the results were more satisfactory and, again, they proved the influence of the VG's on the flow.
Even with the influence of the VGs, it was possible to notice that, at the same time that the rotational force was increased (necessary to cause the blade to rotate), there was also an increase in the deflection values (which cause mechanical loads on the equipment). Thus, a more detailed study is needed to obtain more precise values in relation to the loads involved.
ACKNOWLEDGEMENTS
The authors would like to acknowledge UFPE and UFERSA for supporting this work. Also, we thank the CAPES for the grant provided.
REFERENCES
AUTODESK, s.d. Turbulence. 28 jun. 2019 <https://knowledge.autodesk.com/support/cfd/learn- explore/caas/CloudHelp/cloudhelp/2014/ENU/SimCFD/files/GUID-E9E8ACA1-8D49-4A49-8A35-52DB1A2C3E5F-htm.html>
Griffm, D. A., 1996. “Investigation of Vortex generators for augmentation of wind turbine power perfomance”. National Renewable Energy Laboratory. Colorado, p. 88.
Hwangbo, H.; Ding, Y; Eisele, O; Weinzierl, G; Lang, U; Pechlivanoglou, G., 2017. “Quantifying the effect of vortex generator installation on wind power production: An academia-industrycase study, Renewable Energy”. doi: 10.1016/j.renene.2017.07.009.
INSTITUTO PARA O DESENVOLVIMENTO DE ENERGIAS ALTERNATIVAS DA AMÉRICA LATINA, n.d. “Guia de microgeradores eólicos”. 2014. 06 dez. 2017 <http://institutoideal.org/guiaeolica/>.
Lögdberg, Ola, 2006. Vortex generators and turbulent boundary layer. Master. Thesys, Universitetsservice US–AB. Estocolmo.
Morais, G. L., 2018. PROJETO AERODINÂMICO DE PÁS DE UMA TURBUNA EÓLICA. Graduate. Monography, Universidade Federal Rural do Semi-Árido. Caraúbas, Brasil.
NATIONAL AERONAUTICS AND SPACE ADMINISTRATION. “Micro-Vortex Generators: Enhance Aircraft Performance”. 2008. 03 jul. 2019 < https://www.nasa.gov/centers/langley/news/factsheets/Micro-VG.html>.
Rocha, G. J. A. M., 2019. Análise Metodológica da Aplicação dos Modelos de Turbulência para Simulações de Escoamentos em Perfis Aerodinâmicos. 2019. Dissertation, Universidade Federal de Pernambuco, Recife, Brasil.
Wang, et al., 2017 “Flow control on the NREL S809 wind turbine airfoil using vortex generators”. Energy, Vol. 118, pp. 1210-1221.
RESPONSIBILITY NOTICE