www.j-sens-sens-syst.net/3/291/2014/ doi:10.5194/jsss-3-291-2014
© Author(s) 2014. CC Attribution 3.0 License.
Compensation for the influence of temperature and
humidity on oxygen diffusion in a reactive polymer
matrix
P. Marek1, J. J. Velasco-Veléz2, T. Doll3, and G. Sadowski1
1TU Dortmund, Laboratory of Thermodynamics, Emil-Figge-Str. 70, 44227 Dortmund, Germany 2University of California, Berkeley, Department of Material Science and Engineering, Berkeley,
CA 94720, USA
3BioMaterial Engineering, HNO, Hannover Medical School, Feodor-Lynen Str. 35, Hannover, Germany
Correspondence to:G. Sadowski (gabriele.sadowski@bci.tu-dortmund.de)
Received: 21 April 2014 – Revised: 10 October 2014 – Accepted: 28 October 2014 – Published: 17 November 2014
Abstract. In a previous work (Marek et al., 2013) a time-monitoring oxygen sensor was proposed. This sensor is
based on a diffusion-controlled oxygen reaction of the indicator system methylene blue (MB)/leuco methylene blue (LMB) and riboflavin embedded in a water-loaded poly(vinyl alcohol) (PVA) matrix. It can be used in packaging, sensors, and biotechnology applications. Since the oxygen diffusion coefficient in the PVA matrix strongly depends on temperature and humidity, two different approaches were developed within this work to compensate for these two effects. To compensate for faster oxygen diffusion at higher temperatures, iron particles were added to the PVA matrix, resulting in a novel PVA/iron composite matrix. Adding silicone particles allows compensating the influence of humidity. Both temperature and humidity compensation were modeled using the finite-element method in good accordance with the experimental data. This allows tuning the sensor for application at different conditions of temperature and humidity and therewith in different environments.
1 Introduction
Oxygen, although essential for life, often causes the spoilage of food, medicines, cosmetics, and even electronics (Rooney, 1995). It allows for the growth of microorganisms and a vari-ety of chemical oxidation reactions in these products, which are usually associated with negative consequences. To avoid the damage caused by oxygen, most consumer goods are packaged under a modified atmosphere (MAP) (Mills, 2005). During this process, the oxygen content is reduced by flush-ing the package volume with an inert gas (Phillips, 1996). Al-though the MAP technology prolongs the shelf life of many products, the spoilage of consumer goods cannot be avoided using this packaging technology because the oxygen might enter the packaging material via permeation (Rooney, 1995). However, the use of high-barrier packaging materials can de-crease the oxygen transfer rate (OTR). An example for such a high-barrier material is poly(vinyl alcohol) (PVA) (Lange and Wyser, 2003; Mokwena and Tang, 2012). It is also a
very good material for the immobilization of drugs, chem-icals, indicators, enzymes, and cells (Pritchard, 1970; Finch, 1973). Also for these applications, oxygen diffusion plays a crucial role. However, this material is not established in the packaging industry because of its partially unknown perme-ation properties for oxygen. Moreover, the permeperme-ation and diffusion of oxygen into polymers are mainly determined by their water content (directly related to relative humidity – RH; Jack et al., 2011) and by temperature. For numerous ap-plications, such as for time monitoring (Marek et al., 2013) based on oxygen diffusion, this leads to incorrect outcomes as e.g., oxygen diffusion is increased with increasing temper-ature and water content.
To maintain an oxygen-free atmosphere, oxygen scav-engers which consume oxygen were developed (Rooney, 1995; Wanner, 2010) and integrated in different materials. Most of the scavengers that have been incorporated into poly-mer films are chemical substances, such as Na2SO3, ascorbic
copper (Wanner, 2010). However, so far, oxygen scavengers were only applied to consume a maximum amount of oxygen over the longest possible time but control of oxygen perme-ability using scavengers has not been examined yet.
In this work new compensation approaches have been de-veloped and applied to compensate for the effect of temper-ature and humidity on oxygen diffusion in oxygen sensors (e.g., Marek et al., 2013). For their applications such as in the packaging or sensor technology, this dependency is undesir-able. Faster oxygen diffusion due to higher temperature can be compensated using oxygen scavengers integrated into the sensor matrix (PVA matrix). At higher temperatures, more oxygen is consumed by the scavenger reaction with diffus-ing oxygen. The humidity compensation can be realized by replacing part of the PVA in the PVA matrix with nonwa-ter absorbing elements such as silicone particles, as in these elements the oxygen diffusion stays humidity-independent.
2 Experiments
2.1 Materials
Methylene blue (MB) was obtained from Merck KGaA (Darmstadt, Germany), and PVA (Mowiol 98) from Kuraray Europe GmbH (Frankfurt am Main, Germany). According to the manufacturer, the PVA had a degree of hydrolysis of 98.4 % (per mole) and a molar mass of 47 000 g mol−1.
Ri-boflavin was obtained from BDH Prolabo. The iron particles (10 µm) were obtained from Merck KGaA and were stored in a vacuum to avoid oxidation. Sodium chloride (NaCl) was also obtained from Merck KGaA. The Dow Corning EP-9215 silicone particles were a cosmetic powder (5 µm) and had a specific volume of 0.00102 m3kg−1. All materials
were used as obtained without further purification.
2.2 Preparation of the PVA composite matrices
An aqueous indicator solution consisting of MB and ri-boflavin was prepared. The MB concentration in the indicator solution varied between 7.8×10⁻⁸mol m−3 (0.025 g L−1)
and 3.12×10⁻⁷mol m−3(0.1 g L−1)and the riboflavin
con-centration varied between 1.0×10⁻⁸mol m−3(0.004 g L−1)
and 2.6×10⁻⁸mol m−3 (0.01 g L−1). After that, PVA of
mass fractions between 0.2 and 0.4 was completely dissolved in these solutions for approximately 2 h at 80◦C.
For temperature-compensation experiments, iron particles as well as NaCl were added to these PVA solutions. The final iron mass fraction in the PVA composite matrix var-ied between 0.01 and 0.06, the final NaCl mass fraction in PVA composite matrix was always below 0.02. For humidity-compensation experiments, silicone particles were added to the above-mentioned PVA solutions. The silicone mass frac-tion in the final PVA composite matrix was up to 0.25. For the measurement of water sorption in the PVA/NaCl matrix,
NaCl was directly added to PVA solutions (in the absence of MB and riboflavin).
The resulting mixtures were placed on a glass surface and subsequently flattened using a drawdown rod with a slit of a defined height between 450 and 850 µm. After approximately 12 h, the polymer films were removed from the glass plate, cut, and transferred into a climate test chamber (WKL 34/40, Weiss Umwelttechnik GmbH, Reiskirchen, Germany). Tem-perature and RH in the chamber were set and measured using a Vaisala HUMICAP®Humidity and Temperature
Transmit-ter Series HMT310 instrument with an accuracy of±1.0 % for RHs between 0 and 90 and±1.7 % for RHs over 90 % at 20◦C (temperature accuracy±1.0 %), respectively.
To achieve the desired water mass fraction in the final PVA films, they were equilibrated at RH and temperature of inter-est (see Table 1) for at least 24 h. The correlation between the water mass fraction in PVA on the one hand and RH and temperature in the surrounding atmosphere on the other hand was already described in Jack et al. (2011) and Marek et al. (2013). The temperatures, RH and resulting water mass fractions in the investigated PVA films are summarized in Ta-ble 1.
Depending on the water content in the PVA matrix, the final MB concentration in the PVA matrix varied between 0.31 mol m−3 in experiments for determination of oxygen
diffusion coefficients and 0.36 mol m−3for temperature- and
humidity-compensation experiments. The final riboflavin concentration in the PVA matrix was about 0.05 mol m−3in
all cases. These MB and riboflavin concentrations refer to the final volume of the equilibrated water-loaded PVA ma-trix which was determined using the densities also given in Table 1. The latter were calculated applying the equa-tion of state PC-SAFT (rerturbed-chain statistical associating fluid theory; Gross and Sadowski, 2002) using the parame-ters given in the Appendix A1.
The thickness of the polymer films was determined using a QNix 1200 (Automation Dr. Nix GmbH & Co. KG) coating-thickness measuring instrument. The experiments were per-formed with films of 170±5 or 180±5 µm thicknesses.
To remove the oxygen from the PVA composite matrix be-fore the experiments (see activation of the films in Marek et al., 2013), the films were finally irradiated by UV (ultravio-let) light using an Osram Ultra-Vitalux 300 W lamp under a nitrogen atmosphere until the films turned yellow. After the activation the yellow-colored films contain no oxygen as al-ready shown in Marek et al. (2013).
2.3 Measurements of water sorption in the PVA/NaCl composite matrix
Table 1.Correlation between the temperature, RH and water mass fraction in the PVA matrix for conditions investigated in this work. The density as well as oxygen solubility of the resulting water-loaded PVA films at these conditions are also given.
Water mass Density of Oxygen concentration Temperature RH fraction in PVA water-loaded PVA in PVA matrix (K) (%) matrix (g g−1) matrix (kg m−3) (mol m−3)∗
298.15 90 0.170 1230 0.045
303.15 90 0.170 1226 0.041
308.15 90 0.170 1221 0.038
313.15 90 0.170 1216 0.035
293.15 85 0.133 1248 0.039
298.15 85 0.133 1243 0.035
308.15 85 0.133 1233 0.030
313.15 85 0.133 1228 0.027
298.15 80 0.110 1250 0.029
303.15 80 0.110 1245 0.026
313.15 80 0.110 1235 0.023
298.15 75 0.089 1258 0.024
303.15 75 0.089 1252 0.021
313.15 75 0.089 1242 0.019
298.15 70 0.073 1263 0.019
∗Obtained from Marek et al. (2013).
chamber. The films were repeatedly weighed with an accu-racy of±0.1 mg until the mass of the samples remained con-stant. After that, the films were dried at 120◦C in an oven
overnight. The dried films were then weighed again. The wa-ter mass fraction in the wawa-ter-loaded films was dewa-termined from the mass difference between the wet and dry samples.
2.4 Measurements of the diffusion kinetics
The diffusion kinetics was investigated by monitoring the rate of coloration of the PVA matrix films. The coloration of the sensor is a result of a reaction of colorless LMB (leuco methylene blue) with diffusing oxygen to MB (Marek et al., 2013). Thus, the formation of MB and consequently the increase in the MB absorbance correlates with the dif-fusion kinetics of oxygen. The experiments were performed at a constant RH and temperature in the above-mentioned temperature and climate test chamber WKL 34/40. The MB absorbance in the indicator/polymer system was monitored with a Specord 205 (Analytik Jena AG, Germany) UV–Vis (visible) spectrophotometer. The details of the method were already described in Marek et al. (2013).
3 Compensation for the influence of temperature and humidity on oxygen diffusion
3.1 Temperature compensation
The temperature dependence of the oxygen diffusion coeffi-cient in the PVA matrix can be described using the Arrhenius
Eq. (1).
DO2/PVA=D0exp
−Ea RT
, (1)
where Ea (kJ mol−1) is the activation energy of the
dif-fusion and D0 is the frequency factor. Plotting the
loga-rithm of the oxygen diffusion coefficient in the PVA matrix lnDO2/PVA Matrixversus the reciprocal temperatureT−1 re-sults in a line whereas the slope of this line gives the activa-tion energy of the oxygen diffusion in the PVA matrix.
To compensate for the increase in oxygen diffusion with increasing temperature, iron particles were added to the PVA, resulting in a PVA/iron composite matrix. A homogeneous and reproducible distribution of the iron particles in the PVA/iron composite matrix could be achieved without ag-glomeration, shown in Fig. 1. At higher temperatures, the iron particles are more rapidly oxidized by the diffusing oxy-gen. Therefore, more oxygen is consumed by the oxidation of the iron surface (iron corrosion), and the reaction with LMB is reduced. At low temperatures, the iron oxidation in an iron-based oxygen scavenger is slow; e.g., the oxygen absorption-rate constant at 313.15 K is twice of that at 293.15 K (Charles et al. 2006). Thus, the influence of oxygen consumption on the diffusion–reaction system is negligible.
Figure 1.Image of distribution of iron particles in the PVA/iron film recorded with a DigiMicro 2.0 Scale Microscope camera, dnt GmbH (20×magnification).
As shown in Fig. 2, the oxidation of iron in an aqueous environment is a redox process with an anode reaction,
Fe→Fe2++2e−, (2)
and a cathode reaction,
0.5O2+H2O+2e−→2OH−. (3)
Finally, iron oxide (rust, FeO(OH) and Fe2O3) are formed
from the Fe2+ions (Eqs. 4–6):
Fe2++0.5O2+H2O→Fe(OH)2, (4)
Fe(OH)2+0.5O2→2FeO(OH)+H2O, (5)
2FeO(OH)+2H2O→Fe2O3+3H2O. (6)
At atmospheric conditions, the iron oxide forms a very thin (1–4 nm), nonporous, dense and adherent oxide layer, which surrounds the iron particles (Wanner, 2010; Leygraf and Graedel, 2000). This layer has protective properties against further oxidation. Through this oxide layer the ox-idation of the residual metal particles is limited; thus, the temperature compensation is limited. To prevent the forma-tion of the oxide on the iron surface, Wanner (2010) suc-cessfully added NaCl to polymer composites of iron parti-cles and polypropylene. By doing that, the protective layer was destroyed and new Fe2+ions became available. Thus, in
this work, NaCl was also added to the PVA matrix resulting in a PVA/iron/NaCl composite matrix. In this way, the func-tion of the temperature compensator can be accelerated and maintained for a long time.
Figure 2.Oxidation of the iron surface in a water-loaded PVA/iron composite matrix.
The addition of NaCl however also changes the proper-ties of polymer matrix, such as the water sorption behavior (Naeem and Sadowski, 2010; Sanahuja et al., 2012). Chang-ing the water content also changes the oxygen concentration in the polymer matrix. This in turn has an effect on the iron corrosion and the oxygen diffusion in the PVA/iron/NaCl composite matrix.
For practical applications, it is essential that the iron mass fraction of 0.01–0.05 in the PVA/iron/NaCl composite ma-trix ensures the temperature compensation for several years (time was calculated using the oxygen-consumption capacity of elementary iron from Wanner, 2010). Furthermore it is not expected that iron or iron-oxidation products affect the oxy-gen diffusion or water content in the PVA/iron/NaCl com-posite matrix, since the absolute amount of oxygen is very low compared to the absolute amount of water in the matrix. Thus, the amount of the resulting oxidation products as well as water in Eqs. (4–6) is also very low.
3.2 Humidity compensation
The oxygen diffusion coefficient in the water-loaded PVA matrix strongly depends on the water mass fraction in the PVA matrix (see Fig. 3) which itself is a function of RH (see Table 1). The oxygen diffusion coefficient in the water-loaded PVA matrix is less than 1×10⁻¹³m2s−1at 298.15 K for water mass fractions (wwater) smaller than 0.1 and
in-creases with increasing water mass fraction in the PVA ma-trix to about 2×10⁻⁹m2s−1at 298.15 K (wwater=1.0).
To decrease the humidity dependence, a certain amount of PVA in the PVA matrix was replaced by silicone par-ticles resulting in novel PVA/silicone composite matrix. Since these silicone particles practically do not absorb wa-ter (the maximum wawa-ter sorption in silicone (wwater) is
less than 0.01 at 25◦C), the total amount of water in the
Figure 3.Schematic drawing of the oxygen diffusion coefficient as a function of the water mass fraction in the PVA/silicone composite matrix. The arrow shows increasing amounts of silicone particles in the PVA/silicone composite matrix. The hatching shows the re-gion where oxygen diffusion in the PVA/silicone composite matrix is only little influenced by the water content.
pure water (2×10⁻⁹m2s−1 at 298.15 K; Tse and Sandall, 1979; Han and Bartels, 1996).
Figure 3 also schematically shows the change of oxygen diffusion as a function of silicone content in the PVA/silicone composite matrix. The higher the silicone mass fraction in the PVA/silicone composite matrix, the lower is the influ-ence of the water content on oxygen diffusion. In this work, the silicone mass fraction in the water-loaded PVA/silicone composite matrix varied between was 0.05 and 0.25.
4 Modeling
4.1 Modeling the diffusion-controlled oxidation of LMB in the PVA matrix
To describe the diffusion-controlled oxidation of LMB in the PVA matrix, we used a model which combines Fick’s second law and the reaction kinetics of LMB with diffusing oxygen as already proposed in Marek et al. (2013).
The reaction for LMB oxidation is represented by Eq. (7).
(7) The change of oxygen concentration by LMB oxidation and oxygen diffusion in the PVA matrix is described by Eq. (8).
∂cO2
∂t = ∇ · DO2∇cO2
+r, (8)
where DO2 is the oxygen diffusion coefficient in the PVA matrix, andris the reaction rate of the oxidation according
to Eq. (7). The reaction rate was already determined in Marek et al. (2013) as a function of the reaction-rate constantkand
the oxygen and LMB concentrations, respectively:
r= −k·cO1.22·c0LMB.8 . (9)
The reaction-rate constantkdepends on temperature and was
also determined in Marek et al. (2013). The temperature de-pendence ofkis defined by the Arrhenius Eq. (10).
k=k0·exp
−Ea RT
, (10)
where Ea is the activation energy of the reaction (i.e.,
39 kJ mol−1)andk
0is the frequency factor (approximately
3 000 000 m3mol−1s−1)(Marek et al., 2013).
To model the diffusion process, the polymer film was as-sumed to have a rectangular geometry with a defined layer thickness. In this work films of 170 and 180 µm thickness were used.
The initial oxygen concentration in the film was assumed to be zero. The oxygen concentration at the polymer surface
c0(mol m−3) was assumed to be the equilibrium oxygen
sol-ubility for a defined water mass fraction in the PVA matrix, obtained from Marek et al. (2013).
c (t=0, x=0)=c0 (11)
Given a particular oxygen diffusion coefficient in the PVA matrixDO2, Eqs. (8)–(10) can be solved simultaneously, e.g., by applying the finite element method (FEM) in the software COMSOL Multiphysics. This leads to concentration profiles of oxygen, LMB, and MB as a function of the position in the polymer film and of time. The value ofDO2 was then found by fitting the modeled MB-concentration profiles in the PVA film to the measured ones.
4.2 Modeling the temperature compensation
To model the temperature compensation in the PVA/iron/NaCl composite matrix, the model described above was expanded as explained in the following.
The formation of the iron ions at the metal surface is caused by diffusing oxygen as a result of iron oxidation. The formation of the iron ions, in turn, leads to the formation of corrosion elements, as shown in Fig. 2 (Evans and Hoar, 1932; Guilminot et al., 2002). The corrosion is proportional to the amount of oxygen dissolved in the PVA matrix. The formation of Fe2+ions is thus linked to the oxygen
concen-tration, and the corrosion rate is described by Eq. (12).
∂cFe2+
∂t =kcorrosioncO2, (12)
wherekcorrosionis the corrosion-rate constant for the
forma-tion of Fe2+ions at the metal surface. The reaction kinetics is
valid for oxygen concentrations up to the maximum oxygen solubility in water at ambient conditions.
The Fe2+ ions are consumed in reactions with oxygen
(Eqs. 4–6) and further converted into Fe3+. The reaction rate
for the latter reaction is given by Eq. (13) (Trapp and Millero, 2007).
∂cFe2+
where k (T , cNaCl)is the reaction-rate constant and mainly
depends on the temperature and salt concentration. Combin-ing Eqs. (8–10), describCombin-ing the oxygen diffusion in the PVA matrix, and Eqs. (12) and (13), describing the iron corrosion, leads to the following expression for the change in the oxy-gen concentration in the PVA/iron/NaCl composite film:
∂cO2
∂t = ∇ · DO2∇cO2
−k·cO1.22·cLMB0.8 −kcorrosioncO2 (14)
−k (T , cNaCl) cFe2+cO2.
Equation (14) was solved in COMSOL using diffusion coef-ficients of oxygen in the PVA matrix determined within this work.
4.3 Modeling the humidity compensation
For modeling the influence of silicone particles on the over-all oxygen diffusion, the polymer film was considered to contain silicone particles (of 5 µm diameter). The number of silicone particles refers to the final volume fraction of silicone in the water-loaded PVA/silicone composite films and was determined from the silicone mass fraction in the water-loaded PVA/silicone composite films (in this work up to 0.25). In this work the number of silicone particles var-ied between 9.5×10¹⁴ and 4.5×10¹⁵ particles per cubic meter of water-loaded PVA/silicone composite matrix. Since LMB does not dissolve in silicone, the oxidation of LMB was only assumed to proceed in the PVA matrix. The bound-ary conditions for the film were as defined in Sect. 4.1. Us-ing again the FEM in the software COMSOL Multiphysics, Eqs. (8–10) were solved simultaneously for the PVA/silicone composite film containing a defined number of silicone par-ticles. The oxygen diffusion coefficient in silicone was as-sumed to be 1.7×10⁻⁹m2s−1 (Nunes, 2001). For oxygen diffusion in the water-loaded PVA matrix, diffusion coeffi-cients were used as determined in this work. Using these values, the LMB, MB, and O2concentration profiles in the
PVA/silicone composite film were modeled.
5 Results and discussion
5.1 Influence of temperature on oxygen diffusion in a reactive PVA matrix
5.1.1 Temperature dependence of oxygen diffusion coefficients
Figure 4 shows temperature-dependent MB concentration profiles in the PVA films containing different amounts of water. The MB concentration profiles were modeled using oxygen diffusion coefficients in the PVA matrix as shown in Table 2. The oxygen concentrations in the PVA matrix were obtained from Marek et al. (2013) and are shown in Table 1. Figure 4a shows the obtained MB concentration profiles for a water mass fraction in the PVA matrix of 0.170. The
Figure 4.MB concentration profiles in PVA films of 170 µm thick-ness at temperatures between 293.15 and 313.15 K. The water mass fractions are 0.170 (a), 0.133 (b), 0.110 (c)and 0.089 (d).
Sym-bols are experimental data and lines are modeled profiles using oxy-gen diffusion coefficients in the PVA film from Table 2.
oxygen diffusion coefficient in the PVA film increases by approximately a factor of 10 from 1.4×10⁻¹²m2s−1 at 298.15 K to 1.2×10⁻¹¹m2s−1at 313.15 K.
A very similar behavior was observed for PVA films with water mass fractions of 0.133 and 0.110. The correspond-ing measured and modeled MB concentration profiles are shown in Fig. 4b and c. For an even lower water mass frac-tion (0.089), the oxygen diffusion coefficient even increases by a factor of 13 in a similar temperature range (Fig. 4d).
From these results it can be seen that increasing the tem-perature by about 5 K results in a doubling of the oxygen diffusion coefficient in the PVA matrix. This dependence was observed for all of the PVA matrices investigated in this study regardless of the water content.
The activation energy of the oxygen diffusion in the PVA matrix was determined for the four water mass fractions in the PVA matrix according to Eq. (1). The plots are shown in Fig. 5. The values forEa decrease from 129 kJ mol−1 at a
water mass fraction of 0.089 to 109 kJ mol−1at a water mass
fraction of 0.170. This decrease of activation energy with in-creasing water mass fraction in the PVA matrix is caused by the fact that the activation energy for oxygen diffusion in pure water is significantly lower (approximately 17–19 kJ mol−1;
Table 2.Oxygen diffusion coefficients in a PVA matrix as a func-tion of water mass fracfunc-tion in the PVA matrix and of temperature.
Water mass fraction Temperature Oxygen diffusion in PVA matrix (K) coefficientDO2(m2s−1)
0.170 298.15 1.4×10⁻¹²
0.170 303.15 3.0×10⁻¹²
0.170 308.15 7.0×10⁻¹²
0.170 313.15 1.2×10⁻¹¹
0.133 293.15 5.0×10⁻¹³
0.133 298.15 8.0×10⁻¹³
0.133 308.15 3.2×10⁻¹²
0.133 313.15 6.5×10⁻¹²
0.110 298.15 2.2×10⁻¹³
0.110 303.15 5.0×10⁻¹³
0.110 313.15 2.3×10⁻¹²
0.089 298.15 8.5×10⁻¹⁴
0.089 303.15 2.6×10⁻¹³
0.089 313.15 1.1×10⁻¹²
0.073 298.15 5.4×10⁻¹⁴
Figure 5.Arrhenius plot of the oxygen diffusion coefficients in the PVA matrix for water mass fractions in the PVA matrix of 0.170, 0.133, 0.110, and 0.089, respectively.
5.1.2 Temperature compensation of oxygen diffusion The influence of the iron ions generated from the iron par-ticles on the diffusion–reaction system was measured for an iron mass fraction of 0.045 in the PVA/iron composite ma-trix. The results for a PVA/iron composite film of 180 µm thickness at 313.15 K and 80 % RH are shown in Fig. 6. As can be seen, the influence of iron particles on the mea-sured/modeled MB concentration profile is very small.
The generation of iron ions from iron particles and thus the corrosion process can be accelerated by the addition of salts, e.g., NaCl (Wanner, 2010). Therefore, the iron influence in the presence of NaCl (mass fraction of 0.01) was also inves-tigated in this work.
The resulting MB concentration profiles for iron mass fractions of 0.01, 0.02, and 0.06 at 313.15 K and 80 % RH are shown in Fig. 7a. For comparison, Fig. 7a also shows measured and modeled MB profiles in the PVA films in the absence of iron and NaCl at the same conditions. It can be
Figure 6. Influence of iron particles (iron mass fraction in the PVA/iron composite matrix of 0.045) on the MB concentration pro-file in PVA/iron composite films of 180 µm thickness at 313.15 K and RH of 80 %. The symbols represent experimental data and the line is the modeling of the MB concentration profile in the absence of iron.
seen that iron mass fractions between 0.01 and 0.06 extend the time needed for reaching the final MB concentrations in the film by a factor of between 3 and 6. The reaction of oxy-gen with LMB is reduced due to the consumption of oxyoxy-gen for iron oxidation (Eqs. 2–6). The higher the iron concentra-tion, the more oxygen is consumed and the oxidation of LMB is reduced.
The temperature compensation of oxygen diffusion was also investigated at a lower temperature. Figure 7b shows the MB concentration profiles for iron mass fractions of 0.015 and 0.06 at 298.15 K. The concentration profile in the ab-sence of iron and NaCl is again shown for comparison. It can be seen that at the lower temperature of 298.15 K, the addi-tion of iron to the PVA matrix with or without adding NaCl has only a small effect on oxygen diffusion and therewith on the MB profiles.
A comparison of the MB concentration profile for an iron mass fraction of 0.06 in Fig. 7a at 313.15 K with the MB con-centration profile for the same iron mass fraction at 298.15 K in Fig. 7b shows that the concentration profiles are nearly the same. Thus, the oxidation of LMB in the PVA composite films can be limited at higher temperatures, whereas at lower temperatures the influence of iron particles and NaCl on the oxygen diffusion is not observable.
Since NaCl obviously has a huge influence on the cor-rosion of the iron particles, and consequently on the dif-fusion–reaction system in the PVA/iron/NaCl composite matrix, the influence of NaCl on the diffusion–reaction system was investigated separately. The influence of the NaCl concentration on the MB concentration profiles in the PVA/iron/NaCl composite films of 180 µm thickness for an iron mass fraction of 0.05 at 313.15 K and 80 % RH is shown in Fig. 8. Again, the modeled MB concentration profile for a PVA film of 180 µm thickness in the absence of iron and NaCl is also shown for comparison.
Table 3.Corrosion-rate constants as a function of NaCl content for an iron mass fraction of 0.05 in the PVA/iron/NaCl composite matrix at 313.15 K.
NaCl mass fraction 0.000 0.005 0.010 0.015 0.020
Corrosion-rate constant (s−1) 0.000 0.006 0.022 0.045 0.033
Figure 7.MB concentration profiles in the PVA/iron/NaCl com-posite films of 180 µm thickness at 80 % RH, a NaCl mass fraction of 0.01 and iron mass fractions of 0.01, 0.02, and 0.06 at 313.15 K
(a), and iron mass fractions of 0.015 and 0.06 at 298.15 K(b).
Sym-bols represent experimental data and the lines are the modeled MB concentration profiles in the absence of iron and NaCl.
Figure 8.Influence of the NaCl mass fraction in the PVA compos-ite films with an iron mass fraction of 0.05 and 180 µm thickness at 313.15 K and RH of 80 %. The symbols represent experimental data; the line is the modeling of the MB concentration profile in the absence of iron and NaCl.
mass fraction higher than 0.02 the oxidation of LMB sig-nificantly increases. The slowest oxidation of LMB in the PVA/iron/NaCl composite film was achieved for a NaCl mass fraction of 0.015. For a NaCl mass fraction higher than 0.02, the diffusion rate rises due to the increased water sorption of the PVA films containing NaCl compared to the NaCl-free films (see Appendix A2). Consequently, temperature com-pensation is not possible for NaCl mass fractions higher than 0.02.
Figure 9.MB concentration profiles in PVA composite films of 180 µm thickness for an iron mass fraction of 0.05 and a NaCl mass fraction between 0 and 0.02 at 80 % RH and 313.15 K. Symbols are experimental data and lines are modeled concentration profiles using oxygen diffusion coefficients from Table 2 and the corrosion-rate constants from Table 3.
5.1.3 Modeling of the temperature compensation The aim of modeling was to mathematically describe the temperature compensation and to predict the oxygen diffu-sion as a function of the desired LMB and iron concentra-tions. For modeling, the oxygen solubility (Table 1) and oxy-gen diffusion coefficients according to the higher water mass fractions in the PVA matrix (Appendix A2) caused by NaCl addition were used as determined above. The reaction-rate constants for the iron oxidation were fitted to the measured MB concentration profiles and are shown in Table 3.
The modeling of the MB concentration profiles in PVA composite films of 180 µm thickness with an iron mass frac-tion of 0.05 and NaCl mass fracfrac-tions of 0.005, 0.010, 0.015, and 0.02 are shown in Fig. 9. It becomes obvious that the implemented model (see Sect. 4.3) is able to reproduce the experimental results.
With increasing NaCl mass fractions in the PVA compos-ite matrix, the obtained reaction-rate constants (Table 3) for the iron oxidation increase from 0.006 s−1for a NaCl mass
fraction of 0.05 up to approximately 0.045 s−1 for a NaCl
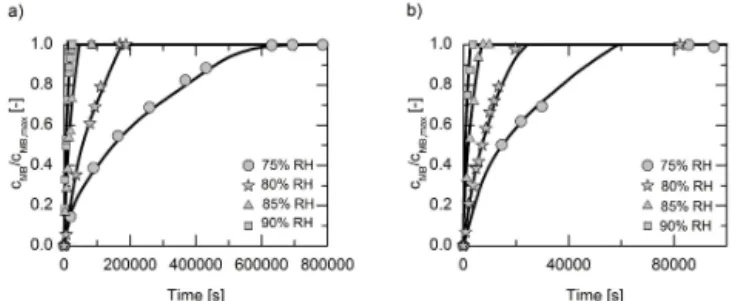
Figure 10. MB concentration profiles in PVA films of 170 µm thickness as a function of RH at 298.15 K(a)and at 313.15 K(b).
Symbols are experimental data and lines are modeled profiles using oxygen diffusion coefficients in the PVA film from Table 2.
Figure 11.Oxygen diffusion coefficients (D) in the PVA matrix as a function of the water mass fraction in the PVA matrix at 298.15 K.
5.2 Influence of humidity on oxygen diffusion in a reactive PVA matrix
5.2.1 Humidity dependence of oxygen diffusion coefficients
In addition to the influence of temperature on the oxygen dif-fusion in the PVA matrix, in this work the influence of the RH was investigated. The measured and modeled MB con-centration profiles are shown for 298.15 K in Fig. 10a and for 313.15 K in Fig. 10b. As can be seen, the oxygen dif-fusion very strongly depends on the RH of the surrounding atmosphere.
The obtained oxygen diffusion coefficients in the PVA ma-trix are shown in Fig. 11 as a function of the water mass frac-tion in the PVA matrix. The data obtained in this work are in good agreement with data reported in Zhang et al. (1987), Tamai and Tanaka (1998), and Petrak and Pitts (1980). A similar dependence of the diffusion coefficients of other gases (e.g., nitrogen and water vapor) on the water mass frac-tion in the PVA matrix was observed in Jack et al. (2011), Tamai and Tanaka (1998), and Lien et al. (2002). In addi-tion, it was also shown in Lien et al. (2002), that the oxygen permeability, which is proportional to the solubility and dif-fusion coefficient, increases with increasing water mass frac-tion in the PVA matrix, which also confirms our data.
Figure 12. Effect of a silicone mass fraction of 0.2 in the PVA/silicone composite films of 170 µm thickness on the MB con-centration profile for different water mass fractions in the PVA ma-trix at 298.15 K (see correlation of water mass fraction and RH in Table 1).
Figure 13.MB concentration profiles in PVA/silicone composite films of 170 µm thickness at 298.15 K and 90 % RH for silicone mass fractions of 0.00, 0.05, 0.10 and 0.25. Symbols are experi-mental data and lines are modeled profiles using oxygen diffusion coefficients from Table 2. Gray lines show the modeling for films with silicone particles and the black line is the modeling for a film in absence of silicone.
5.2.2 Humidity compensation – measurements and modeling
The compensation of the humidity dependence of the diffusion-controlled oxidation of LMB in the PVA matrix was carried out by addition of silicone particles as described in Sect. 3.2. Figure 12 presents the measured MB concentra-tion profiles in water-loaded PVA/silicone composite films of 170 µm thickness at 298.15 K and various RH (70, 80, 90 %) for a silicone mass fraction of approximately 0.20 (equiv-alent to about 3.7×10¹⁵ particles per cubic meter of the PVA/silicone composite matrix).
Table 4. Composition (mass fractions) of the investigated PVA/silicone composite matrices at 298.15 K and 90 % RH.
wsilicone 0.25 0.10 0.05 0.00
wPVA 0.6225 0.7470 0.7885 0.8300
wwater 0.1275 0.1530 0.1615 0.1700
are almost independent of RH, which shows that RH depen-dence could be reduced by adding silicone to the PVA matrix. Since a silicone mass fraction of 0.2 has a huge influence on the oxygen diffusion in the PVA/silicone composite ma-trix, the influence of silicone on the diffusion–reaction sys-tem was further investigated. Figure 13 shows the measured MB concentration profiles in 170 µm films at 90 % RH and 298.15 K. The composition of the PVA/silicone composite matrices in Fig. 13 is given in Table 4. The higher the sili-cone mass fraction in the PVA/silisili-cone composite matrix, the lower is the influence of the water on oxygen diffusion. Even for small silicone mass fractions (<0.1) in the PVA/silicone
composite matrix, a significant influence of silicone particles on the oxygen diffusion in a PVA/silicone composite was ob-served.
To model the measured MB concentration profiles in the PVA/silicone composite films, the model described in Sect. 4.3 was used. For each silicone mass fraction, the re-spective number of particles in the PVA/silicone composite films was calculated. For a silicone mass fraction of 0.05 the number of particles was 9.5×10¹⁴ per cubic meter of the PVA/silicone composite matrix; for a silicone mass frac-tion of 0.10 the number of particles was 1.9×10¹⁵m−3 and for a silicone mass fraction of 0.25 the number was 4.5×10¹⁵m−3. All profiles were modeled with a constant oxygen diffusion coefficient of 1.4×10⁻¹²m2s−1 in the water-loaded PVA matrix and a constant oxygen diffusion coefficient of 1.7×10⁻⁹m2s−1 in silicone particles (see Sect. 4.3).
The modeling of the MB concentration profiles in the PVA/silicone composite films, shown in Fig. 13, is a pure prediction without any parameter fitting. As can be seen, the predictions agree very well with the experimental data.
6 Design of a time-monitoring sensor with temperature and humidity compensation
In a previous work (Marek et al., 2013) a time-monitoring oxygen sensor was proposed. This sensor is based on a diffusion-controlled oxygen reaction of the indicator system MB/LMB and riboflavin embedded in a water-loaded PVA matrix. It can be used in packaging, sensors, and biotechnol-ogy applications, e.g., to indicate the shelf life of products after the first opening of the packaging cap. The main idea was to monitor the oxygen path in the PVA/indicator system
Figure 14.Time-monitoring sensor in a polymer bottle cap, that shows the expired shelf life time before (left) and after (right) first opening.
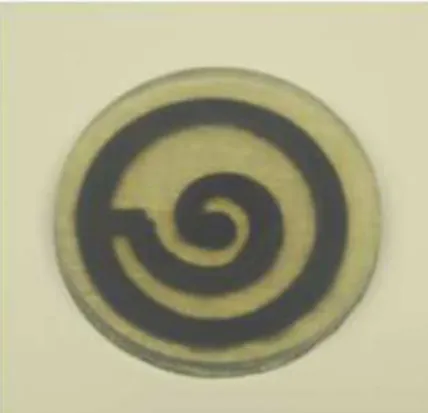
Figure 15.Spiral design of the oxygen path in the time-monitoring sensor.
embedded in the cap, which changes its color after a time corresponding to the product shelf life (see Fig. 14).
The indicated time directly depends on the oxygen path (diffusion length; Fig. 15), but also on temperature and water content in the PVA/polymer matrix.
As an example, to achieve the color change in the center of the cap (see Fig. 14) after the desired time of 6 weeks at a water mass fraction of 0.17 in the PVA matrix (corresponding to 90 % RH at 25◦C), the diffusion length in the cap has to
be 0.9–1.1 mm.
At changing conditions, e.g., RH 60 % and 25◦C, the
Table 5.Recommendations for temperature and humidity compensation.
Surrounding Recommendation for compensation
Relative humidity 75–95 % compensation not required
50–75 % recommended silicone mass fractions in the PVA/silicone matrix: of 0.2–0.3 <50 % recommended silicone mass fraction in the PVA/silicone matrix: up to 0.5
Temperature 20–25◦C compensation not required
25–30◦C recommended iron mass fraction in the PVA/iron/NaCl matrix: 0.01
30–35◦C recommended iron mass fraction in the PVA/iron/NaCl matrix: 0.02–0.03
35–40◦C recommended iron mass fraction in the PVA/iron/NaCl matrix: 0.05–0.06
Analogously, iron particles and NaCl can be added to the PVA matrix to compensate for temperature changes in the surrounding. Recommended iron and NaCl amounts are shown in Table 5.
The compensations allow for the application of the sen-sor at different conditions of temperature and humidity and therewith in different environments and extend the applica-tion range of the sensor.
7 Conclusions
In this study, the oxygen diffusion in a water-loaded PVA ma-trix was studied as a function of temperature and water mass fraction in the PVA matrix. From the measured and modeled concentration profiles of MB in the PVA films, the oxygen diffusion coefficients in the PVA matrix were determined.
To describe the temperature dependence of the oxygen diffusion coefficients in the PVA matrix, the activation en-ergy was determined using an Arrhenius plot. The activa-tion energy depends on the water content and decreases from 129 kJ mol−1 for a water mass fraction of 0.089 to
109 kJ mol−1 for a water mass fraction of 0.170. This
de-crease of activation energy with increasing water mass frac-tion in the PVA matrix is caused by the fact that the activa-tion energy for oxygen diffusion in pure water is significantly lower than in polymers.
Moreover, the humidity dependence of the oxygen diffu-sion coefficients in the water-loaded PVA matrix was deter-mined. The oxygen diffusion coefficient in the PVA matrix depends very strongly on the RH of the surrounding atmo-sphere and thus on the water mass fraction in the PVA matrix. It increases with increasing RH.
For using the diffusion–reaction system in the PVA matrix, e.g., as freshness sensor for time monitoring in food packag-ing, constant oxygen diffusion must be guaranteed. For this reason, the temperature and particularly the humidity depen-dence have been compensated.
To compensate for the increase in oxygen diffusion with increasing temperature, iron particles were added to PVA, re-sulting in a PVA/iron composite matrix. At higher tempera-tures, the iron particles are more rapidly oxidized by the dif-fusing oxygen. Therefore, more oxygen is consumed by the oxidation of the iron surface (iron corrosion), and the reac-tion with the oxygen indicator LMB in the PVA/iron compos-ite matrix is reduced. At low temperatures, the iron oxidation is slow. Thus, the influence of oxygen consumption on the diffusion–reaction system is negligible.
To compensate for the humidity dependence of oxygen diffusion in the PVA matrix, a certain amount of PVA in the water-loaded PVA matrix was replaced by silicone particles resulting in a novel PVA/silicone composite matrix. Since sil-icone particles do not absorb water, the total amount of water in the PVA/silicone composite matrix is smaller than that in the PVA matrix at the same RH, and the novel PVA/silicone composite matrix is thus less influenced by humidity.
Appendix A
A1 PC-SAFT parameters for PVA
In this study, the pure-component PC-SAFT parameters – the segment diameter (σi), the segment number (mi), and the dispersion-energy parameter (εi/ k) for PVA – and the bi-nary interaction parameter for the mixture of water and PVA
kij of−0.039 were fitted simultaneously to the densities of aqueous PVA solutions at PVA mass fractions of 0.05, 0.10, and 0.15, to VLE (vapor–liquid equilibrium) data obtained from Jack et al. (2011) and also to the density of pure PVA obtained from Zoller and Walsh (1995). The determined pa-rameters are listed in Table A1. A detailed description of PC-SAFT can be found in Gross and Sadowski (2002).
A2 Water sorption in PVA/NaCl films
The water sorption in the PVA/NaCl films was measured for different NaCl mass fractions as described in Sect. 2.3. The results are shown in Fig. A1. The water mass fraction in the PVA/NaCl films significantly increases with added NaCl. At 298.15 K and in the RH range of up to 95 %, the PVA/NaCl films contained up to 50 % more water than films without NaCl.
Table A1.Pure-component PC-SAFT parameters for PVA.
Component m/M−1(mol g−1) σ (Å) ε/ k(K)
PVA 0.080 2.39 219.18
Figure A1.Water mass fraction in PVA/NaCl films as a function of the RH of the surrounding atmosphere and of NaCl content in the films at 298.15 K. Symbols are experimental data at various NaCl mass fractionswNaClof 0.005, 0.010, and 0.020; the line indicates
Acknowledgements. We gratefully acknowledge the Federal Ministry of Education and Research (BMBF) for supporting this project with grant 16SV3903. We also want to thank Jinwen Qin, Thomas Goetsch, and Frieda Sandberg for their help during the measurements and the modeling. We also thank Jan Kirchner from KISICO GmbH for preparing the CAD graphics and Thomas Haas for intensive and fruitful discussions.
Edited by: N.-T. Nguyen
Reviewed by: two anonymous referees
References
Charles, F., Sanchez, J., and Gontard, N.: Absorption kinetics of oxygen and carbon dioxide scavengers as part of active modified atmosphere packaging, Journal of Feed Engineering, 72, 1–7, 2006.
Evans, R. U. and Hoar, P. T.: The Velocity of Corrosion from the Electrochemical Standpoint. Part II, P. Roy. Soc., 137, 343–365, 1932.
Ferrell, T. R. and Himmelblau, M. D.: Diffusion Coefficients of Ni-trogen and Oxygen in Water, J. Chem. Eng. Data, 12, 111–115, 1967.
Finch, C. A.: Poly(vinyl alcohol): Properties and Applications, Wi-ley, New York, 1973.
Foltynowicz, Z., Kozak, W. and Fiedorow, R.: Studies of Oxy-gen Uptake on O2-Scavengers Prepared from Different Iron-Containing Parent Substances, Packag. Technol. Sci., 15, 75–81, 2002.
Gross, J. and Sadowski, G.: Modeling polymer systems using the perturbed-chain statistical associating fluid theory equation of state, Ind. Eng. Chem. Res., 41, 1084–1093, 2002.
Guilminot, E., Dalard, F., and Degrigny, C.: Mechanism of Iron rosion in Water-Polyethylene Glycol (PEG 400) Mixtures, Cor-rosion Science, 44, 2199–2208, 2002.
Han, P. and Bartels, M. D.: Temperature Dependence of Oxygen Diffusion in H2O and D2O, J. Phys. Chem., 100, 5597–5602,
1996.
Jack, S., Scharfer, P., Schabel, W., and Kind, M.: Water sorption in poly(vinyl alcohol) membranes: An experimental and numerical study of solvent diffusion in a crosslinked polymer, Chem. Eng. Process., 50, 543–550, 2011.
Kaesche, H.: Die Korrosion der Metalle, Springer-Verlag, Berlin, 1990.
Lange, J. and Wyser, Y.: Recent Innovations in Barrier Technolo-gies for Plastic Packaging – a Review, Packag. Technol. Sci., 16, 149–158, 2003.
Leygraf, C. and Graedel, T. E.: Atmospheric Corrosion, John Wiley & Sons, New York, 2000.
Lien, L., Fellows, C. M., Copeland, L., Hawkett, B. S., and Gilbert, R. G.: Water-binding and oxygen permeability in poly(vinyl al-cohol) films, Aust. J. Chem., 55, 507–512, 2002.
Marek, P., Velasco-Veléz, J. J., Haas, T., Doll, T., and Sadowski, G.: Time-monitoring sensor based on oxygen diffusion in an in-dicator/polymer matrix, Sensor Actuat B-Chem., 178, 254–262, 2013.
Mills, A.: Oxygen Indicators and Intelligent Inks for Packaging Food, Chem. Soc. Rev., 12, 1003–1011, 2005.
Mokwena, K. K. and Tang, J.: Ethylene Vinyl Alcohol: A Review of Barrier Properties for Packaging Shelf Stable Foods, CRC Cr. Rev. Food Sci., 52, 640–650, 2012.
Naeem, S. and Sadowski, G.: pePC-SAFT: Modeling of Polyelec-trolyte Systems. 1. Vapour-Liquid Equilibria, Fluid Phase Equi-libr., 299, 84–93, 2010.
Nunes, S. P.: Membrane Technology in the Chemical Industry, Wiley-VCH, Weinheim, 2001.
Petrak, K. and Pitts, E.: Permeability of Oxygen through Polymers. II. The Effect of Humidity and Film Thickness on the Permeation and Diffusion Coefficients, J. Appl. Polym. Sci., 25, 879–886, 1980.
Phillips, C.: Review: Modified Atmosphere Packaging and its ef-fects on the microbiological quality and safety of produce, Int. J. Food Sci. Tech., 31, 463–479, 1996.
Pritchard, G. J.: Poly(vinyl alcohol): Basic properties and uses, Tay-lor & Francis, 1970.
Rooney, L. M.: Active Food Packaging, Blackie Academic & Pro-fessional, 1995.
Sanahuja, S., Miesbauer, O., Reichmann, E., and Sängerlaub, S.: Modelling and numerical simulation of water vapour sorption kinetics in humidity regulating polypropylene films containing sodium chloride, European Multidisciplinary Society for Mod-elling and Simulation Technology -EUROSIS-; European Tech-nology Institute-ETI-FOODSIM 2012, Food Simulation Confer-ence, 18–20 June, 2012, Fraunhofer IVV, Freising, Germany, 91–97, 2012.
Stalder, F.: Verschiedene Korrosionsformen und -intensitäten beim Angriff von Choridlösungen auf Eisenwerkstoffe, Zürich, 1974. Tamai, Y. and Tanaka, H.: Permeation of Small Penetrants in
Hy-drogel, Fluid Phase Equilibr., 144, 441–448, 1998.
Trapp, M. J. and Millero, J. F.: The Oxidation of Iron(II) with Oxy-gen in NaCl Brines, J. Solution Chem., 36, 1479–1493, 2007. Tse, C. F. and Sandall, C. O.: Diffusion Coefficients for Oxygen and
Carbon Dioxide in Water at 25◦C by Unsteady State Desorption
from a Quiescent Liquid, Chem. Eng. Commun., 3, 147–153, 1979.
Wanner, G. T.: O2-zehrende und -anzeigende Packstoffe für Lebensmittelverpackungen, PhD Thesis, TU München, 2010. Zhang, Z.-W., Satoh, M., and Komiyama, J.: Permeability to O2
and N2of Poly (vinyl alcohol) Membranes Swollen with
Aque-ous Solutions of Nonvolatile Substances, J. Membrane Sci., 31, 147–156, 1987.