www.atmos-meas-tech.net/9/3851/2016/ doi:10.5194/amt-9-3851-2016
© Author(s) 2016. CC Attribution 3.0 License.
A new technique for the direct detection of HO
2
radicals using
bromide chemical ionization mass spectrometry (Br-CIMS):
initial characterization
Javier Sanchez1, David J. Tanner2, Dexian Chen2, L. Gregory Huey2, and Nga L. Ng1,2
1School of Chemical and Biomolecular Engineering, Georgia Institute of Technology, Atlanta, GA 30332, USA 2School of Earth and Atmospheric Sciences, Georgia Institute of Technology, Atlanta, GA 30332, USA
Correspondence to:Nga L. Ng ([email protected])
Received: 4 April 2016 – Published in Atmos. Meas. Tech. Discuss.: 6 April 2016 Revised: 21 July 2016 – Accepted: 22 July 2016 – Published: 19 August 2016
Abstract. Hydroperoxy radicals (HO2) play an important
part in tropospheric photochemistry, yet photochemical mod-els do not capture ambient HO2 mixing ratios consistently.
This is likely due to a combination of uncharacterized chem-ical pathways and measurement limitations. The indirect na-ture of current HO2 measurements introduces challenges
in accurately measuring HO2; therefore a direct technique
would help constrain HOx chemistry in the atmosphere. In
this work we evaluate the feasibility of using chemical ion-ization mass spectrometry (CIMS) and propose a direct HO2
detection scheme using bromide as a reagent ion. Ambi-ent observations were made with a high-resolution time-of-flight chemical ionization mass spectrometer (HR-ToF-CIMS) in Atlanta over the month of June 2015 to demon-strate the capability of this direct measurement technique. Observations displayed expected diurnal profiles, reaching daytime median values of∼5 ppt between 2 and 3 p.m. lo-cal time. The HO2diurnal profile was found to be influenced
by morning-time vehicular NOxemissions and shows a slow
decrease into the evening, likely from non-photolytic pro-duction, among other factors. Measurement sensitivities of approximately 5.1±1.0 cps ppt−1for a bromide ion (79Br−) count rate of 106cps were observed. The relatively low in-strument background allowed for a 3σ lower detection limit of 0.7 ppt for a 1 min integration time. Mass spectra of ambi-ent measuremambi-ents showed the79BrHO−2 peak was the major component of the signal at nominal mass-to-charge 112, sug-gesting high selectivity for HO2at this mass-to-charge. More
importantly, this demonstrates that these measurements can be achieved using instruments with only unit mass resolution capability.
1 Introduction
Hydroperoxy radicals (HO2) play an important role in
the photochemistry of the troposphere. They are primarily formed from the OH initiated oxidation of CO and other volatile organic compounds (VOCs), with contributions from ozonolysis of alkenes, nitrate radical oxidation of VOCs, and photolysis of aldehydes (e.g., HCHO) (Geyer et al., 2003; Cooke et al., 2010; Volkamer et al., 2010; Alam et al., 2013; Stone et al., 2014). HO2 is a reservoir species for OH, the
primary daytime oxidant, and facilitates the photochemical production of ozone via its reaction with NO. Additionally, the relative abundance of HO2 to NOx plays a critical role
in the fate of peroxy radicals (RO2)and the production of
low-volatility products in secondary organic aerosol (SOA) formation (Orlando and Tyndall, 2012; Ziemann and Atkin-son, 2012). For instance, reactions of HO2with RO2 serve
as the main source of atmospheric organic hydroperoxides, which are important constituents of SOA (Docherty et al., 2005).
HO2 is also critical for the evaluation of model
photo-chemical schemes. Because HO2is short lived (Heard and
Pilling, 2003), HO2 measurements allow for evaluation of
model photochemistry with the exclusion of confounding phenomena, such as atmospheric transport. However, accu-rate measurements have proven difficult due to the natu-rally low abundance of HO2. HO2also possess weak
spec-troscopy in the laboratory to measure HO2 while Mihelcic
et al. (1985, 2003) used matrix isolation electron spin reso-nance (MIESR). The latter requires HO2to be collected for
a period of 30 min on a D2O matrix at 77 K before detection.
Both techniques directly measure HO2but their applicability
to atmospheric observations is limited, due to either instru-mentation needs or low time resolution.
More recent methods such as peroxy radical chemical am-plification (PERCA) (Cantrell and Stedman, 1982; Cantrell et al., 1984; Liu et al., 2009; Horstjann et al., 2014), chem-ical ionization mass spectrometry (CIMS) (Hanke et al., 2002; Edwards et al., 2003; Hornbrook et al., 2011; Kim et al., 2013; Wolfe et al., 2014), and laser induced fluores-cence (LIF) (Stevens et al., 1994; Brune et al., 1995; Griffith et al., 2013; Walker et al., 2015) provide lower detection lim-its at high temporal resolution. However, these techniques do not measure HO2 directly. Instead, the aforementioned
techniques require that HO2be titrated with NO, which may
introduce additional complexity, primarily from reactions of NO with RO2. The PERCA technique, for example, exploits
the radical chain reactions of HO2with NO and OH with CO
to produce multiple NO2molecules from each HO2present
in the sample. The production of NO2 molecules is
propor-tional to the contact time between the added reagents and the sample gas. Because multiple NO2molecules are produced
from each HO2, the signal is effectively amplified. The NO2
has then traditionally been detected using luminol, though some recent measurements employ cavity ring-down spec-troscopy (Liu et al., 2009; Horstjann et al., 2014). If organic peroxy radicals are present, the addition of NO to the sam-ple gas results in additional production of HO2; therefore the
technique allows for the measurement of HO2+RO2. As of
yet, speciation of HO2 from other peroxy radicals has not
been successful, though previous attempts have been made (Miyazaki et al., 2010).
Chemical ionization techniques such as ROx Chemical
Conversion/CIMS (ROxMAS) (Hanke et al., 2002) and Per-oxy radical CIMS (PerCIMS) (Edwards et al., 2003; Horn-brook et al., 2011; Kim et al., 2013; Wolfe et al., 2014) also rely on addition of NO to the sample gas. The OH produced from HO2 titration subsequently reacts with SO2 which is
added to the inlet to produce H2SO4. The H2SO4 is then
ionized by nitrate ions (NO−3) to produce a stable HSO−4 product ion for detection. Because NO is added, PerCIMS suffers from positive artifacts from the contribution of the RO2+NO reaction to the measured HO2concentration.
Pre-vious attempts to limit the contribution of the RO2+NO
re-action have been made. For example, Hornbrook et al. (2011) successfully speciated HO2 and HO2+RO2measurements
by modulating the relative NO and O2concentrations in the
reaction region, suppressing the conversion of some peroxy radicals to∼15 %. However, the effectiveness of the oxygen dilution modulation scheme depends largely on the chemi-cal structure of the hydrocarbons in the sample. Unsaturated hydrocarbons, such as isoprene, have additional pathways to
the formation of HO2which are not suppressed by the
oxy-gen dilution modulation scheme.
Unlike CIMS techniques and chemical amplification, the laser induced fluorescence technique does not require multi-ple conversion steps. It only requires the titration of HO2to
OH, which is subsequently detected using laser excitation at 308 nm. The relative simplicity of the technique allows for more effective control of reaction time, which can be used to minimize RO2+NO reactions. Nevertheless, LIF
instru-ments have previously been shown to be susceptible to sim-ilar artifacts, with magnitudes dependent on the effective re-action time allowed after NO addition before detection and on peroxy radical precursor composition of the sample gas (Fuchs et al., 2011; Whalley et al., 2013).
Given the uncertainties associated with indirect methods of HO2measurement and the time resolution required for
at-mospheric measurements, a direct fast time resolution mea-surement of HO2 would benefit efforts aiming to measure
and model HO2in order to understand atmospheric
photo-chemistry. The exclusion of measurement artifacts would aid in evaluating the gap between measured and modeled HO2
concentrations in forested regions, where measured to mod-eled HO2 ratios are highly variable (Stone et al., 2012). In
this work, we evaluated the potential of various chemical ionization schemes and propose the Br−ionization of HO2
to form a Br−(HO2)adduct as a direct method for measuring
HO2using chemical ionization mass spectrometry. This
tech-nique provides selective, fast time resolution measurements of HO2. Ambient measurements were conducted in Atlanta
in June 2015 to demonstrate instrument performance. Impor-tant measurement considerations and future improvements are also discussed.
2 Instrument description
A high-resolution time-of-flight chemical ionization mass spectrometer (HR-ToF-CIMS, Aerodyne Research, Inc.) and a house-built quadrupole CIMS were used for laboratory characterizations of reagent ions for the measurement of HO2. Ambient data were collected using the HR-ToF-CIMS
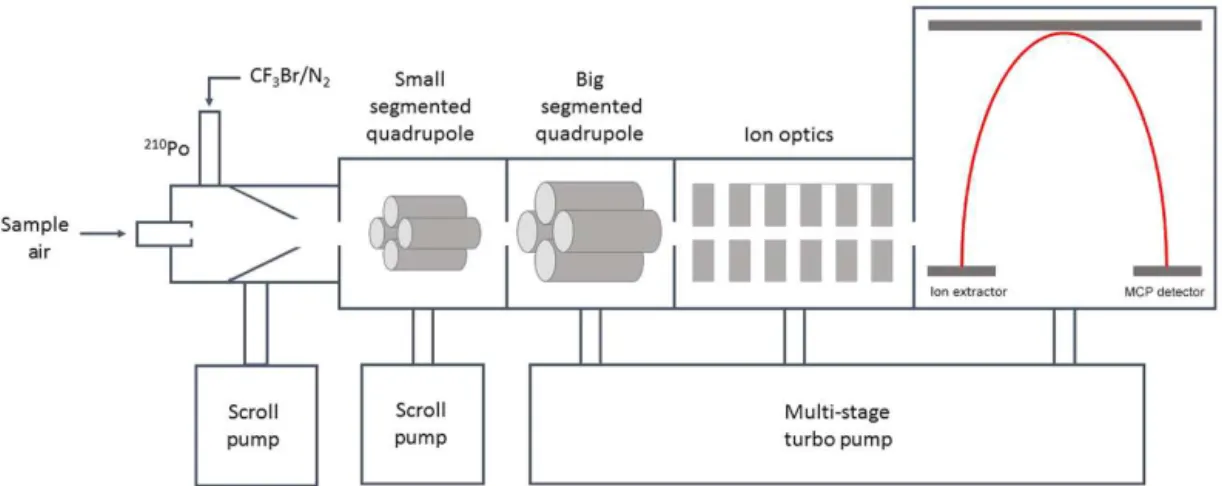
exclusively. The HR-ToF-CIMS consists of an atmospheric pressure interface with five differentially pumped stages, uti-lizing two scroll pumps and a multi-stage turbomolecular pump. The instrument design has been described in detail by Bertram et al. (2011). Figure 1 shows a schematic dia-gram of the HR-ToF-CIMS. HO2is measured by introducing
2 standard L min−1of sample into the ion–molecule reaction
region through a 0.5 mm orifice and mixed with Br−reagent
produced by passing 10 sccm of a 0.2 % CF3Br/N2mixture
carried by∼2 standard L min−1N2gas (99.999 %, Airgas)
Figure 1.Schematic diagram of the high-resolution time-of-flight chemical ionization mass spectrometer (HR-ToF-CIMS). Sample air enters the ion–molecule reaction region through a 0.5 mm orifice where it is ionized at 100 mbar. The contents of the ion–molecule reaction region are sub-sampled through a 0.3 mm orifice into the small segmented quadrupole (SSQ) chamber held at 2.5 mbar. Collisional dissociation occurs in the SSQ. Ion products are then collimated by the big segmented quadrupole (BSQ) where they also dissipate energy by collisions with background gas at reduced pressure. The subsequent ion lenses then focus and accelerate the ion beam towards the ToF analyzer.
in the sample cluster with Br− to form Br−(HO2)adducts
which are transmitted by a series of ion optics and speci-ated by the time-of-flight spectrometer. The isotopic abun-dance of bromine is such that the adduct is detected at two nominal mass-to-charge ratios, m/z 112 andm/z 114 cor-responding to the79Br and81Br isotopes, respectively. The adducts have fractional mass-to-charge ratios of 111.9165 and 113.9144 Th. In order to demonstrate the generalizabil-ity of the technique to instruments with unit mass resolution, only the unit mass resolution data are used for ambient mea-surements, though the high-resolution capabilities were ex-ploited to diagnose and address possible artifacts during the method development. The high-resolution mass spectra are also used to unambiguously identify the BrHO−2 adducts. In contrast to the HR-ToF-CIMS, the quadrupole CIMS was op-erated at an ion–molecule reaction region pressure of 15 torr. The sample and N2flow rates were both 2 standard L min−1.
3 HO2generation and calibration procedure
HO2 were generated for the evaluation of chemical
ioniza-tion schemes and instrument calibraioniza-tions by water photoly-sis at 184.9 nm using a mercury UV lamp as previously de-scribed by a number of studies e.g., (Tanner et al., 1997; Hol-land et al., 2003; Smith et al., 2006; Dusanter et al. 2008). Air was humidified by passing the gas stream through glass bubblers and diluted in dry air from a pure air generator (AADCO 747-14) to vary the relative humidity of the gas. The gas stream was then introduced into a black anodized aluminum square flow tube (15.6 mm×15.6 mm×520 mm) and exposed to UV radiation through a small slit. HO2
con-centrations were calculated using Eq. (1),
1[HO2]=φσ I[H2O]1t, (1)
whereφ,σ, I, and1t represent the quantum yield, water absorption cross-section, UV lamp photon flux at 184.9 nm, and irradiation time, respectively. The quantum yield was assumed to be unity and a value of 7.22×10⁻²⁰cm2 was used for the water absorption cross section (Creasey et al., 2000). The lamp photon flux was measured using a Hama-matsu Phototube (HamaHama-matsu Photonics), and found to be 2.6×10¹³photons cm−2s−1. A bandpass filter (HORIBA Scientific) was used to selectively transmit at 185 nm. The dew point of the gas was measured using a LICOR LI-840A CO2/H2O gas analyzer. The irradiation time was
calcu-lated based on the flow velocity which was measured using a Dwyer pitot tube and a magnehelic pressure sensor. Flow velocities varied between 400 and 800 cm s−1(Re> 4000) to promote plug flow conditions. The slit allowing light into the tube was located such that the distance before irradiation af-ter entry into the tube was 10 times the hydraulic diameaf-ter, allowing the flow profile to fully develop before exposure to UV light. Plug flow conditions were confirmed by measur-ing the flow velocity both at the center line and near the wall of the tube, showing no measurable differences. The water vapor mixing ratios varied between 0.66 and 8.20 ppt. The time after irradiation before introduction into the instrument was minimized (τ∼60 ms) to avoid additional HO2
genera-tion from OH oxidagenera-tion of trace CO present in the N2 gas.
It was calculated that less than 8 % of the OH formed would react with CO to produce additional HO2 assuming a CO
concentration of 500 ppb. Addition of 40 ppm of C3F6as an
OH scavenger had no effect on the HO2signal intensity,
con-firming the lack of contribution from OH oxidation to HO2
production. The HO2concentration was kept low (2–45 ppt)
to calibrate for the HO2levels observed during ambient
recombi-nation. At the HO2mixing ratios employed, less than 1 % of
HO2are estimated to be lost to recombination. The overall
calibration uncertainty is 18 % (1σ ). The contribution of the different parameters to the overall uncertainty is given in Ta-ble S1 in the Supplement. A conservative estimate of 20 % is used in this work.
4 Laboratory characterizations and reagent ion
selection
Prior to the selection of Br− for our ionization scheme, a number of negative reagent ions were evaluated for their abil-ity to detect HO2. HO2were generated using the procedure
in Sect. 3. HO2 mixing ratios were typically in excess of
300 ppt for initial reagent ion evaluation, and varied by vary-ing the gas humidity and velocity. NO was added in excess (2–4 ppm) to obtain the instrument background. NO was also added in small concentrations and in increasing increments to roughly test the kinetics suggested by the HO2signal
re-sponse to additions of varying concentrations of NO, as ad-ditional confirmation that the analyte being observed corre-sponded to HO2. Tests were conducted primarily at room
temperature (293 K). The humidity of the gas stream was determined by the amount of water vapor added to produce HO2. No additional sources of water vapor were present, nor
was water directly added to the IMR. The reagent ions eval-uated included O−2, SF−6, Cl−, and I−. Because of their low electron affinities, O−2 and SF−6 were utilized in an attempt to produce the HO−2 ion directly via charge exchange. How-ever, HO−2 was not observed in laboratory characterization experiments. It is likely that the HO−2 ion formed but was not detected due to its low electron affinity (Ramond et al., 2002), which results in high reactivity. The SF−6 ionization did yield a cluster at mass-to-charge 52, which was assigned as HO2F− in the high-resolution mass spectrum. However,
the signal was not quantitatively reproducible and did not remain constant for a given HO2 concentration.
Addition-ally, the form of the cluster is more likely to be O−2(HF) than F−(HO2)(Seeley et al., 1996), which may compromise the
selectivity of the measurement, as O−2 ions are not uniquely formed from the ionization of HO2.
Chloride and iodide reagent ions were generated from HCl and CH3I mixtures, respectively. Full mass spectra
obtained using the quadrupole CIMS identified Cl−(HCl),
Cl−(HNO
3), and Cl−(CF3COOH) as prominent ions.
How-ever, the Cl−(HO
2)cluster was not observed. The
characteri-zations involving chloride reagent ions in the laboratory were conducted using the quadrupole CIMS. Unlike the other ions, which were evaluated with the HR-ToF-CIMS as well as the quadrupole CIMS, Cl−was not revisited with the HR-ToF-CIMS instrument.
The I− reagent ion, which has been used extensively to measure both organic and inorganic species (Huey et al., 1995; Slusher et al., 2004; Lee et al., 2014;
Woodward-Massey et al., 2014; Brophy and Farmer, 2015; Faxon et al., 2015; Nah et al., 2016; Lee et al., 2016), was found to cluster with HO2, appearing at mass-to-charge 160, consistent with
observations by Veres et al. (2015). However, we observed that addition of NO2 (Scott-Marrin, 100 ppmv/v N2)to a
clean N2gas matrix resulted in an increase of 1 cps per ppb
NO2per 106cps I−in them/z160 signal. A 20 ppb addition
results in a 20 cps increase in them/z160 signal, equivalent to∼4 ppt of HO2. The addition of NO2showed an increase
in a peak (m/z159.9896) not associated with HO2that we
could not identify. The addition of NO2 did not affect the
high-resolution I−(HO2)signal but is expected to be a
sig-nificant artifact for instruments of low resolving power. Unlike the other reagent ions, the Br−ionization scheme was found to be sensitive to HO2, the measurements were
reproducible, and there were no observed positive artifacts from NO2or O3, making this an ideal scheme for
measure-ments of HO2. To evaluate potential positive artifacts as
ob-served using iodide, NO2was added to the N2gas sample and
measured using the bromide reagent, but no increase in the Br−(HO2)(nominalm/z112 andm/z114) signals was
ob-served. Parts per million mixing ratios of ozone were also in-troduced into the inlet in a clean N2matrix but did not cause
any changes in the Br−(HO2)cluster signal. While Br−has
the disadvantage of having a∼50 % natural isotopic abun-dance with nominalm/z 79 and 81, HO2 calibrations
per-formed as described in Sect. 4 showed similar absolute sen-sitivities for the I−(HO2)and79Br−(HO2)clusters using I−
and Br−reagents, respectively. A synthesized mixture con-taining primarily79Br could nearly double the sensitivity at
them/z112 cluster if necessary, giving Br−a potential
ad-vantage over I−with respect to sensitivity. The79Br−(HO
2)
cluster was used preferentially over the81Br−(HO
2)cluster
for ambient data becausem/z114 has a contribution from the isotope of a large m/z 113 CF3COO− signal which arises
from impurities in PFA Teflon™. Iodide ionization was at-tempted once more during ambient sampling, which will be discussed in Sect. 5.3.
Br−ionization: sensitivity, selectivity, humidity, and
temperature dependence
The instrument sensitivity using Br−reagent was calibrated following the procedure in Sect. 3. Figure 2 shows HO2
cali-bration curves for79Br−(HO
2)atm/z112. The figure shows
two separate calibrations performed on two different occa-sions to illustrate reproducibility. The curves are linear with slopes of 4.95±1.00 and 5.26±1.05 which represent the instrument sensitivity in cps ppt−1for a79Br−ion count of 106cps. Intercepts of 27±5 and 30±3 are observed for the calibration curves which are not explained by errors in any of the parameters used to calculate the expected HO2
con-centrations in Eq. (1). Instead, there appears to be a constant HO2photolytic source independent of water photolysis. The
250
200
150
100
50
0
m/z 112 (cps)
50 40
30 20
10 0
HO2 (ppt)
m/z 112 (cps) = 5.26 HO2 (ppt) + 30
R2 = 0.998
m/z 112 (cps) = 4.95 HO2 (ppt) + 27
R2 = 0.997
Figure 2.Laboratory HO2calibration curves for the79Br−(HO2) cluster as observed at nominal m/z 112. The slopes represent the sensitivity in cps ppt−1. HO2mixing ratios are calculated us-ing Eq. (1). Two calibrations conducted on separate occasions are shown to illustrate reproducibility. The error associated with the in-dividual sensitivities is 20 % which arises from the combined un-certainty of the calibration parameters (Eq. 1).
does not scale with the absolute water vapor mixing ratio. Further, addition of 40 ppm C3F6 as OH scavenger did not
have an effect on the observed intercept, suggesting that the HO2 production is unrelated to OH oxidation. The
magni-tude of the HO2formation from this unknown source scales
linearly with the UV lamp flux. The intercept does not affect the sensitivity and is not used to calculate the HO2 mixing
ratio. The uncertainty in the sensitivity is derived from the combined uncertainties of the parameters used in Eq. (1), as well as random error in the HO2 signal, resulting in a 1σ
uncertainty of 20 %. Contributions to the overall uncertainty for each parameter are listed in Table S1. The time series of one HO2calibration at bothm/z112 and 114 are shown in
Fig. S2 in the Supplement to illustrate the rapid instrument response to varying levels of analyte.
The Br−(HO2)measurement selectivity was explored
fur-ther in the laboratory. In addition to high concentration ad-ditions of NO2 and O3, other common atmospheric
con-stituents were sampled with the instrument to assess the possibility of other potential artifacts. Large concentrations (> 10 ppm) of SO2 were added, which did not elicit a
re-sponse. Hydrogen peroxide and formaldehyde were sam-pled from the Georgia Tech Environmental Chamber facil-ity (Boyd et al., 2015) at concentrations in excess of sev-eral ppm, eliciting responses of 0.25 and 0.002 cps ppb−1at m/z 112, respectively. It is not clear whether the observed signal response is due to ion–molecule reaction with Br−or unidentified wall reactions within the experimental chamber. Regardless, these responses are insignificant under most at-mospheric and laboratory experimental conditions. Further-more, if the resulting signal increase is due to reactions inside
10
8
6
4
2
0
Sensitivity (cps ppt )
2.0x10¹⁷ 1.5
1.0 0.5
0.0
Sample water vapor concentration (molecules cm-3)
40 30
20 10
0
Sample relative humidity (%)
Calibration 1 Calibration 2
–1
Figure 3. Instrument sensitivity as measured at m/z 112 79
Br−(HO2)as a function of sample relative humidity. The in-strument sensitivity demonstrates no water vapor dependence be-yond a sample relative humidity of 10 %. The “Calibration 1” and “Calibration 2” labels refer to the curves in Fig. 2.
the IMR, the contribution of these species can be removed from the measurement by obtaining appropriate instrument backgrounds, such as by using additions of NO. Such addi-tions would remove HO2in the sample, but not remove H2O2
or HCHO. The small contributions to the signal atm/z112 would be present in the background and therefore removed from the measurement.
Another important consideration for this technique is the effect of temperature and humidity on cluster stability, which was explored during laboratory characterizations. The effect of varying water vapor mixing ratios in the sample gas on sensitivity is shown in Fig. 3. At relative humidities in the sample below 10 %, the sensitivity appears to have a strong, negative water dependence. However, when the humidity in the sample gas is higher than 10 %, the sensitivity is invariant with increasing relative humidity, which simplifies ambient sampling, as no humidity-dependent correction is required. The temperature dependence was also explored, where an IMR temperature increase from 20 to 40◦C resulted in a
20 % decrease in instrument sensitivity. The relatively strong negative temperature dependence suggests that Br−(HO
2)is
a weak cluster. This highlights the importance of temperature control and performing calibrations at the sampling temper-ature.
5 Ambient measurements
To demonstrate the applicability of the Br− ionization scheme to ambient HO2 measurements, a field study was
6
4
2
0
NO (ppb)
20 16 12 8 4 0
Local time
50
40
30
20
10
0
O
3 (ppb)
6
5
4
3
2
1
0
HO
2 (ppt)
10
8
6
4
2
0
UV index
NO O3 HO2 UV flux
Figure 4. Hourly median diurnal profiles of HO2, NO, O3 and UV index in Atlanta. The sampling period was during 9 June 2015 21:14:00 to 11 June 2015 13:28:00, and 15 June 2015 01:52:00 to 25 June 2015 01:32:00 LT.
site is about 840 m west of Interstate 75/85 and can there-fore be affected by traffic emissions. The instrument was lo-cated outside in an enclosure, allowing for a short 1 cm in-ner diameter Teflon™inlet of approximately 13 cm in length. The residence time of ambient sample in the tube was short (0.3 s) which helps to minimize HO2 surface losses on the
sample tubing. Data was collected at a 1 Hz frequency and averaged to 1 min. A solenoid valve was used to perform pe-riodic additions of 10 sccm of an NO/N2 mixture
(Scott-Marrin, 810 ppm) into the sample stream every 10 min on a 10 % duty cycle to obtain the measurement background. The m/z112 signal was normalized to a79Br−count of 106cps to account for temporal changes in reagent ion abundance.
Various co-located instruments were deployed for simulta-neous measurements of O3, NO, NO2, and HNO4. NO
con-centrations were measured using a Teledyne 200EU chemi-luminescence monitor while NO2was measured by a Cavity
Attenuated Phase Shift NO2 monitor (Aerodyne Research,
Inc.). Ozone was measured using a Teledyne Model T400 UV absorption analyzer. Pernitric acid (HNO4), formed from
the reaction of HO2with NO2was also monitored using a
house-built quadruple CIMS with an iodide-adduct ioniza-tion scheme and observed at m/z 206. A similar configu-ration of the instrument has been described previously by Slusher et al. (2004). Previous measurements of HNO4using
I−have been conducted by Veres et al. (2015). Meteorologi-cal data, including temperature and humidity, were recorded using a Vantage Pro2 weather station. An additional UV sen-sor was employed with the Vantage Pro2 weather station to obtain an UV index measurement between 280 and 360 nm.
5.1 Bromide-CIMS measurements of HO2
Figure 4 shows the diurnal profiles of HO2, as well as the
di-urnal profiles of the UV radiation index, NO, and O3
concen-trations. The difference in the time between peak actinic flux and peak HO2concentration is at least partially due to the
suppression of HO2by the presence of NO from
morning-time traffic emissions. The HO2rises once the NO
concen-tration is sufficiently low and peaks between 2 and 3 p.m. with a mixing ratio of∼5 ppt, comparable to previous stud-ies in other urban regions (Emmerson et al., 2005; Kanaya et al., 2007; Dusanter et al., 2009). The 3σ limit of detec-tion was calculated to be 0.7 ppt for a 1 min integradetec-tion time based on laboratory calibrations and baselines observed dur-ing ambient sampldur-ing, which is sufficiently low for atmo-spherically important HO2 concentrations. The slow decay
of HO2in early evening may partially be explained by
non-photolytic HO2production, e.g., from oxidation of biogenic
volatile organic compounds (BVOCs), which are abundant in the Southeast United States (Geron et al., 2000; Guenther et al., 2006), as well as a decrease in boundary layer height. However, additional measurements would be required to con-strain sources and sinks.
The mass spectrum for a 24 h period of ambient observa-tions is shown in Fig. 5 and compared to a laboratory spec-trum generated during HO2calibration. Few additional peaks
are present in ambient spectrum, suggesting that Br−
ioniza-tion is selective at the mass-to-charge values shown in the figure. Further, the majority of the additional peaks have sig-nal intensities much lower than the intensity of the HO2
sig-nal atm/z112, which makes it unlikely that the species at the additional peaks and their respective isotopes will affect the signal atm/z112.
HNO4 and NO2 measurements were used to infer HO2
concentration for comparison with the measured HO2
con-centrations. The HNO4and HO2are assumed to be in
ther-mal equilibrium for the calculation. Details regarding the cal-culation are discussed in the Supplement. Their respective diurnal profiles are shown in Fig. S3. The profiles agree well temporally but not quantitatively, differing by a factor of 5 during the afternoon. A more complete discussion regarding the comparison is presented in the Supplement.
5.2 Instrument background determinations
Measurement backgrounds were conducted by the addition of NO to the sample gas, as mentioned previously. To evalu-ate the accuracy of the instrument background, a metal wool scrubber was utilized for comparison to the NO addition. The scrubber was first tested to ensure complete scrubbing of sample HO2 by generation of additional HO2 in
ambi-ent air with a mercury lamp. Though HO2 was generated,
-1.0x10⁻⁴
-0.5x10⁻⁴
0.0x10⁻⁴
0.5x10⁻⁴
1.0x10⁻⁴
Normalized intensity
120 115 110 105 100 95 90 85 80 75
Mass-to-charge (Th) 1.0
0.5
0.0
-1.0 -0.5 0.0
Laboratory mass spectrum Ambient mass spectrum
Figure 5.Comparison of laboratory generated and ambient mass spectra. Laboratory data was collected during HO2calibration us-ing the procedure described in Sect. 3. Ambient data from a 24 h period during ambient sampling is shown here. The ambient mass spectrum is reversed for clarity. Few additional peaks are observed in the ambient spectrum, the majority of which are of low signal in-tensity. Prominent known peaks are atm/z79 and 81 (Br−),m/z85 (CF3O−), m/z 97 79Br−(H2O), m/z 99 81Br−(H2O) and 79Br−(HF)
,m/z101 81Br−(HF)
, andm/z113 (CF3COO−).
It was observed that the two methods of obtaining the in-strument background did not agree, with the NO addition providing a lower background signal than the metal wool scrubber. Furthermore, additions of NO to the sample air after physical scrubbing further decreased the HO2 signal.
This suggests that there is internal HO2 generation within
the instrument. Laboratory characterizations were conducted to explore the discrepancy. In the laboratory, adding NO to a clean N2sample matrix also decreased the observed HO2
background signal. The differences in HO2backgrounds
ob-served between the different backgrounding methods and NO additions to N2gas were similar, representing∼4 ppt of HO2
generated inside the instrument. The similarity suggests that HO2generation is independent of sample composition. The
HO2is likely produced from ion-molecule reactions of trace
gases in the N2used for ion generation. The HO2mixing
ra-tios were corrected by subtraction of an additional, constant 4 ppt contribution from internal HO2generation.
Based on the observations made in this work, future instru-ment backgrounds can be conducted in alternative ways to eliminate the need for post-correction. For example, a phys-ical scrubber may be used as has been done here to avoid removal of internally generated HO2 from the background
signal. Alternatively, the NO addition concentration and con-tact time can be optimized such that the HO2+NO reaction
is efficient in the sample line before the instrument, where the pressure is approximately atmospheric, but inefficient in-side the IMR, where the pressure is at least a factor of 10
1.0
0.8
0.6
0.4
0.2
0.0
Normalized intensity
112.04 112.00
111.96 111.92
111.88 111.84
Mass-to-charge (Th) 79
Br-(HO2)
112.0127
1.0
0.8
0.6
0.4
0.2
0.0
Normalized intensity
160.2 160.1
160.0 159.9
159.8 159.7
159.6
Mass-to-charge (Th) 79
Br81Br
-I-(HO2)
159.9900
Figure 6. Normalized high-resolution mass spectra of nominal m/z112 for the Br−ionization of HO2(top panel) andm/z160 for the I−ionization of HO2(bottom panel). The79Br81Br−peak corresponds to Br2added directly to the sample flow from a perme-ation tube as an additional calibrant.
lower. The addition of NO under optimal conditions would then only titrate HO2efficiently in the sample line, but would
not allow significant NO reaction with internally generated HO2.
5.3 Iodide-CIMS measurements of HO2
Despite artifacts observed in the measurements of laboratory-generated HO2, iodide ionization
measure-ments were conducted during a short ambient sampling period (25 July 2015 06:00 p.m. to 27 July 2015 10:00 a.m.) to assess its viability in a real air matrix for the measurement of HO2. We observed that the measured I−(HO2) signals
were not consistent with the expected behavior of HO2.
The time series did not show a clear diurnal pattern, nor was the signal effectively suppressed by NO additions. Instead, NO additions caused m/z 160 to increase. The high-resolution capability of the HR-ToF-CIMS allowed for the peak assignment of I−(HO2)with high accuracy but the
time series of the high-resolution peak displayed a similar behavior to that of the low resolution data. The resolving power of the instrument during the sampling period was
∼3000 and the high-resolution time series of the major peaks at nominalm/z160 appear to be mostly independent of each other, which suggests that resolution is not a limiting factor. Additionally, a peak (m/z 159.990 Th) which may pertain to the NO2 related artifact observed during earlier
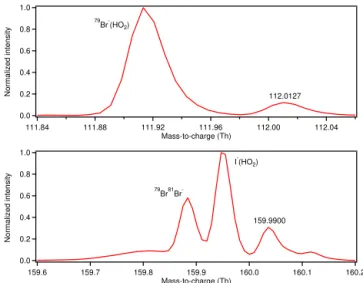
laboratory characterizations was present (Fig. 6). Because the sampling period was short, the possibility of using iodide for HO2 measurements may warrant further exploration.
be necessary for accurate measurements due to artifacts caused by the presence of NO2. This is not the case for
Br−. Figure 6 shows the mass spectra of Br−and I−at the
mass-to-charge ratios where the HO2clusters are observed.
The Br− spectrum shows that the Br−(HO2)cluster is the
dominant species at m/z 112. The minor peak observed is always present and does not vary significantly over the course of the day. Furthermore, the peak does not respond to NO additions, making NO backgrounds effective at eliminating any contribution to the signal from this peak. Thus, the measurement of HO2 with Br− does not require
high-resolution capability.
6 Conclusions and future work
HO2is an important contributor to photochemistry in the
at-mosphere. In this work, we investigated the feasibility of a di-rect chemical ionization measurement of HO2. We evaluated
a number of negative reagent ions (O−2, SF−6, Cl−, I−, and Br−)using a HR-ToF-CIMS and found that detection of HO2
using charge exchange ionization is not feasible in the real atmosphere. However, ionization of HO2via clustering was
found to be a promising mechanism for the direct measure-ment of atmospheric HO2. Among the reagent ions
evalu-ated, Br−was found to be the best candidate for the measure-ment of HO2, providing improved selectivity over I−. The
HO2sensitivities as measured atm/z160 andm/z112 using
iodide and bromide, respectively, were found to be similar, giving Br−a potential advantage in sensitivity, as an isotopi-cally pure CF793 Br mixture should nearly double the sensitiv-ity atm/z112. Using Br−also allows for the measurement
of HO2at a lower m/z which may decrease the likelihood
of measurement interferences and reduce ambiguity in peak identification, as a smaller number of possible chemical for-mulas for ion products are possible. Furthermore, Br has a high electron affinity, which makes the production of small charged ions from ionization and collisional dissociation un-likely.
Ambient measurements were conducted in Atlanta in June 2015 to demonstrate the performance and capability of the instrument. The sensitivity using Br− (5.1±1.00 cps ppt−1 per 106 79Br ion counts) was sufficient for ground-based measurements as the observed baselines were relatively low. Furthermore, the absolute sensitivity for HO2 may also be
significantly improved by using a radioactive source with higher activity, provided that measures are taken to suppress the increased background due to internal HO2 generation.
The measured HO2diurnal profile behaves in a manner
con-sistent with the NOxand HNO4abundance, though there
ex-ist no previous measurements for HO2 in Atlanta available
for a more quantitative comparison. Future work will focus on optimizing the instrument sensitivity to HO2, conducting
instrument intercomparisons, and further exploring Br− ion-ization for the measurement of other atmospherically impor-tant species.
7 Data availability
The data presented in this paper are available upon request from the corresponding author.
The Supplement related to this article is available online at doi:10.5194/amt-9-3851-2016-supplement.
Acknowledgements. This work was supported by National Science Foundation grant 1455588. The HR-ToF-CIMS was purchased with NSF Major Research Instrumentation (MRI) grant 1428738. J. Sanchez acknowledges support by the NASA Earth and Space Science Fellowship (NESSF) and the Alfred P. Sloan Minority Ph.D. (MPHD) Scholarship. D. Chen, L. Huey, and D. Tanner were supported by NSF grant #1262033. The authors would like to thank Wing Y. Tuet for helpful comments.
Edited by: A. Hofzumahaus
Reviewed by: two anonymous referees
References
Alam, M. S., Rickard, A. R., Camredon, M., Wyche, K. P., Carr, T., Hornsby, K. E., Monks, P. S., and Bloss, W. J.: Radical Product Yields from the Ozonolysis of Short Chain Alkenes under At-mospheric Boundary Layer Conditions, J. Phys. Chem. A, 117, 12468–12483, doi:10.1021/jp408745h, 2013.
Bertram, T. H., Kimmel, J. R., Crisp, T. A., Ryder, O. S., Yatavelli, R. L. N., Thornton, J. A., Cubison, M. J., Gonin, M., and Worsnop, D. R.: A field-deployable, chemical ionization time-of-flight mass spectrometer, Atmos. Meas. Tech., 4, 1471–1479, doi:10.5194/amt-4-1471-2011, 2011.
Boyd, C. M., Sanchez, J., Xu, L., Eugene, A. J., Nah, T., Tuet, W. Y., Guzman, M. I., and Ng, N. L.: Secondary organic aerosol formation from theβ-pinene+NO3 system: effect of humidity and peroxy radical fate, Atmos. Chem. Phys., 15, 7497–7522, doi:10.5194/acp-15-7497-2015, 2015.
Brophy, P. and Farmer, D. K.: A switchable reagent ion high res-olution time-of-flight chemical ionization mass spectrometer for real-time measurement of gas phase oxidized species: character-ization from the 2013 southern oxidant and aerosol study, At-mos. Meas. Tech., 8, 2945–2959, doi:10.5194/amt-8-2945-2015, 2015.
Brune, W. H., Stevens, P. S., and Mather, J. H.: Measuring OH and HO2 in the troposphere by laser-induced fluorescence at low-pressure, J. Atmos. Sci., 52, 3328–3336, doi:10.1175/1520-0469(1995)052<3328:moahit>2.0.co;2, 1995.
Cantrell, C. A. and Stedman, D. H.: A possible technique for the measurement of atmospheric peroxy radicals, Geophys. Res. Lett., 9, 846–849, doi:10.1029/GL009i008p00846, 1982. Cantrell, C. A., Stedman, D. H., and Wendel, G. J.: Measurement of
Cooke, M. C., Utembe, S. R., Carbajo, P. G., Archibald, A. T., Orr-Ewing, A. J., Jenkin, M. E., Derwent, R. G., Lary, D. J., and Shallcross, D. E.: Impacts of formaldehyde photolysis rates on tropospheric chemistry, Atmos. Sci. Lett., 11, 33–38, doi:10.1002/asl.251, 2010.
Creasey, D. J., Heard, D. E., and Lee, J. D.: Absorption cross-section measurements of water vapour and oxygen at 185 nm. Implications for the calibration of field instruments to measure OH, HO2and RO2radicals, Geophys. Res. Lett., 27, 1651–1654, doi:10.1029/1999GL011014, 2000.
Docherty, K. S., Wu, W., Lim, Y. B., and Ziemann, P. J.: Contribu-tions of Organic Peroxides to Secondary Aerosol Formed from Reactions of Monoterpenes with O3, Environ. Sci. Technol., 39, 4049–4059, doi:10.1021/es050228s, 2005.
Dusanter, S., Vimal, D., and Stevens, P. S.: Technical note: Mea-suring tropospheric OH and HO2by laser-induced fluorescence at low pressure. A comparison of calibration techniques, Atmos. Chem. Phys., 8, 321–340, doi:10.5194/acp-8-321-2008, 2008. Dusanter, S., Vimal, D., Stevens, P. S., Volkamer, R., and Molina,
L. T.: Measurements of OH and HO2concentrations during the MCMA-2006 field campaign – Part 1: Deployment of the Indiana University laser-induced fluorescence instrument, Atmos. Chem. Phys., 9, 1665–1685, doi:10.5194/acp-9-1665-2009, 2009. Edwards, G. D., Cantrell, C. A., Stephens, S., Hill, B., Goyea,
O., Shetter, R. E., Mauldin, R. L., Kosciuch, E., Tanner, D. J., and Eisele, F. L.: Chemical ionization mass spectrometer instru-ment for the measureinstru-ment of tropospheric HO2and RO2, Anal. Chem., 75, 5317–5327, doi:10.1021/Ac034402b, 2003. Emmerson, K. M., Carslaw, N., Carpenter, L. J., Heard, D. E., Lee,
J. D., and Pilling, M. J.: Urban Atmospheric Chemistry During the PUMA Campaign 1: Comparison of Modelled OH and HO2 Concentrations with Measurements, J. Atmos. Chem., 52, 143– 164, doi:10.1007/s10874-005-1322-3, 2005.
Faxon, C. B., Bean, J. K., and Ruiz, L. H.: Inland Concentra-tions of Cl-2 and ClNO2in Southeast Texas Suggest Chlorine Chemistry Significantly Contributes to Atmospheric Reactivity, Atmosphere-Basel, 6, 1487–1506, doi:10.3390/atmos6101487, 2015.
Fuchs, H., Bohn, B., Hofzumahaus, A., Holland, F., Lu, K. D., Nehr, S., Rohrer, F., and Wahner, A.: Detection of HO2by laser-induced fluorescence: calibration and interferences from RO2 radicals, Atmos. Meas. Tech., 4, 1209–1225, doi:10.5194/amt-4-1209-2011, 2011.
Geron, C., Rasmussen, R., Arnts, R. R., and Guenther, A.: A review and synthesis of monoterpene speciation from forests in the United States, Atmos. Environ., 34, 1761–1781, doi:10.1016/S1352-2310(99)00364-7, 2000.
Geyer, A., Bachmann, K., Hofzumahaus, A., Holland, F., Konrad, S., Klupfel, T., Patz, H. W., Perner, D., Mihelcic, D., Schafer, H. J., Volz-Thomas, A., and Platt, U.: Nighttime formation of per-oxy and hydrper-oxyl radicals during the BERLIOZ campaign: Ob-servations and modeling studies, J. Geophys. Res.-Atmos., 108, 8249, doi:10.1029/2001jd000656, 2003.
Griffith, S. M., Hansen, R. F., Dusanter, S., Stevens, P. S., Alagh-mand, M., Bertman, S. B., Carroll, M. A., Erickson, M., Gal-loway, M., Grossberg, N., Hottle, J., Hou, J., Jobson, B. T., Kammrath, A., Keutsch, F. N., Lefer, B. L., Mielke, L. H., O’Brien, A., Shepson, P. B., Thurlow, M., Wallace, W., Zhang, N., and Zhou, X. L.: OH and HO2 radical chemistry during
PROPHET 2008 and CABINEX 2009 – Part 1: Measurements and model comparison, Atmos. Chem. Phys., 13, 5403–5423, doi:10.5194/acp-13-5403-2013, 2013.
Guenther, A., Karl, T., Harley, P., Wiedinmyer, C., Palmer, P. I., and Geron, C.: Estimates of global terrestrial isoprene emissions using MEGAN (Model of Emissions of Gases and Aerosols from Nature), Atmos. Chem. Phys., 6, 3181–3210, doi:10.5194/acp-6-3181-2006, 2006.
Hanke, M., Uecker, J., Reiner, T., and Arnold, F.: Atmospheric per-oxy radicals: ROXMAS, a new mass-spectrometric methodology for speciated measurements of HO2and Sigma RO2and first re-sults, Int. J. Mass. Spectrom., 213, 91–99, doi:10.1016/S1387-3806(01)00548-6, 2002.
Heard, D. E. and Pilling, M. J.: Measurement of OH and HO2 in the Troposphere, Chem. Rev., 103, 5163–5198, doi:10.1021/cr020522s, 2003.
Hennigan, C. J., Bergin, M. H., Dibb, J. E., and Weber, R. J.: Enhanced secondary organic aerosol formation due to wa-ter uptake by fine particles, Geophys. Res. Lett., 35, L18801, doi:10.1029/2008GL035046, 2008.
Holland, F., Hofzumahaus, A., Schäfer, J., Kraus, A., and Pätz, H.-W.: Measurements of OH and HO2 radical concentrations and photolysis frequencies during BERLIOZ, J. Geophys. Res.-Atmos., 108, PHO 2-1–PHO 2-23, doi:10.1029/2001JD001393, 2003.
Hornbrook, R. S., Crawford, J. H., Edwards, G. D., Goyea, O., Mauldin III, R. L., Olson, J. S., and Cantrell, C. A.: Measure-ments of tropospheric HO2and RO2by oxygen dilution modu-lation and chemical ionization mass spectrometry, Atmos. Meas. Tech., 4, 735–756, doi:10.5194/amt-4-735-2011, 2011. Horstjann, M., Andrés Hernández, M. D., Nenakhov, V., Chrobry,
A., and Burrows, J. P.: Peroxy radical detection for airborne at-mospheric measurements using absorption spectroscopy of NO2, Atmos. Meas. Tech., 7, 1245–1257, doi:10.5194/amt-7-1245-2014, 2014.
Huey, L. G., Hanson, D. R., and Howard, C. J.: Reactions of SF6−
and I−with Atmospheric Trace Gases, J. Phys. Chem., 99, 5001– 5008, doi:10.1021/j100014a021, 1995.
Kanaya, Y., Cao, R., Akimoto, H., Fukuda, M., Komazaki, Y., Yok-ouchi, Y., Koike, M., Tanimoto, H., Takegawa, N., and Kondo, Y.: Urban photochemistry in central Tokyo: 1. Observed and modeled OH and HO2radical concentrations during the winter and summer of 2004, J. Geophys. Res.-Atmos., 112, D21312, doi:10.1029/2007JD008670, 2007.
Kim, S., Wolfe, G. M., Mauldin, L., Cantrell, C., Guenther, A., Karl, T., Turnipseed, A., Greenberg, J., Hall, S. R., Ullmann, K., Apel, E., Hornbrook, R., Kajii, Y., Nakashima, Y., Keutsch, F. N., Di-Gangi, J. P., Henry, S. B., Kaser, L., Schnitzhofer, R., Graus, M., Hansel, A., Zheng, W., and Flocke, F. F.: Evaluation of HOx sources and cycling using measurement-constrained model cal-culations in a 2-methyl-3-butene-2-ol (MBO) and monoterpene (MT) dominated ecosystem, Atmos. Chem. Phys., 13, 2031– 2044, doi:10.5194/acp-13-2031-2013, 2013.
Lee, B. H., Mohr, C., Lopez-Hilfiker, F. D., Lutz, A., Hallquist, M., Lee, L., Romer, P., Cohen, R. C., Iyer, S., Kurtén, T., Hu, W., Day, D. A., Campuzano-Jost, P., Jimenez, J. L., Xu, L., Ng, N. L., Guo, H., Weber, R. J., Wild, R. J., Brown, S. S., Koss, A., de Gouw, J., Olson, K., Goldstein, A. H., Seco, R., Kim, S., McAvey, K., Shepson, P. B., Starn, T., Baumann, K., Edgerton, E. S., Liu, J., Shilling, J. E., Miller, D. O., Brune, W., Schobesberger, S., D’Ambro, E. L., and Thornton, J. A.: Highly functionalized organic nitrates in the southeast United States: Contribution to secondary organic aerosol and reactive nitrogen budgets, P. Natl. Acad. Sci. USA, 113, 1516–1521, doi:10.1073/pnas.1508108113, 2016.
Liu, Y., Morales-Cueto, R., Hargrove, J., Medina, D., and Zhang, J.: Measurements of Peroxy Radicals Using Chemi-cal Amplification-Cavity Ringdown Spectroscopy, Environ. Sci. Technol., 43, 7791–7796, doi:10.1021/es901146t, 2009. Mihelcic, D., Müsgen, P., and Ehhalt, D. H.: An improved method
of measuring tropospheric NO2 and RO2 by matrix isolation and electron spin resonance, J. Atmos. Chem., 3, 341–361, doi:10.1007/BF00122523, 1985.
Mihelcic, D., Holland, F., Hofzumahaus, A., Hoppe, L., Konrad, S., Müsgen, P., Pätz, H. W., Schäfer, H. J., Schmitz, T., Volz-Thomas, A., Bächmann, K., Schlomski, S., Platt, U., Geyer, A., Alicke, B., and Moortgat, G. K.: Peroxy radicals dur-ing BERLIOZ at Pabstthum: Measurements, radical budgets and ozone production, J. Geophys. Res.-Atmos., 108, 8254, doi:10.1029/2001JD001014, 2003.
Miyazaki, K., Parker, A. E., Fittschen, C., Monks, P. S., and Ka-jii, Y.: A new technique for the selective measurement of at-mospheric peroxy radical concentrations of HO2and RO2 us-ing a denudus-ing method, Atmos. Meas. Tech., 3, 1547–1554, doi:10.5194/amt-3-1547-2010, 2010.
Nah, T., Sanchez, J., Boyd, C. M., and Ng, N. L.: Photochemi-cal Aging ofα-pinene andβ-pinene Secondary Organic Aerosol formed from Nitrate Radical Oxidation, Environ. Sci. Technol., 50, 222–231, doi:10.1021/acs.est.5b04594, 2016.
Orlando, J. J. and Tyndall, G. S.: Laboratory studies of organic per-oxy radical chemistry: an overview with emphasis on recent is-sues of atmospheric significance, Chem. Soc. Rev., 41, 6294– 6317, doi:10.1039/C2CS35166H, 2012.
Radford, H. E., Evenson, K. M., and Howard, C. J.: HO2detected by laser magnetic resonance, J. Chem. Phys., 60, 3178–3183, doi:10.1063/1.1681503, 1974.
Ramond, T. M., Blanksby, S. J., Kato, S., Bierbaum, V. M., Davico, G. E., Schwartz, R. L., Lineberger, W. C., and Ellison, G. B.: Heat of Formation of the Hydroperoxyl Radical HOO Via Negative Ion Studies, J. Phys. Chemi. A, 106, 9641–9647, doi:10.1021/jp014614h, 2002.
Seeley, J. V., Meads, R. F., Elrod, M. J., and Molina, M. J.: Temperature and Pressure Dependence of the Rate Constant for the HO2+NO Reaction, J. Phys. Chem., 100, 4026–4031, doi:10.1021/jp952553f, 1996.
Slusher, D. L., Huey, L. G., Tanner, D. J., Flocke, F. M., and Roberts, J. M.: A thermal dissociation–chemical ion-ization mass spectrometry (TD-CIMS) technique for the si-multaneous measurement of peroxyacyl nitrates and dini-trogen pentoxide, J. Geophys.l Res.-Atmos., 109, D19315, doi:10.1029/2004JD004670, 2004.
Smith, S. C., Lee, J. D., Bloss, W. J., Johnson, G. P., Ingham, T., and Heard, D. E.: Concentrations of OH and HO2radicals dur-ing NAMBLEX: measurements and steady state analysis, At-mos. Chem. Phys., 6, 1435–1453, doi:10.5194/acp-6-1435-2006, 2006.
Stevens, P. S., Mather, J. H., and Brune, W. H.: Measurement of tropospheric OH and HO2 by laser-induced fluorescence at low-pressurE, J. Geophys. Res.-Atmos., 99, 3543–3557, doi:10.1029/93jd03342, 1994.
Stone, D., Whalley, L. K., and Heard, D. E.: Tropospheric OH and HO2radicals: field measurements and model comparisons, Chem. Soc. Rev., 41, 6348–6404, doi:10.1039/C2CS35140D, 2012.
Stone, D., Evans, M. J., Walker, H., Ingham, T., Vaughan, S., Ouyang, B., Kennedy, O. J., McLeod, M. W., Jones, R. L., Hop-kins, J., Punjabi, S., Lidster, R., Hamilton, J. F., Lee, J. D., Lewis, A. C., Carpenter, L. J., Forster, G., Oram, D. E., Reeves, C. E., Bauguitte, S., Morgan, W., Coe, H., Aruffo, E., Dari-Salisburgo, C., Giammaria, F., Di Carlo, P., and Heard, D. E.: Radical chem-istry at night: comparisons between observed and modelled HOx, NO3 and N2O5 during the RONOCO project, Atmos. Chem. Phys., 14, 1299–1321, doi:10.5194/acp-14-1299-2014, 2014. Tanner, D. J., Jefferson, A., and Eisele, F. L.: Selected ion chemical
ionization mass spectrometric measurement of OH, J. Geophys. Res.-Atmos., 102, 6415–6425, doi:10.1029/96JD03919, 1997. Veres, P. R., Roberts, J. M., Wild, R. J., Edwards, P. M., Brown, S.
S., Bates, T. S., Quinn, P. K., Johnson, J. E., Zamora, R. J., and de Gouw, J.: Peroxynitric acid (HO2NO2) measurements during the UBWOS 2013 and 2014 studies using iodide ion chemical ionization mass spectrometry, Atmos. Chem. Phys., 15, 8101– 8114, doi:10.5194/acp-15-8101-2015, 2015.
Volkamer, R., Sheehy, P., Molina, L. T., and Molina, M. J.: Oxida-tive capacity of the Mexico City atmosphere – Part 1: A rad-ical source perspective, Atmos. Chem. Phys., 10, 6969–6991, doi:10.5194/acp-10-6969-2010, 2010.
Walker, H. M., Stone, D., Ingham, T., Vaughan, S., Cain, M., Jones, R. L., Kennedy, O. J., McLeod, M., Ouyang, B., Pyle, J., Bau-guitte, S., Bandy, B., Forster, G., Evans, M. J., Hamilton, J. F., Hopkins, J. R., Lee, J. D., Lewis, A. C., Lidster, R. T., Punjabi, S., Morgan, W. T., and Heard, D. E.: Night-time measurements of HOxduring the RONOCO project and analysis of the sources of HO2, Atmos. Chem. Phys., 15, 8179–8200, doi:10.5194/acp-15-8179-2015, 2015.
Whalley, L. K., Blitz, M. A., Desservettaz, M., Seakins, P. W., and Heard, D. E.: Reporting the sensitivity of laser-induced fluores-cence instruments used for HO2detection to an interference from RO2radicals and introducing a novel approach that enables HO2 and certain RO2types to be selectively measured, Atmos. Meas. Tech., 6, 3425–3440, doi:10.5194/amt-6-3425-2013, 2013. Wolfe, G. M., Cantrell, C., Kim, S., Mauldin III, R. L., Karl, T.,
Harley, P., Turnipseed, A., Zheng, W., Flocke, F., Apel, E. C., Hornbrook, R. S., Hall, S. R., Ullmann, K., Henry, S. B., Di-Gangi, J. P., Boyle, E. S., Kaser, L., Schnitzhofer, R., Hansel, A., Graus, M., Nakashima, Y., Kajii, Y., Guenther, A., and Keutsch, F. N.: Missing peroxy radical sources within a summer-time ponderosa pine forest, Atmos. Chem. Phys., 14, 4715–4732, doi:10.5194/acp-14-4715-2014, 2014.
ion chemical ionization mass spectrometry for quantification of isocyanic acid in ambient air, Atmos. Environ., 98, 693–703, doi:10.1016/j.atmosenv.2014.09.014, 2014.
Xu, L., Guo, H., Boyd, C. M., Klein, M., Bougiatioti, A., Cerully, K. M., Hite, J. R., Isaacman-VanWertz, G., Kreisberg, N. M., Knote, C., Olson, K., Koss, A., Goldstein, A. H., Hering, S. V., de Gouw, J., Baumann, K., Lee, S.-H., Nenes, A., Weber, R. J., and Ng, N. L.: Effects of anthropogenic emissions on aerosol formation from isoprene and monoterpenes in the southeastern United States, P. Natl. Acad. Sci., 112, 37–42, doi:10.1073/pnas.1417609112, 2015a.
Xu, L., Suresh, S., Guo, H., Weber, R. J., and Ng, N. L.: Aerosol characterization over the southeastern United States using high-resolution aerosol mass spectrometry: spatial and seasonal varia-tion of aerosol composivaria-tion and sources with a focus on organic nitrates, Atmos. Chem. Phys., 15, 7307–7336, doi:10.5194/acp-15-7307-2015, 2015b.