ACPD
10, 22219–22277, 2010CIMS Measurements of HO2 and RO2
R. S. Hornbrook et al.
Title Page
Abstract Introduction
Conclusions References
Tables Figures
◭ ◮
◭ ◮
Back Close
Full Screen / Esc
Printer-friendly Version
Interactive Discussion
Discussion
P
a
per
|
Dis
cussion
P
a
per
|
Discussion
P
a
per
|
Discussio
n
P
a
per
|
Atmos. Chem. Phys. Discuss., 10, 22219–22277, 2010 www.atmos-chem-phys-discuss.net/10/22219/2010/ doi:10.5194/acpd-10-22219-2010
© Author(s) 2010. CC Attribution 3.0 License.
Atmospheric Chemistry and Physics Discussions
This discussion paper is/has been under review for the journal Atmospheric Chemistry and Physics (ACP). Please refer to the corresponding final paper in ACP if available.
Measurements of tropospheric HO
2
and
RO
2
by oxygen dilution modulation and
chemical ionization mass spectrometry
R. S. Hornbrook1, J. H. Crawford2, G. D. Edwards1,*, O. Goyea1,**, R. L. Mauldin III1,3, J. S. Olson2, and C. A. Cantrell1
1
Atmospheric Chemistry Division, National Center for Atmospheric Research, 1850 Table Mesa Drive, P.O. Box 3000, Boulder, CO, USA
2
Atmospheric Sciences Division, Langley Research Center, NASA, Hampton, VA, USA
3
Department of Physics, 00014 University of Helsinki, Finland
*
now at: Department of Chemistry, Eastern Michigan University, Ypsilanti, MI, USA
**
now at: United States Patent and Trademark Office, Department of Commerce, Alexandria, VA, USA
Received: 2 September 2010 – Accepted: 8 September 2010 – Published: 28 September 2010
Correspondence to: R. S. Hornbrook (rsh@ucar.edu)
ACPD
10, 22219–22277, 2010CIMS Measurements of HO2 and RO2
R. S. Hornbrook et al.
Title Page
Abstract Introduction
Conclusions References
Tables Figures
◭ ◮
◭ ◮
Back Close
Full Screen / Esc
Printer-friendly Version
Interactive Discussion
Discussion
P
a
per
|
Dis
cussion
P
a
per
|
Discussion
P
a
per
|
Discussio
n
P
a
per
|
Abstract
An improved method for the measurement of hydroperoxy radicals (HO2) and organic peroxy radicals (RO2, where R is any organic group) has been developed that com-bines two previous chemical conversion/chemical ionization mass spectrometry (CIMS) peroxy radical measurement techniques. Applicable to both ground-based and aircraft 5
platforms, the method provides good separation between HO2and RO2 and frequent measurement capability with observations of both HO2and HO2+RO2amounts each minute. This allows for analyses of measured [HO2]/[HO2+RO2] ratios on timescales relevant to tropospheric photochemistry. By varying both [NO] and [O2] simultaneously in the chemical conversion region of the PeRCIMS (Peroxy Radical CIMS) inlet, the 10
method exploits the changing conversion efficiency of RO2 to HO2 under different in-let [NO]/[O2] to selectively observe either primarily HO2 or the sum of HO2and RO2. Two modes of operation have been established for ambient measurements: in the first half of the minute, RO2 radicals are measured at close to 100% efficiency along with HO2radicals (low [NO]/[O2]=2.53×10−5) and in the second half of the minute, HO2is 15
detected while the majority of ambient RO2 radicals are measured with approximately 15% efficiency (high [NO]/[O2]=6.80×10
−4
). The method has been tested extensively in the laboratory under various conditions and for a variety of organic peroxy radicals relevant to the atmosphere and the results of these tests are presented. The modified PeRCIMS instrument has been deployed successfully using the current measurement 20
technique on a number of aircraft campaigns, including on the NSF/NCAR C-130 dur-ing the MIRAGE-Mex and NASA INTEX-B field campaigns in the sprdur-ing of 2006. A brief comparison of the peroxy radical measurements during these campaigns to a photo-chemical box model confirms that the PeRCIMS is able to successfully separate and measure HO2and RO2under the majority of tropospheric conditions.
ACPD
10, 22219–22277, 2010CIMS Measurements of HO2 and RO2
R. S. Hornbrook et al.
Title Page
Abstract Introduction
Conclusions References
Tables Figures
◭ ◮
◭ ◮
Back Close
Full Screen / Esc
Printer-friendly Version
Interactive Discussion
Discussion
P
a
per
|
Dis
cussion
P
a
per
|
Discussion
P
a
per
|
Discussio
n
P
a
per
|
1 Introduction
Peroxy radicals, including hydroperoxy radicals (HO2) and organic peroxy radicals (RO2, where R is any organic group) are important tropospheric photochemical species having a critical role in tropospheric ozone formation, as a reservoir for hydroxyl rad-icals (OH), and the primary source of gas phase peroxides. Peroxy radrad-icals are pro-5
duced via reactions of OH with carbon monoxide and volatile organic compounds (VOCs). In air masses with low NOx (NO+NO2), the dominant sinks for peroxy rad-icals are via self- and cross reactions, forming peroxides and other species (Tyndall et al., 2001; Hasson et al., 2003; Calvert et al., 2008) Where NOx concentrations are higher, peroxy radicals efficiently convert NO into NO2, regenerating OH. The resulting 10
NO2 can be photolyzed to generate O3. At very high NOx, production of HNO3 from the reaction of OH with NO2dominates.
The presently-available techniques used for observing RO2do not provide speciated measurements of individual RO2but rather a sum of RO2 (Cantrell et al., 2003a, b, c; Green et al., 2006; Ren et al., 2006; Fuchs et al., 2008). Nevertheless, observations of 15
organic peroxy and hydroperoxy radicals have been shown to be valuable components in understanding and modeling tropospheric photochemistry. Separate observations of [HO2] and [HO2+RO2] under photochemical timescales can improve our understand-ing of atmospheric processes involvunderstand-ing VOCs and NOxand the partitioning that occurs between OH and HO2and between the hydro- and organic peroxy radical forms.
20
The method presented here builds on the previous work of this research group using the Peroxy Radical Chemical Ionization Mass Spectrometry (PeRCIMS) inlet (Edwards et al., 2003) by adding a dilution step similar to that described by Hanke et al. (2002). In all three techniques, [HO2] and [HO2+RO2] are measured independently by exploiting the competing chemistry that converts alkoxy (RO) radicals, formed in reactions of RO2 25
with added NO in the inlet, into either HO2or alkyl nitrites via the following:
RO2+NO→RO+NO2 (R1)
ACPD
10, 22219–22277, 2010CIMS Measurements of HO2 and RO2
R. S. Hornbrook et al.
Title Page
Abstract Introduction
Conclusions References
Tables Figures
◭ ◮
◭ ◮
Back Close
Full Screen / Esc
Printer-friendly Version
Interactive Discussion
Discussion
P
a
per
|
Dis
cussion
P
a
per
|
Discussion
P
a
per
|
Discussio
n
P
a
per
|
RO+O2→R ′
O+HO2 (R3)
RO2+NO+M→RONO2+M (R4)
Here, Reaction (R3) requires that the RO radical has available α-hydrogen atoms that can be abstracted. For inlet conditions k3[O2]> k2[NO][M], there is increased likelihood for alkoxy radicals to react with O2 to generate HO2. Similarly, where
5
k3[O2]< k2[NO][M], RO is more likely to form an alkyl nitrite via (R2). For some RO2 radicals, there is also the possibility of formation of the alkyl nitrate via (R4) in competi-tion with (R1), generally increasing in importance as the size of the R group increases. This RO2separation chemistry is shown in Scheme 1, along with an additional reaction pathway that will be discussed in Sect. 3.2.3.
10
Both ambient HO2radicals and HO2radicals formed in Reaction (R3) are converted into H2SO4in the inlet through reactions with added NO and SO2via:
HO2+NO→OH+NO2 (R5)
OH+SO2+M→HSO3+M (R6)
HSO3+O2→HO2+SO3 (R7)
15
SO3+2H2O→→H2SO4+H2O (R8)
OH+NO+M→HONO+M (R9)
The formation of HSO3 in (R6) leads to HO2 being recycled in (R7), but this cycle is terminated by (R9). Therefore, the residence time in the neutral chemistry region and the ratio of [SO2]/[NO] determines the competing chemistry of OH reactions with SO2 20
and NO (R6 and R9), and thus the sulfuric acid yield,∆[H2SO4]/[HO2]o, from (R5–R8). A summary of the HO2conversion chemistry is shown in Scheme 2.
ACPD
10, 22219–22277, 2010CIMS Measurements of HO2 and RO2
R. S. Hornbrook et al.
Title Page
Abstract Introduction
Conclusions References
Tables Figures
◭ ◮
◭ ◮
Back Close
Full Screen / Esc
Printer-friendly Version
Interactive Discussion
Discussion
P
a
per
|
Dis
cussion
P
a
per
|
Discussion
P
a
per
|
Discussio
n
P
a
per
|
and likewise the measurement sensitivity to organic peroxy radicals. The concentration of NO in the inlet is changed by adding either pure NO or a 3000 ppmV (parts per million by volume) mixture of NO in N2 to the front injector of the inlet. To maintain a constant chain length of∆[H2SO4]/[HO2]o, inlet [SO2] is simultaneously adjusted by adding either pure SO2 gas or a 1% mixture of SO2 in N2 to the front injector gas 5
mixture. A serious drawback to this method is the time required to switch from HO2 measurement to HO2+RO2 measurement: on the order of 30 min to allow adequate time for the pure reagent gases to be flushed from the inlet. Using this method, the conversion efficiency of RO2 into HO2 (αRO2) is reported to be 0.10–0.15 using pure reagent gases and 0.80–0.90 using dilute reagent gas mixtures, giving an approximate 10
sixfold separation between HO2and HO2+RO2, but under timescales that are long in comparison to photochemistry and not ideal for aircraft measurements.
Using an inlet similar to the PeRCIMS inlet with the same conversion chemistry, Hanke et al. (2002) describe a CIMS method in which RO2 is selectively measured by adjusting the O2 concentration in the chemical conversion region to either enhance or
15
reduce the rate of (R3). This is done by diluting the sample flow by 75% or more with either O2 or N2. A constant sample flow is maintained while the [NO]/[O2] ratio in the inlet is increased or decreased. The authors reportedαRO2values of 0.25–0.30 with N2 dilution (HO2mode), and 0.90 with O2dilution (HO2+RO2mode), with measurements of both modes made approximately once per minute. While the reported one-minute 20
measurement cycle is more appropriate for timescales relevant to photochemistry and airborne measurements, the separation between HO2 and HO2+RO2 is weaker in comparison to the method described by Edwards and colleagues. Additionally, there is an inherent loss in sensitivity caused by diluting the ambient sample to one quarter or less of the sample flow.
25
adjust-ACPD
10, 22219–22277, 2010CIMS Measurements of HO2 and RO2
R. S. Hornbrook et al.
Title Page
Abstract Introduction
Conclusions References
Tables Figures
◭ ◮
◭ ◮
Back Close
Full Screen / Esc
Printer-friendly Version
Interactive Discussion
Discussion
P
a
per
|
Dis
cussion
P
a
per
|
Discussion
P
a
per
|
Discussio
n
P
a
per
|
ing the NO mixture flow rate, good separation can be achieved with only 50% dilution of the sample air. This enables independent [HO2] and [HO2+RO2] observations to be made each minute and simultaneously provides better measurement sensitivity and separation than with dilution alone. Although two measurement modes have been es-tablished for observations of ambient peroxy radicals via the new method, the modified 5
PeRCIMS inlet has been tested extensively in the laboratory under a wide range of [NO]/[O2] conditions to characterize the oxygen dilution modulation method under a variety of conditions and for a large selection of common organic peroxy radicals.
2 Experimental
2.1 Principles of operation
10
Shown in Fig. 1, the modified PeRCIMS instrument utilizes a technique in which am-bient HO2 and RO2 are chemically converted to HSO−4 ions that are then detected quantitatively by mass spectrometry. With the exception of the diluent region, the basic components of the instrument are similar to that described by Edwards et al. (2003), and thus only a summary is presented here.
15
2.2 Dilution
The primary modification to the instrumentation is the addition of a dilution region to the intake region of the inlet (Fig. 1, inset). Sample air containing peroxy radicals is drawn through a 2.7-mm diameter orifice into the dilution region of the PeRCIMS inlet where either N2 or O2 (UHP, United States Welding) is added. For ambient peroxy
20
ACPD
10, 22219–22277, 2010CIMS Measurements of HO2 and RO2
R. S. Hornbrook et al.
Title Page
Abstract Introduction
Conclusions References
Tables Figures
◭ ◮
◭ ◮
Back Close
Full Screen / Esc
Printer-friendly Version
Interactive Discussion
Discussion
P
a
per
|
Dis
cussion
P
a
per
|
Discussion
P
a
per
|
Discussio
n
P
a
per
|
from the dilution region of the inlet into the neutral chemistry region is 2.32 standard liters per minute (SLPM). Thus, to generate a 1:1 ratio of diluent to sample air, diluent O2and N2flow rates are controlled at 1.16 SLPM at sea level and adjusted to maintain a 1:1 ratio of diluent to sampled air for measurements at lower ambient pressures. Diluent gas switching is computer controlled using two low-volume three-way valves 5
(Clippard) to maintain a constant flow of gas into the dilution region and to minimize pressure pulses in the diluent lines.
2.3 Inlet conversion chemistry
The mixture of sampled air and diluent is drawn from the dilution region through a 0.50-mm diameter orifice into the neutral chemistry region of the inlet, controlled at a con-10
stant pressure of 150 Torr by a scroll pump (Air Squared) and a pressure controller (MKS 640). Two reagent mixtures, 1.5% NO in N2 and 4.0% SO2 in N2 (made in house using pure NO and SO2 gases and UHP N2) are added via the front injector at computer-controlled flow rates to generate NO mixing ratios of 15.0 and 67.5 ppmV and SO2 mixing ratios of 400 and 1800 ppmV for the HO2+RO2 and HO2 modes, 15
respectively.
In both modes, HO2 radicals are chemically converted via Reactions (R5–R8) into gas phase H2SO4 with a ∆[H2SO4]/[HO2]o yield of 5.5. As described by Edwards et al. (2003), ambient OH radicals are measured alongside peroxy radicals in the PeRCIMS inlet. However, because ambient [HO2]/[OH] ratios are typically 50–100,
20
the impact of OH on peroxy radical signals is insignificant given that peroxy radical measurement uncertainties are generally on the order of±30%.
The conversion chemistry involved in the measurement of organic peroxy radicals by CIMS was described by Edwards and colleagues as being only slightly more com-plex than the measurement of HO2, involving an initial conversion of RO2radicals with
25
ACPD
10, 22219–22277, 2010CIMS Measurements of HO2 and RO2
R. S. Hornbrook et al.
Title Page
Abstract Introduction
Conclusions References
Tables Figures
◭ ◮
◭ ◮
Back Close
Full Screen / Esc
Printer-friendly Version
Interactive Discussion
Discussion
P
a
per
|
Dis
cussion
P
a
per
|
Discussion
P
a
per
|
Discussio
n
P
a
per
|
H2SO4 in the same manner as ambient HO2. From extensive characterization exper-iments on the modified PeRCIMS inlet using a number of different RO2 precursors at [NO]/[O2]<1×10
−5
, we have determined that there is an additional reaction pathway by which organic peroxy radicals are converted into H2SO4in the PeRCIMS inlet. We will explore the inlet chemistry further in the discussion section.
5
2.4 Background measurement
Ambient H2SO4 and other chemical artifacts that react with SO2 in the inlet to form H2SO4 add to the peroxy radical signal measurement, and thus each peroxy radi-cal measurement in each mode is accompanied by a background measurement. To quantify the background, the SO2 mixture added to the front injector during the
sig-10
nal measurement is redirected to the rear injector of the neutral chemistry region (see Fig. 1). The inlet chemistry proceeds such that OH radicals formed in (R5) react with NO to form HONO via (R9) prior to encountering SO2, preventing the conversion of ambient peroxy radicals into H2SO4. The SO2mixture is directed to either the front or rear injector by a low-volume computer-controlled 3-way valve (Clippard). To maintain 15
constant and balanced flows through the injectors for the entire measurement cycle for both modes, additional quantities of N2 gas are added to the front and rear injec-tors. For typical operation, the duration of the background measurement is equal to the duration of the signal measurement. The actual peroxy radical concentration for each measurement mode is determined using the difference in the signal and background 20
measurements.
2.5 Ion chemistry
Immediately following the neutral chemistry region of the inlet is the ion chemistry re-gion where a fraction of the gas-phase H2SO4molecules is converted into HSO
ACPD
10, 22219–22277, 2010CIMS Measurements of HO2 and RO2
R. S. Hornbrook et al.
Title Page
Abstract Introduction
Conclusions References
Tables Figures
◭ ◮
◭ ◮
Back Close
Full Screen / Esc
Printer-friendly Version
Interactive Discussion
Discussion
P
a
per
|
Dis
cussion
P
a
per
|
Discussion
P
a
per
|
Discussio
n
P
a
per
|
scheme described by Tanner and Eisele (1995):
NO−
3+H2SO4→HNO3+HSO −
4. (R10)
A mixture of air, nitric acid vapor and NO is added to the inlet at the end of the neutral chemistry region to provide a sheath flow within the ion chemistry region. This sheath mixture includes 2.32 SLPM of ambient air that has passed through a chemical scrub-5
ber to remove trace SO2, as well as∼1.5 sccm (standard cubic centimeters per minute) of N2 that has passed through the headspace of a vial containing liquid concentrated HNO3and∼5 sccm of the 1.5% NO in N2mixture. NO
−
3 ions are produced as the HNO3 vapor in the sheath flow is ionized by O−2 and other more primary products generated by the radioactive source (241Am). The NO added to the sheath air helps to lower the 10
background by reacting with OH and other radicals produced by the source emission.
2.6 Ion detection
At the rear of the ion region, HSO−4 ions are directed through a 0.2-mm diameter pinhole by a series of ion lenses located throughout the inlet and inside the vacuum system, along with other negatively-charged ions (i.e. NO−3 and clusters of NO−3 or HSO−4 with 15
neutral species). An N2 buffer flow (200 sccm), immediately before the pinhole and greater than the flow into the pinhole, serves to prevent oxygen and other neutral gases from entering the vacuum system, while allowing ions, with the help of an electric field, to pass through while also reducing H2O clustered with the ions.
For different applications or platforms, the PeRCIMS inlet has been affixed to a num-20
ber of different vacuum systems, but the primary components in these vacuum systems are similar. Depending on the diameter and volume of the vacuum system, two or three turbomolecular pumps (Varian V550, Varian V301, Balzer-Pfeiffer TCP-380), mounted orthogonally to the ion stream and backed by a scroll pump (Air Squared, Synergy or Varian) are used to pump the vacuum system to pressures of 4×10⁻⁴Pa or less. 25
ACPD
10, 22219–22277, 2010CIMS Measurements of HO2 and RO2
R. S. Hornbrook et al.
Title Page
Abstract Introduction
Conclusions References
Tables Figures
◭ ◮
◭ ◮
Back Close
Full Screen / Esc
Printer-friendly Version
Interactive Discussion
Discussion
P
a
per
|
Dis
cussion
P
a
per
|
Discussion
P
a
per
|
Discussio
n
P
a
per
|
ions. The CDC region is kept at a constant a pressure, ideally∼10 Pa, determined by the diameter of the orifice at the rear of the CDC, typically between 6 and 10 mm. After passing through the CDC, ions are guided further into the vacuum system either by a series of ion lenses or by an octopole ion guide assembly mounted immediately after the CDC, and are then mass-selected by a quadrupole mass filter with additional ion 5
lenses before and after the quadrupoles. At the rear of the vacuum system, the ions selected by the mass filter are detected by a channel electron multiplier (Ceramax, K&M Electronics) biased in the negative ion pulse counting mode.
The ratio of the NO−3 and HSO−4 counting frequencies (counts/s) is proportional to the peroxy radical signalS according to:
10
S=
(fHSO−
4,signal)−(fHSO
−
4,background) (fNO−
3)−(felectronic noise)
(1)
wherefHSO−
4,signalandfHSO
−
4,backgroundare the HSO
−
4counting frequencies when the SO2 mixture is directed through the front and rear injectors, respectively, andfelectronic noiseis the counting frequency of a region of the mass spectrum where there are not typically ions present, typically m/z 20 or 70. Generally, f
electronic noise≪fNO−
3 , and thus this 15
correction is only minor and the electronic noise measurement serves to confirm that there is not significant electronic noise present in the system.
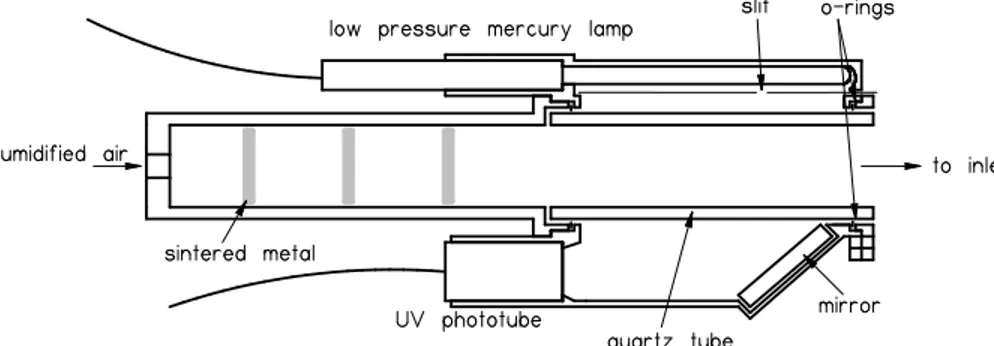
2.7 Calibration
In a quartz calibration cell positioned in front of the inlet (Fig. 2), H2O molecules are photolyzed by a low pressure Hg lamp (UVP, Jelight or Hamamatsu) with a quartz 20
envelope emitting in the UV range (primarily at 184.9 and 253.7 nm) via:
H2O(g)+hν(184.9 nm)→OH+H (R11)
ACPD
10, 22219–22277, 2010CIMS Measurements of HO2 and RO2
R. S. Hornbrook et al.
Title Page
Abstract Introduction
Conclusions References
Tables Figures
◭ ◮
◭ ◮
Back Close
Full Screen / Esc
Printer-friendly Version
Interactive Discussion
Discussion
P
a
per
|
Dis
cussion
P
a
per
|
Discussion
P
a
per
|
Discussio
n
P
a
per
|
Air at a desired absolute humidity is generated by combining flows of dry synthetic air (US Welding, Hydrocarbon Free, total hydrocarbons≤0.1 ppm) with synthetic air that has been saturated by passing through a 303-K temperature-controlled vessel con-taining PTFE spheres (Hoover Precision Products, Inc.; 1/4-in. diameter) wetted with deionized water. The humidity of the air mixture is monitored continually by directing 5
100 sccm of the total air mixture flow (5–20 SLPM) through a hygrometer (DewPrime III, Edgetech).
Radical production is controlled by varying the amount of radiation passing through the cell and the water vapor mixing ratio of the synthetic air. The amount of radiation in the calibration cell can be controlled by adjusting the distance between the lamp 10
and the cell or by inserting slits of differing widths in the path of the radiation. Both of these properties could be adjusted on the previous calibration cell assembly (shown by Edwards et al., 2003), but only the slit width can be adjusted on the current calibration assembly (Fig. 2). Radical concentrations similar to those found in the atmosphere and greater are generated using this method. From Cantrell et al. (1997a, b), the yield of 15
HO2radicals from the photolysis of water can be determined using
[HO2]=(It)σH2OφH2O[H2O] (2)
where σH
2O is the absorption cross section of water vapor (i.e. 7.22×10⁻²⁰cm2molecule−1) and φH
2O is the photolysis quantum yield (assumed to be unity) at 184.9 nm. The quantityItis the product of the lamp flux and the photolysis 20
time, and is determined for each calibration cell assembly in separate N2O actinometry experiments for specific slits and flow rates through the calibration cell.
To generate a fixed hydroperoxy radical concentration, H2 (United States Welding or National Specialty Gases) is added to the humidified air flow. OH formed in (R11) reacts with H2to generate HO2according to
25
H2+OH→H2O+H (R13)
ACPD
10, 22219–22277, 2010CIMS Measurements of HO2 and RO2
R. S. Hornbrook et al.
Title Page
Abstract Introduction
Conclusions References
Tables Figures
◭ ◮
◭ ◮
Back Close
Full Screen / Esc
Printer-friendly Version
Interactive Discussion
Discussion
P
a
per
|
Dis
cussion
P
a
per
|
Discussion
P
a
per
|
Discussio
n
P
a
per
|
Thus, the total [HO2] produced is 2(It)σH2OφH2O[H2O]. In the absence of added H2, the OH will react with trace gases in the synthetic air and will create an unknown mixture of hydroperoxy and organic peroxy radicals.
3 Instrument characterization
A number of tests have been performed on the PeRCIMS instrument to characterize the 5
inlet chemistry and to establish the ambient measurement modes for optimum sensitiv-ity and separation of HO2 and HO2+RO2. These characterizations were made using both the previous and current calibration cell assemblies described above for absolute calibrations. In general, H2 and CH4 (or another RO2 precursor) are added individu-ally to the humidified air that passes through the calibration cell, with the output of the 10
cell directly in front of the PeRCIMS inlet. Generating organic peroxy radicals using H2O photolysis is preferential to using Cl atom+precursor reactions as OH chemistry produces RO2 species more commonly encountered in the atmosphere. As with the absolute calibration, OH radicals formed via (R11) react with H2to generate a second HO2 for each water molecule photolyzed, according to (R13) and (R14). Adding CH4
15
in place of H2generates a methyl peroxy radical according to:
CH4+OH→H2O+CH3 (R15)
CH3+O2(+M)→CH3O2(+M), (R16)
resulting in equal parts HO2and CH3O2radicals. The background-corrected signals of the peroxy radicals generated from the addition of the two precursors,SCH4 andSH2,
20
under otherwise identical inlet conditions, are used to determineαCH3O2(the conversion efficiency or measurement sensitivity to CH3O2in comparison to HO2) according to:
αCH3O2=2×
SCH4,ave
SH2,ave
!
ACPD
10, 22219–22277, 2010CIMS Measurements of HO2 and RO2
R. S. Hornbrook et al.
Title Page
Abstract Introduction
Conclusions References
Tables Figures
◭ ◮
◭ ◮
Back Close
Full Screen / Esc
Printer-friendly Version
Interactive Discussion
Discussion
P
a
per
|
Dis
cussion
P
a
per
|
Discussion
P
a
per
|
Discussio
n
P
a
per
|
or, in general for any organic peroxy radical precursor, RH:
αRO2=2×
SRH,ave
SH2,ave
!
−1. (4)
Determinations ofαRO2 have been made for a number of RO2precursors over a wide range of [NO]/[O2] values between 10
−2
and 10−6. Each αRO2 determination requires a peroxy radical measurement with H2added to the humidified synthetic air, and a per-5
oxy radical measurement with CH4 or other RO2 precursor added. Reported αRO2 values were determined using SRH,ave and SH2,ave, the respective means of approxi-mately four consecutive individual SRH measurements andSH2 measurements, such that all measurements are made within∼10 min.
To characterize the inlet chemistry and establish the two ambient observation modes, 10
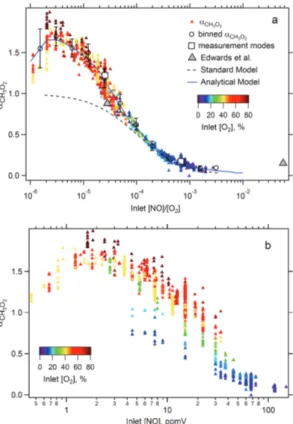
a broad set of operating conditions have been tested with a variety of peroxy radical precursors and concentrations and are described in the following sections. To ensure ideal conditions for each αRO2 determination, individual calibration parameters were investigated to determine ideal operating ranges for the total flow rate through the cali-bration cell and the concentrations of the radical precursors. The results of these tests 15
are discussed in the following section. Using conditions that fell within these ideal op-erating parameters, αCH3O2 has been measured more than 1000 times over a broad range of inlet [NO] and [NO]/[O2]. The results of these measurements are shown in Fig. 3. With inlet [NO]<2 ppmV, there is lessαCH3O2 dependence on inlet [O2], but for inlet [NO]>2 ppmV, the concentration of O2 in the inlet plays a more important role in 20
determiningαCH3O2, and the ratio of [NO]/[O2] is key. TheαCH3O2 data were binned by [NO]/[O2] value, and the mean αCH3O2 values for each bin are shown in Fig. 3a and listed in Table 2 along with the meanαCH
ACPD
10, 22219–22277, 2010CIMS Measurements of HO2 and RO2
R. S. Hornbrook et al.
Title Page
Abstract Introduction
Conclusions References
Tables Figures
◭ ◮
◭ ◮
Back Close
Full Screen / Esc
Printer-friendly Version
Interactive Discussion
Discussion
P
a
per
|
Dis
cussion
P
a
per
|
Discussion
P
a
per
|
Discussio
n
P
a
per
|
3.1 Calibration parameter experiments
3.1.1 Total flow rate through the calibration cell
The concentration of radicals formed in the calibration cell depends on both the total flow rate of the humidified air mixture through the cell and the amount of irradiation with which the water vapor in the air is exposed, It (Eq. 3). The ideal total flow rate
5
through the calibration cell was determined for three lamp intensities (generated with the lamp at three different distances from the cell using the old calibration cell appara-tus) at five different total calibration cell flow rates. For each flow rate, the relative flow rates of saturated and dry air were held constant at 1:10, or∼9.1% relative humidity at room temperature. For all measurements reported for this test the inlet [NO]/[O2]
10
was 1.29×10⁻⁵with 1.0 SLPM of O2added to the dilution region, and 10 sccm each CH4 and H2. A minimum of two αCH3O2 measurements (8 individual measurements with each precursor) were made for each lamp distance at each total air flow rate. A summary of the results of the test is shown in Table 3.
The measured αCH3O2 values indicate that with a specified concentration of water,
15
a minimum flow rate through the calibration cell is necessary, as it is otherwise possible to generate too many peroxy radicals to be quantitatively converted to H2SO4without requiring a correction for NO−3 depletion in the inlet. With a constant water vapor mixing ratio, a slower total flow rate results in a longer exposure time to irradiation in the calibration cell and thus a larger fixed radical concentration. To avoid needing to correct 20
ACPD
10, 22219–22277, 2010CIMS Measurements of HO2 and RO2
R. S. Hornbrook et al.
Title Page
Abstract Introduction
Conclusions References
Tables Figures
◭ ◮
◭ ◮
Back Close
Full Screen / Esc
Printer-friendly Version
Interactive Discussion
Discussion
P
a
per
|
Dis
cussion
P
a
per
|
Discussion
P
a
per
|
Discussio
n
P
a
per
|
3.1.2 Water vapor mixing ratio
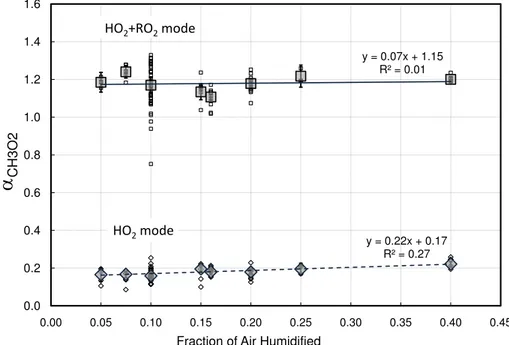
The modified PeRCIMS inlet has also been tested using a range of water vapor mixing ratios in the calibration cell air mixture to establish whether or not there is stability across a range of humidities by measuringαCH3O2at the ambient mode conditions. The total flow through the calibration cell was held constant at 5 SLPM, but the relative flows 5
of saturated air and dry synthetic air were adjusted to generate humidified fractions ranging from 5 to 40% of the total flow. During these measurements, alternating diluent N2 and O2were added to generate a 1:1 ratio with the sample air from the calibration cell, and 10 sccm of alternating CH4 and H2 were added to the humidified air. The resulting αCH3O2 values, as well as the error-weighted mean αCH3O2 value for each
10
humidity studied are shown in Fig. 4.
From the water vapor calibration test,αCH3O2 appears to be independent of the hu-midity of the calibration air mixture over a range of saturations from 5 to 25%. Based on the results from this test, we have confidence in other experiments that were performed under similar conditions with 10% saturated air in the calibration cell. There is, how-15
ever, a lower limit on the absolute water vapor mixing ratio in the inlet for conversion of ambient peroxy radicals into H2SO4. This is based on (R8), in which the rate of the conversion of SO3 into H2SO4 is proportional to the square of the water mixing ratio in the inlet. We have calculated the lower limit for water content over a range of atmo-spheric relative humidities and temperatures, and have determined that the PeRCIMS 20
is sufficiently sensitive (i.e. the calibration factors are stable with regards to the mea-surement of peroxy radicals) under the majority of tropospheric conditions. However, because the sampled air is drawn from ambient pressure into a low pressure region and being diluted 1:1 with dry N2or O2, there are possible ambient conditions in which the measurement sensitivity could be lowered. This typically involves air masses that 25
ACPD
10, 22219–22277, 2010CIMS Measurements of HO2 and RO2
R. S. Hornbrook et al.
Title Page
Abstract Introduction
Conclusions References
Tables Figures
◭ ◮
◭ ◮
Back Close
Full Screen / Esc
Printer-friendly Version
Interactive Discussion
Discussion
P
a
per
|
Dis
cussion
P
a
per
|
Discussion
P
a
per
|
Discussio
n
P
a
per
|
modifications to the sampling procedure. For field studies in which conditions are be-low these minimum relative humidity curves, we have developed a method in which a fraction of the diluents (N2and O2) are humidified to add sufficient water vapor to the inlet.
3.1.3 Peroxy radial precursor concentration
5
The calibration andαRO2 characterizations of the peroxy radical measurement rely on the OH-chemistry of CH4and H2in the calibration cell to generate reproducible mixing ratios of HO2 and CH3O2. When insufficient amounts of CH4 or H2 are added to the humidified air, trace contaminants in the air or other reagent gases can react with OH in place of CH4 and H2, generating unknown [CH3O2], [HO2] or other radicals. With
10
excessively high CH4or H2mixing ratios, the conversion of CH3O2and HO2to H2SO4 in the inlet will not reach completion due to competition with SO2for OH. To determine the ideal concentration range of peroxy radical precursors in the calibration cell flow, two tests were performed using a range of CH4 and H2 flow rates added to the total calibration flow.
15
In the first test, αCH3O2 was determined at three [NO]/[O2] ratios (9.30×10 −6
, 1.86×10⁻⁵, 2.80×10⁻⁵) for a series of CH4 mixing ratios (0.04, 0.10, 0.18, 0.40, 0.99, and 1.96, all % by volume) in 5.0 SLPM of 10% humidified air. For the first six tests [H2] was kept equal to [CH4] for eachαCH3O2 determination, and for the last two tests, [H2] was approximately twice and half the CH4mixing ratios of 0.10% and 0.18%,
20
respectively. For each CH4mixing ratio, αCH3O2 is reported as the average of at least four determinations made at each inlet [NO]/[O2], generated by diluting the air from the calibration assembly by one quarter with O2and adding NO to the front injector to generate inlet NO mixing ratios of 3.75, 7.50 and 11.25 ppmV, respectively. The results of this experiment are shown in Fig. 6.
25
ACPD
10, 22219–22277, 2010CIMS Measurements of HO2 and RO2
R. S. Hornbrook et al.
Title Page
Abstract Introduction
Conclusions References
Tables Figures
◭ ◮
◭ ◮
Back Close
Full Screen / Esc
Printer-friendly Version
Interactive Discussion
Discussion
P
a
per
|
Dis
cussion
P
a
per
|
Discussion
P
a
per
|
Discussio
n
P
a
per
|
ranging from 0.010% to 0.99%. Thus, the measuredαCH3O2 is significantly less sensi-tive to the absolute H2concentration in the calibration mixture than it is to the concen-tration of the RO2precursor. For this reason, [H2] was held constant during the second precursor concentration test at a concentration large enough to ensure that the HO2 radicals measured were formed from the photolysis of water and the reaction of OH 5
with H2.
The second test involved a series of αCH3O2 determinations in the two ambient modes, with [NO]/[O2] ratios of 2.80×10⁻⁵and 6.80×10⁻⁴. For this test, a wider range of [CH4] in the air mixture was generated using single and double dilution techniques to add CH4to a 5.0 SLPM flow of humidified air. For the single-dilution technique,
be-10
tween 2 and 100 sccm of CH4was added directly to the humidified air via a 100 sccm mass flow controller (MFC). The double dilution required an initial step in which a small flow of CH4 was added to a secondary flow of synthetic air using a 10 sccm MFC and the resulting diluted mixture of CH4 in air was added to the humidified air via the 100 sccm MFC. During the double dilution, the initial CH4 in air mixture was vented
15
to maintain a constant pressure approximately 25 mbar above ambient pressure, al-lowing a constant flow through the 100 sccm MFC. Using the two dilution techniques, calibration-cell methane concentrations ranging from 20 ppmV to 2.0% were generated for subsequentαCH3O2 measurements. For this experiment, [H2] in the calibration flow was kept constant at 0.18% for the HO2mode of the determinations. The results of this 20
experiment are shown in Fig. 7.
From the second precursor test, it is evident that there are both upper and lower limits for the required concentration of RO2 precursors in the calibration cell. With decreasing CH4 concentrations of 0.010% or less, the measuredαCH3O2,low values for the HO2+RO2 mode decrease significantly, most likely due to trace species in the
25
ACPD
10, 22219–22277, 2010CIMS Measurements of HO2 and RO2
R. S. Hornbrook et al.
Title Page
Abstract Introduction
Conclusions References
Tables Figures
◭ ◮
◭ ◮
Back Close
Full Screen / Esc
Printer-friendly Version
Interactive Discussion
Discussion
P
a
per
|
Dis
cussion
P
a
per
|
Discussion
P
a
per
|
Discussio
n
P
a
per
|
calibration purposes, the concentration of RO2precursors in the calibration cell should fall between 0.010% and 1.0% equivalent methane reactivity, ideally in the range of 0.05% to 0.2%, corresponding to an OH reactivity of∼60 to 250 s−1.
Using the optimized conditions established for the above calibration cell parameters, i.e. total flow rate through the calibration cell, water vapor concentration in the calibra-5
tion cell air mixture, and RO2precursor concentration, the parameters described in the following sections were explored to better characterize the PeRCIMS instrument.
3.2 PeRCIMS characterization experiments
3.2.1 Ambient pressure dependence
A modified calibration cell that can be sealed onto the sample intake end of the 10
PeRCIMS inlet was used to determine the dependence of αCH3O2 on ambient pres-sure. For this test, absolute calibrations andαCH3O2 determinations were made at the HO2and HO2+RO2measurement modes at a range of calibration cell pressures. To achieve a range of pressures at the PeRCIMS intake, a pressure controller and pump were attached to a side port on the calibration cell, downstream of the Hg lamp, to con-15
trol the pressure in the calibration cell to a desired pressure between 400 and 933 Torr. For these measurements, the air mixture in the cell consisted of 5 SLPM of 10% sat-urated synthetic air with alternating CH4 and H2 at 0.18%, and the flow rates of the reagent gases and diluents were adjusted according to the sample flow rate into the inlet from the calibration cell. The results from this test are listed in Table 4. Fitted 20
slopes of the results for αCH3O2 versus pressure for the HO2 and HO2+RO2 modes are statistically insignificant at the 98% Confidence Intervals. This is consistent with the inlet being at a constant reduced pressure, and thus the inlet chemistry regulating the conversion of peroxy radicals into H2SO4 is independent of the pressure outside the inlet.
25
ACPD
10, 22219–22277, 2010CIMS Measurements of HO2 and RO2
R. S. Hornbrook et al.
Title Page
Abstract Introduction
Conclusions References
Tables Figures
◭ ◮
◭ ◮
Back Close
Full Screen / Esc
Printer-friendly Version
Interactive Discussion
Discussion
P
a
per
|
Dis
cussion
P
a
per
|
Discussion
P
a
per
|
Discussio
n
P
a
per
|
proportional to the ambient pressure (Pamb) provided∆P/Pamb>0.5, where∆P is the difference between ambientP and the inletP (Green and Perry, 2007). When∆P/Pamb is less than 0.5, the flow is a function of both the ambient and inletP. Thus, for ambient pressures less than 300 Torr, the flow through the orifice into a 150 Torr inlet becomes non-linear. Although the inlet chemistry has been optimized for an inlet pressure of 5
150 Torr, wherePamb<300 Torr the inlet pressure can be reduced to 100 Torr to keep the sample flow rate linear withPamb.
3.2.2 RO2Precursor characterization
The sensitivity dependence of the PeRCIMS instrument to CH3O2radicals on the ratio of [NO]/[O2] and on the absolute concentration of [NO] in the inlet have been shown 10
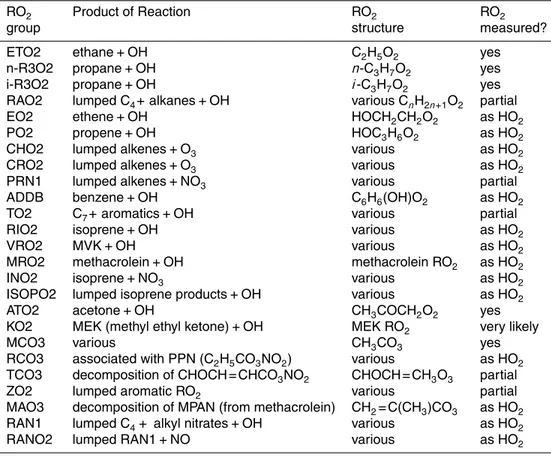
(Fig. 3). However, the general term RO2 includes many other organic peroxy radical species which may undergo different chemistry in the PeRCIMS inlet. Thus, the sensi-tivity of the PeRCIMS measurement to organic peroxy radicals other than CH3O2must be quantified.
Edwards et al. (2003) reported a series of αRO2 values for organic peroxy radicals
15
generated via reactions of Cl atoms with a series of RO2 precursors including alka-nes, alkenes and aromatic compounds. These αRO2 were determined at two inlet [NO]: essentially an HO2 mode and an HO2+RO2 mode with inlet [NO]/[O2] ratios of 1.2×10⁻²and 2.5×10⁻⁵, respectively. In ambient air, however, the majority of RO2 radicals are formed via OH-oxidation of the parent hydrocarbon. Hence, theαRO2
val-20
ues that we report here are based on measurements of RO2generated from reactions with OH radicals. This is of particular importance for peroxy radicals from OH-reactions with unsaturated non-methane hydrocarbons (NMHC), which typically differ from those generated via unsaturated NMHC-Cl reactions (Orlando et al., 2003; Suh et al., 2003; Taatjes, 1999; Atkinson, 2000). As well, we present measurements ofαRO2 for a
num-25
ACPD
10, 22219–22277, 2010CIMS Measurements of HO2 and RO2
R. S. Hornbrook et al.
Title Page
Abstract Introduction
Conclusions References
Tables Figures
◭ ◮
◭ ◮
Back Close
Full Screen / Esc
Printer-friendly Version
Interactive Discussion
Discussion
P
a
per
|
Dis
cussion
P
a
per
|
Discussion
P
a
per
|
Discussio
n
P
a
per
|
The same double dilution apparatus discussed in the previous section for adding small flows of methane to the calibration flow was employed here. Gas-phase RO2 precursors were added via the 10-sccm mass flow controller such that the combined flow rates from the two dilutions resulted in OH reactivities within the optimized range for methane reactivity (60 to 250 s−1). For RO2precursors in the liquid phase at room 5
temperature, dry synthetic air was passed through the 10-sccm mass flow controller, then through the headspace of a vial containing a small volume of the precursor. The pressure in the vial and manifold was monitored and vented through a needle valve to maintain a constant pressure approximately 25 mbar above ambient. Thus, the con-centration of the precursor in the synthetic air flow could be calculated from its vapor 10
pressure, and an appropriate amount was added to the calibration gas flow to generate OH reactivities in the ideal range.
A total of 17 different NMHC RO2 precursors were used to create RO2 radicals that were subsequently measured using the PeRCIMS instrument across a range of [NO]/[O2]. The results of the αRO2 determinations for each of these precursors were
15
grouped into three different subgroups, C2−C5 alkanes (i.e. NMHC with between two and five carbon atoms), C6−C7 alkanes, and unsaturated hydrocarbons. These are plotted along with the measurements of αCH3O2 for comparison in Fig. 8. For some RO2precursors, a mixture of RO2radicals are generated during reaction with OH and the reportedαRO2 values are a weighted mean of the individual values. For each
pre-20
cursor, the mean of all αRO2 determinations made within ±15% of the two ambient measurement modes are shown in Fig. 9, and are also listed in Table 5 with literature OH rate coefficients.
In Fig. 8a, it is clear that the majority of C2−C5 NMHC precursors generate RO2 radicals with similar αRO2 behavior to methylperoxy radicals, but with slightly higher
25
RO2sensitivity over the entire [NO]/[O2] range measured. Overall, the separation be-tween the HO2-mode and HO2+RO2-mode (∆αRO2) is similar to methane for each of these RO2 precursors. The primary exceptions to this are methylpropane with signifi-cantly lowerαRO
ACPD
10, 22219–22277, 2010CIMS Measurements of HO2 and RO2
R. S. Hornbrook et al.
Title Page
Abstract Introduction
Conclusions References
Tables Figures
◭ ◮
◭ ◮
Back Close
Full Screen / Esc
Printer-friendly Version
Interactive Discussion
Discussion
P
a
per
|
Dis
cussion
P
a
per
|
Discussion
P
a
per
|
Discussio
n
P
a
per
|
withαRO2 values that deviate from those of the other precursors such that it is much higher thanαCH3O2 in the HO2mode region. Possible reasons for these differences are discussed below.
The majority (>70% at or below 298 K) of methylpropane-OH reactions occur via abstraction of the tertiary hydrogen, resulting in a tert-butoxy radical after
subse-5
quent reaction with NO (Eq. 1) in the PeRCIMS inlet (Atkinson, 1997; Tully et al., 1986). With no α-hydrogen atoms, the tert-butoxy radical cannot react with O2 to
generate HO2 via Reaction (R3). Rather, it either decomposes unimolecularly to gen-erate a methyl fragment which must undergo further reaction in the inlet to gener-ate HO2 (decomposition lifetime is ∼1 ms at 298 K and 760 Torr and is in the fall-off
10
region) (Atkinson, 2007) or react with NO via Reaction (R2) to form tert-butylnitrite
(kNO,295 K=(2.9±0.2)×10 −11
cm3s−1, 5 to 80 Torr (Lotz and Zellner, 2000; Atkinson, 2007). With ppmV levels of [NO] in the 150 Torr inlet,tert-butoxy+NO is likely much
faster than the unimolecular decomposition, hence the sensitivity of the PeRCIMS in-strument to tert-butylperoxy radicals is low. The signal that is seen from the
methyl-15
propane reaction is due to the OH-abstraction of a primary hydrogen atom, resulting in 2-methylpropoxy radicals. The results for 3-methylpentane in Fig. 8b indicate similar behavior, with αRO2 values that tend to be lower than other C6 alkanes. This is con-sistent with the formation of alkoxy radicals with noα-hydrogen atoms. However, this behavior is not evident in the methylbutane and 2-methylpentane results (Fig. 8a and 20
b), both havingαRO2 values closer to the n-alkane with the same number of straight-chain carbon atoms.
From then-pentane precursor reactions, the measuredαRO2 values are increasingly larger than αCH3O2 values with increasing [NO]/[O2], as are the αRO2 values from the C6 and C7 alkane precursors in Fig. 8b. This is most likely due to n-pentane and
25
ACPD
10, 22219–22277, 2010CIMS Measurements of HO2 and RO2
R. S. Hornbrook et al.
Title Page
Abstract Introduction
Conclusions References
Tables Figures
◭ ◮
◭ ◮
Back Close
Full Screen / Esc
Printer-friendly Version
Interactive Discussion
Discussion
P
a
per
|
Dis
cussion
P
a
per
|
Discussion
P
a
per
|
Discussio
n
P
a
per
|
ability to deselect the resultant RO2radical in the HO2 mode decreases, and thus the separation between HO2and HO2+RO2becomes smaller.
In Fig. 8c, the αRO2 values from the unsaturated NMHC precursors have a similar dependence on [NO]/[O2] as larger alkane RO2 precursors. In general, alkene-OH re-actions occur as addition rere-actions, forming hydroxyalkyl radicals that react with O2
un-5
der atmospheric conditions to formβ-hydroxyalkyl peroxy radicals (andδ-hydroxyalkyl peroxy radicals where conjugated double bonds are present). In high [NO] environ-ments (i.e. the PeRCIMS inlet), these peroxy radicals react with NO forming primarily hydroxyalkoxy radicals that can decompose unimolecularly (typically generating HO2), isomerize or react with O2to carbonyl compounds and HO2(Atkinson, 1997). Thus, in 10
the PeRCIMS inlet, (R2) is unsuitable for suppression of the conversion of the hydrox-yalkoxy radical to HO2for alkene-precursor RO2and therefore the separation between HO2 and HO2+RO2 is lessened. Aromatic hydrocarbons undergo a combination of addition and abstraction reactions with OH radicals (Atkinson, 2000), so with benzene and toluene as RO2 precursors, the impact of rearrangement and dissociation
lead-15
ing to HO2 is seen in the measured αRO2, but to a lesser degree. Overall, due to the differences in sensitivity of the PeRCIMS to different RO2radicals, reported measure-ments of ambient HO2+RO2 and HO2must account for the relative reactivity of RO2 precursors in the air masses being studied.
3.2.3 Standard model vs. analytical model
20
Applying standard tropospheric chemistry to the inlet yields the expected behavior of equal yields of H2SO4 from HO2 and CH3O2 radicals at small [NO]/[O2] (α=1), and small yields of H2SO4for RO2relative to HO2at large [NO]/[O2] (α→0). This standard model was presented in Edwards et al. (2003), and is shown in Fig. 3a. It can be seen that the observations ofαCH3O2differ significantly from the standard model for low
25
ACPD
10, 22219–22277, 2010CIMS Measurements of HO2 and RO2
R. S. Hornbrook et al.
Title Page
Abstract Introduction
Conclusions References
Tables Figures
◭ ◮
◭ ◮
Back Close
Full Screen / Esc
Printer-friendly Version
Interactive Discussion
Discussion
P
a
per
|
Dis
cussion
P
a
per
|
Discussion
P
a
per
|
Discussio
n
P
a
per
|
for these conditions, or that H2SO4is produced in addition to the conversion to HO2. On the other hand, agreement between the observations and the standard model at large [NO]/[O2] values is reasonable, in contrast to the results of Edwards et al. (2003) (Fig. 3a). We believe that the larger than expected α values observed by Edwards et al. were due to contaminants in the zero air used in their experiments. We found 5
it necessary to use the cleanest synthetic air available (so-called Hydrocarbon Free, with VOC content less than 0.1 ppmV) to avoid this artifact. Edwards and colleagues did not observe the larger than unity α values at low [NO]/[O2], likely because their measurements were not made at sufficiently low [NO]/[O2] ratios (minimum ratio of 2.8×10⁻⁵).
10
What reactants could convert SO2into H2SO4and/or RO2into HO2with yields lead-ing to apparentα values greater than unity at low [NO]/[O2], while maintaining the inef-ficient conversion at high [NO]/[O2]? Possible candidates are RO2and RO, or unknown chemistry involving OH and/or HO2. RO would seem reasonable by analogy with OH. RO2is unlikely, although several papers appear in the literature discuss the oxidation 15
of SO2 by CH3O2 (e.g., Kan et al., 1981 and references therein). Current thinking is that the direct oxidation of SO2is quite slow (<10−16cm3molecule−1s−1 Sander and Watson, 1981). On the other hand, Kan et al. (1981) argue for a multiple-step mecha-nism involving two equilibria, which results in the oxidation of SO2while preserving the CH3O2radicals.
20
Yields of HO2 and H2SO4 from the reactions of RO2 radicals within the instrument inlet were calculated in the following way, and compared with the laboratory mea-sured values. Each RO2 precursor reacts with OH to produce one or more isomers. The yields of these isomers have been reported in the literature for some reactants, and structure activity relationships have been developed to predict the isomer yields 25
ACPD
10, 22219–22277, 2010CIMS Measurements of HO2 and RO2
R. S. Hornbrook et al.
Title Page
Abstract Introduction
Conclusions References
Tables Figures
◭ ◮
◭ ◮
Back Close
Full Screen / Esc
Printer-friendly Version
Interactive Discussion
Discussion
P
a
per
|
Dis
cussion
P
a
per
|
Discussion
P
a
per
|
Discussio
n
P
a
per
|
tropospheric chemistry.
RO2+NO→RO+NO2(+M)→RONO2 (R17)
RO+O2→R ′
R′′
CO+HO2 (R18)
RO+M→R′· +R′′
CHO (R19)
RO→HO−R′·+O2+M→HO−RO2+M. (R20)
5
Following isomerization (R20) or decomposition (R19), the alkyl radical adds to O2 to form a new organic peroxy radical, which cascades through the sequence. When produced, HO2reacts as described earlier. We found it not possible to explain our lab-oratory observations of the sensitivity of RO2radicals in our instrument. Missing from this chemistry are reactions between peroxy and alkoxy radicals and SO2. Although
10
not recognized as relevant to tropospheric chemistry, based on analogy with OH and HO2, we might speculate that RO would react with SO2leading to SO3and other prod-ucts. Edwards et al. (2003) proposed a reaction between CH3O and SO2 to explain their observation of higher than expected H2SO4 yields at high [NO]/[O2] ratios. No detailed mechanism was proposed, other than to indicate that H2SO4 was eventually 15
produced along with other non-radical or slowly reacting products.
Kan et al. (1981) reported results of detailed laboratory chamber studies of the ki-netics and mechanism of reactions between CH3O2, CH3O and CH3 with SO2 in the presence of O2and NO. They argue that these reactions involve multiple equilibria be-tween the radicals, SO2and O2. They also explain that conventional flow tube kinetics
20
studies do not observe a reaction between CH3O2and SO2due to the absence of O2, resulting in the recommended (Sander et al., 2006) rate coefficient for CH3O2+SO2 at an upper limit of 5×10⁻¹⁷cm3molecule−1s−1. This is discussed in a footnote in Sander et al. (2006) with the conclusion that the decomposition of the CH3O2SO2 adduct back to CH3O2and SO2likely dominates under atmospheric conditions. While
25
ACPD
10, 22219–22277, 2010CIMS Measurements of HO2 and RO2
R. S. Hornbrook et al.
Title Page
Abstract Introduction
Conclusions References
Tables Figures
◭ ◮
◭ ◮
Back Close
Full Screen / Esc
Printer-friendly Version
Interactive Discussion
Discussion
P
a
per
|
Dis
cussion
P
a
per
|
Discussion
P
a
per
|
Discussio
n
P
a
per
|
H2SO4 in our instrument inlet. We hypothesize that there are three potential mecha-nisms that produce H2SO4 without consumption of radicals. Mechanism (a) involves the reaction between RO2and SO2along the lines of Kan et al. (1981)
RO2+SO2+M→RO2SO2+M (R21)
RO2SO2+O2+M→RO2SO2O2+M (R22)
5
The RO2SO2O2 behaves like any other peroxy radical, primarily reacting with NO in our inlet.
RO2SO2O2+NO→RO2SO2O+NO2 (R23)
The alkoxy radical produced could potentially undergo a number of reactions, but de-composition is most likely.
10
RO2SO2O→RO2+SO3 (R24)
This mechanism produces SO3and eventually H2SO4without consumption of radicals, and has the potential to explain our laboratory measurements. Overall, the reaction involves the catalytic oxidation of SO2to SO3.
RO2+SO2+O2+NO→→RO2+SO3+NO2 (R25)
15
Mechanism (b), also discussed by Kan et al. (1981), involves the reaction between RO and SO2resulting in production of RO and SO3. The chemistry is similar to that shown for RO2+SO2, with the final reaction involving the decomposition of ROSO2O into RO and SO3and an overall reaction:
RO+SO2+O2+NO→→RO+SO3+NO2 (R26)
20
Mechanism (c) involves reaction between RO and SO2leading to RO2and SO3. This is only slightly different than mechanism (b), but will lead to lower yields when the nitrate yield in the reaction of RO2with NO is significant.
ACPD
10, 22219–22277, 2010CIMS Measurements of HO2 and RO2
R. S. Hornbrook et al.
Title Page
Abstract Introduction
Conclusions References
Tables Figures
◭ ◮
◭ ◮
Back Close
Full Screen / Esc
Printer-friendly Version
Interactive Discussion
Discussion
P
a
per
|
Dis
cussion
P
a
per
|
Discussion
P
a
per
|
Discussio
n
P
a
per
|
ROSO2+O2→RO2+SO3 (R28)
ROSO2+M→R+SO3 (R29)
R+O2+M→RO2+M (R30)
Overall, this mechanism converts RO and SO2into RO2and SO3.
RO+SO2+O2→→RO2+SO3 (R31)
5
The rate laws for each of these mechanisms is similar, if we assume that the reaction of the sulfur-containing peroxy radical with NO is not rate limiting. In that case, the production rate of SO3is given by the following.
d[SO
3]
d t
a
=ka[O2][SO2][RO2] (5)
Similar equations apply to mechanisms (b) and (c). Equations for the production of 10
HO2from Reactions (R1–R7), and mechanisms (a–c) were derived and used to predict the yield of H2SO4 from RO2 relative to HO2 for each of the isomers produced in the reactions of OH with the various precursors studied. The rate coefficients,ka,kb, and
kcwere used as fit parameters. In addition, the rate coefficients for RO+NO reactions
for alkanes larger than C3 and the other species were allowed to vary within a range
15
(5×10⁻¹² to 4×10⁻¹¹cm3molecule−1s−1) as part of the fitting procedure. The rate coefficients for RO+O2 were set to their recommended values (1×10⁻¹⁴ for primary RO and 8×10⁻¹⁵ for secondary RO), and to zero for tertiary RO. In a few cases, no satisfactory fit could be found varying the four rate coefficients, and in those cases the rate coefficients for RO+O2 were also fit. RO2+NO rate coefficients were set to 20
ACPD
10, 22219–22277, 2010CIMS Measurements of HO2 and RO2
R. S. Hornbrook et al.
Title Page
Abstract Introduction
Conclusions References
Tables Figures
◭ ◮
◭ ◮
Back Close
Full Screen / Esc
Printer-friendly Version
Interactive Discussion
Discussion
P
a
per
|
Dis
cussion
P
a
per
|
Discussion
P
a
per
|
Discussio
n
P
a
per
|
The rate coefficients yielding the best fits for the RO+NO reactions were in the 3−4×10⁻¹¹ range for C6 and smaller alkanes. The C7 alkane was 1×10
−11 , while for the alkenes the best fit was 5×10⁻¹². For the aromatics, the values needed to be set at the kinetic limit of about 4×10⁻¹⁰. The rate coefficient for mechanism (a) averaged approximately 1×10⁻³¹cm6molecule−2s−1, resulting in a value of ka[O2]
5
at low [NO]/[O2] ratios of about 3×10 −13
cm3molecule−1s−1, and about 5×10⁻¹⁴ at high [NO]/[O2] ratios. These values are larger than the value recommended by Kan et al. (1981) of 1.4×10⁻¹⁴cm3molecule−1s−1. There is variability in the best values forka. For example, it is about 1×10−36cm6molecule−2s−1 fortert-butoxy radicals.
Values are also similar for 2- and 3-heptylperoxy radicals. Some best fit values are zero 10
(e.g. for 2- and 3-hexylperoxy, and many of the tertiary peroxy radicals) while the value for 1-hexylperoxy is unrealistically large (2×10⁻²⁶cm6molecule−2s−1). This is likely an artifact of the fitting procedure. Rate coefficients for mechanism (b) range from 10−31 to 10−27 with the straight-chained peroxy radicals tending to have the higher values. Tertiary peroxy radicals often have zero values. The radicals derived from 15
alkenes are generally at the low end, mostly between 2×10⁻³¹ and 10−29. Finally, the rate coefficients for mechanism (c) range from 10−32 to 10−29. Values are zero for isoprene and the aromatics, and mid-10−32 for the other alkenes. Overall, for most peroxy radicals, mechanism (a) accounts for most of the effect of increasing the yield of H2SO4 from RO2 in our inlet. Mechanism (b) seems to more important for alkenes 20
(along with (a)), and (c) only has an impact for a few specific isomers (e.g. 2- and 3-hexylperoxy and 4-heptylperoxy). The revised inlet chemistry for RO2 and HO2 in the PeRCIMS inlet based on this fit is shown in Schemes 1 and 2. We clearly need more kinetic data to constrain these mechanisms, but it appears that the reactions between RO2 and RO with SO2 in the presence of O2 and NO are operative in our inlet and
25