www.atmos-meas-tech.net/3/301/2010/
© Author(s) 2010. This work is distributed under the Creative Commons Attribution 3.0 License.
Measurement
Techniques
Elemental analysis of aerosol organic nitrates with electron
ionization high-resolution mass spectrometry
A. W. Rollins1, J. L. Fry2, J. F. Hunter1, J. H. Kroll3,*, D. R. Worsnop3, S. W. Singaram1, and R. C. Cohen1,4 1Department of Chemistry, University of California Berkeley, Berkeley, CA 94721, USA
2Chemistry Department, Reed College, Portland, OR 97202, USA
3Aerosol and Cloud Chemistry, Aerodyne Research Inc., Billerica, MA 01821, USA
4Department of Earth and Planetary Science, University of California Berkeley, Berkeley, CA 94721, USA *now at: Department of Civil and Environmental Engineering, Massachusetts Institute of Technology, Cambridge, MA 02139, USA
Received: 5 August 2009 – Published in Atmos. Meas. Tech. Discuss.: 30 October 2009 Revised: 17 February 2010 – Accepted: 18 February 2010 – Published: 26 February 2010
Abstract. Four hydroxynitrates (R(OH)R’ONO2) repre-sentative of atmospheric volatile organic compound (VOC) oxidation products were synthesized, nebulized and sam-pled into an Aerodyne High Resolution Time of Flight Aerosol Mass Spectrometer (HR-ToF-AMS). The resulting mass spectrum was used to evaluate calibration factors for elemental analysis of organic nitrates by AMS, and to deter-mine the distribution of nitrogen in the detected fragments in a search for an AMS signature of organic nitrates. We found that 30% of the detected nitrogen mass is in the NO+ and
NO+2 fragments, 12% at NH+x fragments, 5% at CxHyOzN+ fragments, and 53% at various CxHyN+fragments. Elemen-tal analysis indicated that nitrogen was detected with higher efficiency than carbon and hydrogen, but oxygen was de-tected with reduced efficiency compared to previously re-ported results for a suite of organics which did not include organic nitrates. The results are used to suggest the max-imum corrections to ambient O:C and N:C ratios based on AMS measurements.
1 Introduction
Aerosol mass spectrometry is a widely used method for mea-suring atmospheric aerosol composition. The most common implementation of this class of instruments is the Aerodyne Aerosol Mass Spectrometer (AMS) of which more than 80 instruments are currently in operation worldwide. Due to
Correspondence to:R. C. Cohen ([email protected])
its ubiquitous use in laboratory and field experiments, much of what is known about ambient atmospheric and laboratory aerosol composition relies on the accurate interpretation of AMS data. One of the main advantages of the AMS is it’s combination of flash volatilization with electron impact (EI) ionization which results in a relatively uniform sensitivity to all non-refractory (NR) components of aerosols, allowing for a measurement of total particle mass with high time resolu-tion and without requiring detailed prior knowledge of the aerosol chemical composition (Jimenez et al., 2003).
Organic nitrates (R-O-NO2) are ubiquitous in the atmo-sphere and are generated both from photochemical oxida-tion of VOC’s in the presence of NO, as well as through oxidation of alkenes by nitrate radicals (NO3). In partic-ular, hydroxy nitrates (β andδ isomers) are the dominant organic nitrate oxidation product of alkenes including iso-prene and monoterpenes (e.g. Nozi´ere et al., 1999, Paulot et al., 2009). The addition of nitrate and alcohol groups have similar effects on the vapor pressure, and hence condensi-bility of an organic compound (Pankow and Asher, 2008; Kroll and Seinfeld, 2008). As a result, oxidation of bio-genic VOC’s (BVOC) by NO3has been observed to produce aerosol with significant yields in chamber studies (e.g. Hoff-mann et al., 1997; Ng et al., 2008; Fry et al., 2009; Rollins et al., 2009). Organic nitrates might be expected to play an important role in production of Secondary Organic Aerosols (SOA) because of the correlation between NOxand anthro-pogenic VOC emissions, because NO3is an effective means for oxidizing BVOC, and because RONO2 are produced in high (≈25%) yield in the RO2+NO reaction for R>C8(Arey et al., 2001). However, identification of organic nitrates in ambient aerosol is difficult because it is expected to occur in coincidence with a large amount of inorganic nitrate. In AMS instruments the NO−3 results in a large background sig-nal at the main nitrate peaks (NO+and NO+2). Organic ni-trates could in principle be determined by subtraction of the inorganic contribution at these peaks which is calculated as-suming an ion balance between ammonium, sulfate and ni-trate, and other minor inorganic components if present in the aerosol. This is difficult and a direct organic signature would be desirable.
Recently, the high resolution version of the AMS (HR-ToF-MS) has been used to determine elemental composi-tion of organic aerosol (Aiken et al., 2007, 2008). While the AMS is to first order equally sensitive to all NR aerosol (Jimenez et al., 2003), it is known to detect oxygen and nitro-gen with somewhat reduced efficiency relative to carbon and hydrogen. Aiken et al. (2008) used a series of organic stan-dards to determine calibrations for the calculation of O/C, H/C and N/C ratios from AMS data. This is possible with the HR-ToF-AMS because of its ability to distinguish differ-ent fragmdiffer-ents with the same nominal mass, and compare the measured composition to the composition of the standards. These experiments did not include any organic nitrates be-cause semi-volatile organic nitrates were not commercially available. Other nitrogen containing organic compounds were tested including amine, amide nitro and pyradine com-pounds. In contrast to these species organic nitrates are rel-atively thermally unstable and are known to decompose at 300–400◦C in 10’s of ms the gas phase at atmospheric pres-sure (Day et al., 2002). Thus their detection could be more significantly affected by the combination of flash volatiliza-tion/EI than these other nitrogen containing organics.
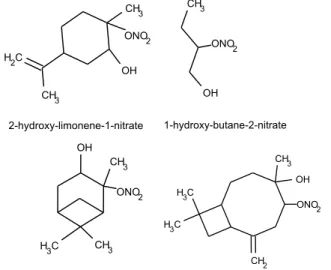
Fig. 1.One isomer of each each standard synthesized for this study.
We have synthesized 4 organic nitrates (C4–C15) and in-vestigated the response of the AMS to these compounds. The molecules used here were all hydroxynitrates and were cho-sen for their similarity to known oxidation products of at-mospheric VOC’s. Hydroxynitrates with e.g. isoprene and monoterpene carbon backbones have been observed in am-bient aerosols (Surratt et al., 2006; G´omez-Gonz´alez et al., 2008) making the molecules used in this study representative of organic nitrates believed to be in ambient aerosols. High resolution spectra were used to determine calibrations for el-emental analysis based on these compounds. The differences between elemental analysis calibrations for organic nitrates and for the suite of compounds and ambient sample investi-gated by Aiken et al. (2008) and differences between AMS spectra of inorganic and organic nitrates are discussed.
2 Experimental
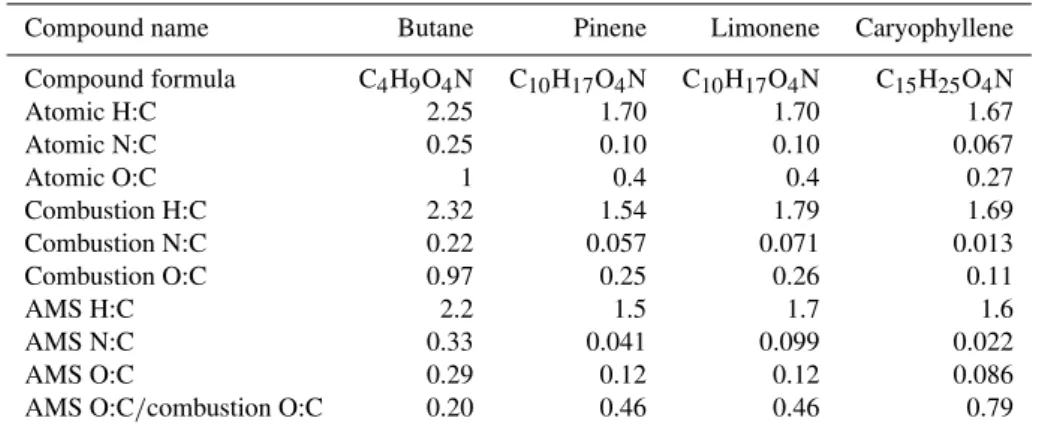
Table 1.H/C, N/C and O/C data from combustion elemental analysis and AMS elemental analysis.
Compound name Butane Pinene Limonene Caryophyllene
Compound formula C4H9O4N C10H17O4N C10H17O4N C15H25O4N Atomic H:C 2.25 1.70 1.70 1.67 Atomic N:C 0.25 0.10 0.10 0.067
Atomic O:C 1 0.4 0.4 0.27
Combustion H:C 2.32 1.54 1.79 1.69 Combustion N:C 0.22 0.057 0.071 0.013 Combustion O:C 0.97 0.25 0.26 0.11
AMS H:C 2.2 1.5 1.7 1.6
AMS N:C 0.33 0.041 0.099 0.022 AMS O:C 0.29 0.12 0.12 0.086 AMS O:C/combustion O:C 0.20 0.46 0.46 0.79
2.1 Synthesis
To a flame dried 25 mL round bottom flask equipped with a stir bar was added 6.52 mmols (1.07 mL) of limonene-1,2-oxide (mixture of cis and trans, 97%, sigma-aldrich) and dissolved in 8 mL of dry diethyl ether (starting materials for the other standards were α-Pinene oxide (97%), 1,2-Epoxybutane (99%) and Caryophyllene oxide (>95%) all of which were obtained from Sigma-Aldrich). To another flame dried 25 mL round bottom flask equipped with a stir bar was added 3 mL of dry diethyl ether and 7.39 mmols (0.3 mL) of fuming nitric acid. These flasks were placed, under nitrogen, in a dewar and cooled to−90◦C via a methanol/acetone bath in a CryoCool immersion cooler. After cannulating the acid into the epoxide, the solution was kept at−90◦C for an addi-tional hour. The reaction flask was then allowed to warm to room temperature over 12 h. The solution was washed sev-eral times with sodium bicarbonate to remove excess HNO3 and then dried over magnesium sulfate. The ether layer was removed with a rotatory evaporator. The product was purified on a silica gel column with a 60/40 mixture of hexanes/ethyl acetate. A diffusion pump was finally used to remove any moderately volatile products from the standards by applying vacuum to∼5 mTorr for one hour.
2.2 Characterization of standards
A 400 MHz NMR spectrometer was used to obtain1H NMR and13C NMR spectra. The observed chemical shifts for the limonene hydroxynitrate dissolved in CDCl3are as follows:
– 1HNMR: 1.45 (2, m); 1.6 (3, s); 1.7 (3, s); 1.80 (2, m); 2.18 (2, m); 2.35 (1, m); 4.09 (1, m); 4.73 (2, m), – 13CNMR: 20.78; 20.83; 26.05; 29.88; 33.80; 36.78;
69.1; 91.45; 109.35; 148.43.
Our NMR observations are in agreement with those of Spit-tler (2001).
Thermal dissociation-laser induced fluorescence (Day et al., 2002) measurements of the vapors in the headspace in each sample vial unambiguously identified the standards as being composed of alkyl nitrates. HNO3, NO2and RO2NO2 compounds were not detected in the vapors.
Samples were analyzed for elemental composition using a standard combustion method (Perkin Elmer 2400 Series II). With this method, carbon, hydrogen and nitrogen con-tent were measured on a mass basis with a stated accuracy of
±0.3%. Oxygen was assumed to be the remaining mass such that C+H+O+N=100%. Results of the combustion analysis are listed in Table 1.
2.3 HR-ToF-AMS analysis
The AMS has been extensively described in the literature (Canagartna et al., 2007; DeCarlo et al., 2006) and is only briefly described here. The AMS exists in three basic im-plementations. These instruments all sample gas and parti-cles through an aerodynamic inlet which reduces the sam-pled gas relative to the particles by a factor of≈107. The resulting focused beam of particles with aerodynamic diame-ters≈30–1000 nm is impacted on a heated surface (≈600◦C) where the non-refractory component of the aerosol is vapor-ized. The resulting vapors are ionized with 70 eV electron impact and measured with mass spectrometry. The three ver-sions of the AMS differ primarily in the mass spectrometer used, which has evolved from quadrupole (Q-AMS) to time of flight (ToF-AMS) to high resolution time of flight (HR-ToF-AMS). The ToF-AMS has much higher precision than the Q-AMS because it is not a scanning instrument and there-fore can in principle collect all of them/z fragments from a single particle. HR-ToF-AMS has improved mass resolu-tion, allowing for the distinction between different fragments with the same nominal mass (e.g. CH2O+vs. NO+).
(Wavemetrics, Lake Oswego, OR) which runs the standard HR-ToF-AMS software packages Squirrel 1.43 (ToF-AMS), Pika 1.03 (HR-ToF-AMS module) and Apes 1.00 (organic aerosol elemental analysis module).
Performing EA using the HR-ToF-AMS has been de-scribed in the literature (Aiken et al., 2007, 2008) and is briefly described in this paper. This analysis relies on the principle that a given magnitude of signal (Hz) at anym/z
corresponds roughly to the same original mass in the EI region of the instrument. For example, 1 µg/m3 He and 1 µg/m3Ar would produce approximately equal signal count rates atm/z=4 (He+) and 40 (Ar+), even though the num-ber of Ar atoms relative to He is 1/10. Furthermore, for molecules which fragment upon ionization, the size and iden-tity of the fragment which retains the charge and is detected has no bearing on the size of the signal. This is because the detection efficiency is proportional to the probability of a molecule becoming ionized, which is to first order linear in the number of electrons and therefore the mass of the molecule (Jimenez et al., 2003). Regardless of the size of the fragment that leaves as charged, the resulting signal from one ionizing event is 1 count (scaled by the detection effi-ciency of the instrument). Since the HR-ToF-AMS can de-termine the elemental composition of individual fragments by distinguishing between different fragments with the same nominal mass (DeCarlo et al., 2006), an average elemental composition and atomic ratios can be calculated for the entire HR-ToF-AMS spectrum. Calculating the average elemental composition of just the organic part of the aerosol requires determining which fragments and also how much of the to-tal signal at each fragment comes from the organic part of the aerosol. For ambient aerosol this can be difficult since inorganic aerosol and air may overlap at importantm/zfor particular types of compounds. As a pair of examples, H2O+ may come from both water vapor and the alcohol functional group, while NO+ may appear due to either ammonium ni-trate or organic nini-trate molecules.
As discussed by Aiken et al. (2007, 2008) the contribution to the organic spectrum from the CO+, O+, OH+and H2O+ fragments cannot typically be measured directly by the AMS when sampling particles in air due to inorganic gas phase and particle phase interferences. The signal from the gas phase interferences is measured by intermittently blocking the par-ticle beam, resulting in a gas only signal which is then sub-tracted from the gas+particle signal measured with the beam not blocked. The result will be precise however only if the gas is a small fraction of the total signal. CO2 is one gas for example for which this could be expected to be an issue. 380 ppm CO2at standard conditions is≈7×10⁵µg/m3. Ap-plying the nominal particle:gas enhancement factor of 107to this results in a signal of≈0.07 µg/m3from gas phase CO2 which is a background signal over which the particle signal must be measured. For ambient organic aerosols on the order of 10 µg/m3where the CO2is typically on the order of 10– 20% of the total organic aerosol signal (Zhang et al., 2005;
Aiken et al., 2008) gas phase CO2 is a minor interference. However, for less oxidized aerosols such as standards and chamber SOA, it can be significant because these aerosols produce very little CO+2 signal. We found for example with our pinene hydroxynitrate standard that with 150 µg/m3 or-ganic aerosol concentration, the gas and particle signals at CO+2 were≈4:5, particle:gas. However, the reduction in the precision of the CO+2 fragment measurement for less oxi-dized aerosols has a small impact on the precision of the cal-culated O/C because as the noise in the particle CO+2 signal increases, the fraction of total particle mass from this frag-ment decreases. A similar analysis on water vapor at 50% RH and standard conditions results in a gas phase signal of 1.2 µg/m3 H2O, which is always a significant interference, even if gas phase water is reduced with a diffusion dryer. In our measured spectra of the butane hydroxynitrate we found that the expected H2O+organic aerosol signal one calculates from the measured CO+2 and the fragmentation suggested by Aiken et al. (2008) is 0.04% of the total measured H2O+ signal, making a determination of HxO+fragments from dif-ference spectra impossible. The large N+2 peak from air in these experiments was typically≈100 times larger than the adjacent CO+fragment which itself is due both to gas phase
CO2as well as CO+ fragments from organic particles. For all of these reasons we observed that the precision in the mea-sured particle signals from CO+, O+, OH+and H2O+, were all much lower than precision in all other significant com-ponents of the spectra, including CO+2. For this reason we calculated the particle phase signals at these fragments based on the measured particle CO+2 fragment, and the fragmenta-tion table suggested by Aiken et al. (2008). Because of the relatively low signals at these fragments these choices had a minor effect on the calculated atomic ratios. For all of the standards except for the butane hydroxynitrate the O/C based on measured vs. calculated values of these fragments were within 5%. For the butane hydroxynitrate standard the difference was larger, but only because the total aerosol con-centration was much lower, and gas phase water therefore introduced much more noise into the measurement of HxO+ fragments. Using the calculated fragments resulted in O/C from the three measured spectra of this standard with preci-sion±3%. The AMS elemental ratios we report are those calculated before applying any corrections for reduced de-tection efficiency of H, N, or O relative to C.
2.4 Organic nitrate standards
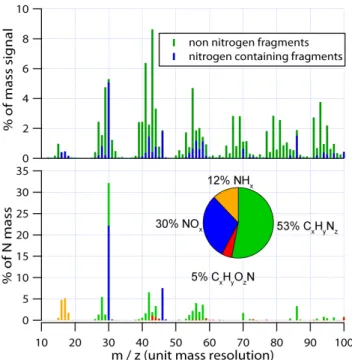
Fig. 2. Top: the average of the AMS spectra of the four stan-dards, with nitrogen and non-nitrogen fragments identified. Num-bers identify them/zof some of the major peaks. Bottom: the av-erage for the standards of the nitrogen containing peaks, weighted by the fraction of each peak which is nitrogen by mass. Each peak containing one nitrogen atom is scaled bym/z14 .
zero signal. Zero air produced from a zero air generator was chosen as opposed to e.g. argon gas to give a realistic AMS signal with the same interferences encountered in field mea-surements. 3–5 replicate spectra were recorded for each of the standards. Each spectrum was collected from 1 min of data and particle loadings were from 83–340 µg m−3. The precision for individual standards was high, with the preci-sion of the resulting atomic ratios being±4%. We report the averages of the spectra and atomic ratios.
3 AMS organic nitrate spectrum
Figure 2 (top panel) shows the average of the AMS spec-tra from the four standards. HR analysis was used to identify the peaks containing nitrogen (blue), and then the spectrum was summed to unit mass resolution. To focus on the organic nitrate functionality and compare the four compounds which had quite different carbon backbones, a subset of the spectrum of each standard was used where only the HR peaks containing nitrogen were identified and then scaled by the nitrogen content of each fragment (i.e. each fragment with one N atom was multiplied by m/z14 ), and then the spectra were summed to unit mass resolu-tion. Figure 2 (bottom) shows the average nitrogen specta of the four standards obtained this way. The spectra of
Table 2. Contributions (%) to the HR-AMS mass spectra of each of the standards (columns 1–4), and ratios of these peak heights (columns 5, 6). 30 and 46 are all of the signal at these UMR peaks. NO+ and NO+2 are determined in the HR analysis. Stated AMS atomic ratios are without using correction factors for non-uniform detection of C, H, N, and O.
Compound 30 46 NO+ NO+2 30:46 NO+:NO+2
Butane 14.35 4.47 7.64 4.18 3.21 1.83
Limonene 3.37 2.23 2.07 2.09 1.51 0.99 α-Pinene 2.96 0.58 2.65 0.50 5.10 5.30 Caryophyllene 2.01 0.45 1.79 0.40 4.47 4.48
the individual compounds as well as many of the individ-ual peak fits are contained in the supplementary material for this paper (see http://www.atmos-meas-tech.net/3/301/2010/ amt-3-301-2010-supplement.pdf). In comparison to ammo-nium nitrate where typically>98% of the nitrate signal ap-pears at the NO+and NO+
2 peaks, we observed only 30% of the nitrogen at the sum of these two peaks. We observed 5% at various CxHyOzN+fragments, 12% in the NH+x fragments (mainly the butane standard) and 53% at various CxHyN+ fragments. The NH+x fragments were almost exclusively ob-served in the butane hydroxynitrate standard. We have no evidence that this is not unusual ion chemistry but acknowl-edge that these peaks may indicate an undetected impurity in the sample. The ubiquity of the CHN+fragments across the 4 standards was surprising and suggests a high degree of molecular rearrangement, not simple fragmentation, occurs prior to detection.
An attempt was made to identify a unique and consistent feature of the spectra which could be used to quantify the organic nitrate content of ambient OA using either a Unit Mass Resolution (UMR) – or High Resolution (HR) – AMS. Although qualitative similarities between the spectra of the four standards are obvious, no single peak was an unam-biguous marker that could be used to quantify organic ni-trates. Table 2 shows the observed NO+:NO+2 ratios ob-served for the four compounds. This ratio has been shown previously (Alfarra et al., 2006; Cottrell et al., 2008; Fry et al., 2009) to differ significantly between inorganic and or-ganic nitrates. The NO+:NO+2 ratio has been shown to also vary between different instruments, and to change between tunings of a single instrument. Reported ranges for ammo-nium nitrate are typically 1.5–2.5 NO+:NO+
2, with larger ra-tios observed for other compounds, ranging as high as 29 NO+:NO+2 for sodium nitrate. We observed ratios ranging from 0.99 to 5.30 for the organic nitrate standards. The average spectrum shown in Fig. 2 (bottom panel) has an
RO+NO2on the AMS filament, yielding essentially a mass spectrum of NO2. For example, at 600◦C and 1 atm the life-time of n-propyl nitrate in the gas phase to this thermal de-composition channel is 300 ns.
None of the other major peaks were observed to bear a consistent relationship to the total N mass, or to either of the peaks atm/z30 or 46. One obvious feature in the spec-trum is the clusters of mass around the groups CxHyN+, with the highest peak in each group occurring aty=2x(28, 42, 56, 70). While this may be a unique signature of organic nitrates, the individual peaks are all small compared to the typical size of peaks at the same UMRm/zin an ambient spectrum.
Assuming that the average of the four standards is rep-resentative of how particulate organic nitrates would appear in an AMS spectrum, we calculate that 58% of the nitrogen is measured at peaks other than the NO+x and NH+x. Using a HR-AMS to identify nitrogen containing fragments, ifM is the total amount of organic nitrogen measured at these non NO+x and NH+x peaks, then the total amount of organic ni-trogen in all fragments would beM/0.58=1.7×M, and the amount of organic nitrogen detected at the NO+x peaks would be 1.7×0.30×M=0.51×M.
4 AMS/combustion comparison
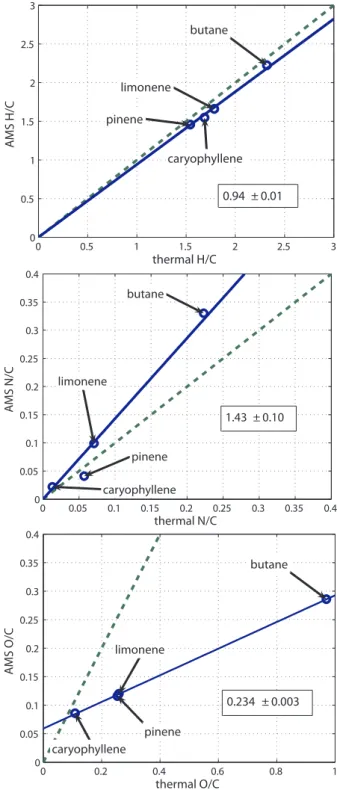
To evaluate the AMS’s relative detection efficiency of C, H, N, and O we compare the elemental ratios of the standards determined with the AMS to those measured with combus-tion analysis. The data are listed in Table 1 and plotted in Fig. 3. In Table 1 we also list the atomic ratios expected for pure samples of the standards. Assuming that the combus-tion analysis is the best measure of the composicombus-tion of the compounds, this analysis indicates that the N/C and O/C of the synthetic standards are lower than expected. Though the standards were purified via flash chromatography, this sug-gests there was a carbon impurity in the standards, presum-ably from unreacted starting material or minor product(s) of the synthesis. The direct comparison of the two EA mea-surements may help to eliminate the need to assume a pure sample of the standard, though we expect that an impurity of lower vapor pressure than the standard would lead to more relative signal in the AMS than in the combustion method.
Correlation between AMS and thermal EA measurements is high for all three ratios (R2=0.988, 0.966, 1.000 for H/C, N/C, O/C). For H/C and N/C a negligible improvement in the linear regression was achieved by allowing the y-intercept to vary (R2=0.995 vs. 0.988 for H/C and 0.978 vs. 0.966 for N/C). However for the O/C a reasonably significant im-provement is observed (0.894 vs. 1.000) by allowing the y-intercept to be non-zero. The positivey-intercept might in-dicate a positive bias in the AMS measurement of oxygen, possibly from a constant in the gas phase background. This would presumably appear as a large fraction of the total mea-sured oxygen appearing at a nominally “air” m/z, such as
0 0.5 1 1.5 2 2.5 3
0 0.5 1 1.5 2 2.5 3
thermal H/C
A
MS H/C
butane
pinene limonene
caryophyllene
0.94 ± 0.01
0 0.05 0.1 0.15 0.2 0.25 0.3 0.35 0.4 0
0.05 0.1 0.15 0.2 0.25 0.3 0.35 0.4
thermal N/C
A
MS N/C
butane
pinene limonene
caryophyllene
1.43 ± 0.10
0 0.2 0.4 0.6 0.8 1
0 0.05 0.1 0.15 0.2 0.25 0.3 0.35 0.4
thermal O/C
A
MS O/C
butane
pinene limonene
caryophyllene
0.234 ± 0.003
O+, O+ 2, CO
+ or CO+
2. However, O +
2 is filtered out in the analysis, and O+and CO+are calculated from the observed
CO+2 signal which was overall a small fraction of the total measured oxygen. The deviation of the intercept from zero could also be explained by a negative bias in the detection of carbon. Because the AMS elemental analysis only con-siders fragments up tom/z=100, if a larger fraction of the total carbon relative to oxygen is contained in the excluded fragments greater than,m/z=100, then the AMS O/C would be systematically high. To consider the potential magnitude of this effect we calculated the mass weighted averagem/z
for the observed C, H, N, and O and results are listed in Table 3. Also listed in Table 3 is the fraction of total or-ganic mass (calculated with unit mass resolution) located at
m/z≤100. In general O and N are found at lowerm/zthan are C and H, and the fraction of total mass located atm/z>100 and therefore excluded from the elemental analysis increases monotonically with compound mass. These results suggest that in general if the majority of oxygen is always located atm/z≤100, larger compounds with more C excluded from the analysis will have an overestimated O/C which increases with the size of the compound. To test the effect that this could have on our results we re-fit the AMS/thermal O/C comparison, making the assumption that all oxygen is de-tected belowm/z100, and that the fraction of total carbon detected belowm/z100 is equal to the fraction of OM ob-served belowm/z100 in the UMR analysis. Doing so brings they-intercept of the O/C panel in Fig. 3 from 0.059 to 0.029, with the slope of the line only increasing slightly from 0.234 to 0.237. Adjusting the carbon in this way also reduces the difference between the quality of fit found from allowing the y-intercept to vary (R2=0.999) and with y-intercept fixed at zero (R2=0.962). A similar analysis was performed on the N/C because Table 3 shows that nitrogen is found on average at even lowerm/zthan is oxygen and yet no signifi-cant offset was found in the AMS/thermal N/C comparison. The correction due to excluded carbon above m/z100 has a much less notable impact on the N/C, with the difference between fitting they-intercept (R2=0.977) and fixing at zero (R2=0.946). This less significant effect is observed because the N/C for the largest compound is already very small, and shifting it slightly has a minor effect on the fit line.
H/C measured for hydroxynitrates (0.94±0.01) and by Aiken et al. (2008) for a range of other compounds (0.91±0.02) are equivalent within the combined uncertainty. N/C for hydroxynitrates was biased high (1.4±0.1) as com-pared to the small negative bias previously observed for nitrogen containing organics (0.96±0.05). Our observed O/C ratio (0.23±0.01) is significantly lower than that of Aiken et al. (2008) (0.75±0.05). This pair of findings would seem to be reasonable considering that the nitrogen in these molecules was bonded to oxygen. Because oxygen is strongly electronegative and upon EI leaves preferentially as a neutral, the nitrogen is forced to preferentially leave as an ion.
Table 3. Mass weighted average location of C, H, N, and O cal-culated by high resolution AMS analysis ofm/z≤100 (first four columns) and the percent of organic mass located≤m/z100 eval-uated by unit mass resolution up tom/z=500. Correction factors for non-uniform detection of C, H, N, and O have not been applied to the data.
Compound C H N O %
Butane 51.1 47.2 36.0 40.1 91 Pinene 62.3 59.4 40.1 49.0 74 Limonene 60.4 58.0 44.5 50.0 74 Caryophyllene 64.7 62.1 42.5 51.4 69
The origin of the nonzeroy-intercept in the comparison of AMS and combustion measurements of O/C is not entirely clear, and as discussed is likely related to the size of the car-bon backcar-bone of the parent molecule. Thus, to make an esti-mate of how the O/C of organic nitrates may appear for ambi-ent aerosol we take the average of the AMS O/C / combustion O/C for the four compounds. The average of this value for the four compounds (Table 1, bottom line) is 0.50, which is close to the individual values observed for the two monoter-pene derived compounds (0.46 and 0.46). The four com-pounds tested in this study were nominally composed of one alcohol group H) and one alkyl nitrate group (R-O-NO2) with a total of 4 oxygen atoms per molecule. We es-timate the reduced detection efficiency of oxygen in the or-ganic nitrate groups alone by assuming that the oxygen in the alcohol groups were detected with 75% efficiency (Aiken et al., 2008), and the reduced detection efficiency of O in ni-trates lead to the overall observed value of 0.50. Under these assumptions, the detection efficiency for oxygen in a nitrate group is 42%.
5 Impact on ambient OA observations
In this section we estimate how the reduced efficiency of oxy-gen detection in organic nitrates might affect observations of O/C using the HR-ToF-AMS EA technique in the extreme case that all detected nitrogen is from organic nitrates. Un-der this assumption, we use our results from Sects. 3 and 4 to calculate that the O/C and N/C ratios reported using standard assumptions about AMS spectra and the calibration factors determined in Aiken et al. (2008) is related to the true O/C ratio by:
O C
true =
O C
rep +1.5
N C
rep
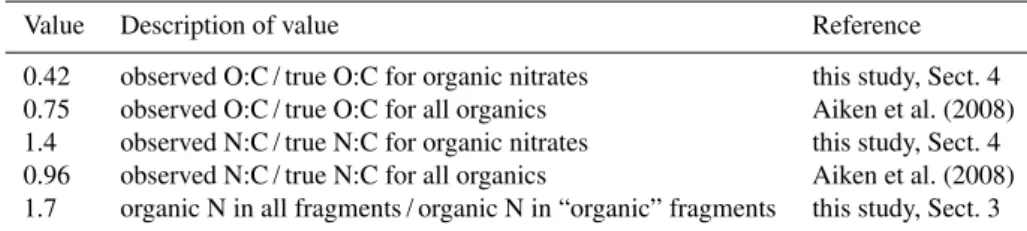
Table 4.A summary of the conversion factors used in deriving Eq. (1). .
Value Description of value Reference
0.42 observed O:C / true O:C for organic nitrates this study, Sect. 4 0.75 observed O:C / true O:C for all organics Aiken et al. (2008) 1.4 observed N:C / true N:C for organic nitrates this study, Sect. 4 0.96 observed N:C / true N:C for all organics Aiken et al. (2008) 1.7 organic N in all fragments / organic N in “organic” fragments this study, Sect. 3
(rep) ratios are those one finds in the literature (e.g. Aiken et al., 2008) using previously determined correction factors.
In the following we derive Eq. 1 using the various rela-tionships between measured and true O/C and N/C ratios re-ported in this study, and that of Aiken et al. (2008). These values are summarized in Table 4. First we consider the dif-ferences in O/C between the two studies. We assume that the oxygen in organic nitrate groups is detected with 42% efficiency, and all other organic oxygen at 75% efficiency. Since each nitrate group has 3 oxygen atoms, the contribu-tion to the observed O/C from nitrates is 0.42×3 NC
trueand the contribution from the other (non-nitrate) oxygen contain-ing organics is 0.75×hO
C
true
−3NC true
i
. Thus the true O/C is related to the observed O/C by the sum of the these two contributions, which can be rearranged to yield the fol-lowing expression:
O
C
true
=
O C
obs
+0.99
N C
true
0.75 =
O C
obs 0.75 +1.3
N
C
true (2) Since the factor 0.75 has been used in the literature to report O/C values, we have:
O C
reported =
O C
obs
0.75 (3)
We assume that the reported and observed N/C ratios are re-lated by NCrep×0.96= NC
obsand as we have seen, for or-ganic nitrates NC
true= N C
obs/1.4. Typically however, ele-mental analysis is applied to the “organic” part of the AMS spectrum which is determined as such through standard as-sumptions about the spectrum (Allan et al., 2004) followed by the application of a multivariate linear regression tech-nique such as positive matrix factorization which essentially removes all signal at the NO+x and NH+x peaks (Zhang et al., 2005; Lanz et al., 2007, 2008). To account for organic N in these peaks the reported N/C should be scaled up by a factor of 1.7 as discussed in Sect. 3, resulting in the relationship
N C
true =
N C
rep×0.96
1.4 ×1.7 (4)
Combining Eqs. (3) and (4) with Eq. (2) we arrive at Eq. (1).
Applying Eq. (1) to the diurnal average N/C and O/C ratios observed by Aiken et al. (2008) in Mexico City (MILAGRO campaign) we obtain an average increase in the O/C ratio of 8.6%. Ambient N/C and O/C ratios however are anticorre-lated. Thus, the while the O/C ratio observed by Aiken et al. (2008) ranges from 0.31–0.55, the N/C ratio ranges from 0.024–0.009 (approx, read from charts). This suggests that the organic nitrate correction to OA oxygen content for this study would vary from 2–12%, being the most important just before sunrise, and least important late in the day.
The results of the above analysis rely on the critical as-sumption that all observed N in the organic spectrum is from organic nitrates. This is however unlikely to be the case, meaning that the 2–12% correction we calculate to the O/C is an upper limit. For example, Moffet et al. (2008) report single particle mass spectrometric measurements during the Mexico City Metropolitan Area-2006 campaign (MCMA-2006) and find a significant class of nitrogen containing or-ganic particles which they hypothesize to be due to industrial emissions of amines. Aiken et al. (2009) report PMF analysis of HR-AMS data from this same campaign, and find a com-ponent high in organic nitrogen (called LOA in that study) which they suggest is likely of similar origin. It is worth not-ing though that in the study of Aiken et al. (2009) only 33% of the organic nitrogen was found in the LOA component, with the OOA, HOA and BBOA having 29%, 25% and 13% each, respectively. As well, one of the pieces of reasoning used to conclude that the nitrogen is from amines is that it is detected in CxHyN+fragments, such asm/z58 (Moffet et al., 2008) andm/z86 (Huffman et al., 2009) which are observed in mass spectroscopic studies of amines. Our observations of significant quantities of CxHyN+fragments from organic nitrates including in particularm/z58 and 86 suggests that these fragments may not be perfect tracers for amines. Fi-nally, we note that the range of possible corrections calcu-lated in this paper are well within the stated 31% accuracy (Aiken et al., 2008) of the AMS EA technique.
6 Conclusions
NO+
x and NH+x peaks, which are typically assumed to be in-organic nitrogen. We find that the oxygen in these molecules was detected with significantly reduced efficiency (50% on average) as compared to a previously reported series of or-ganics (75%). This could result in as much as an 12% in-crease in the O/C ratio previously reported for Mexico City where the observed N/C was high. Analysis of the mass spec-trum did not yield any patterns which could be used univer-sally to quantify the organic nitrate content of aerosol, but suggests that 58% of the N is detected at CHN+and CHNO+ fragments.
Acknowledgements. The Berkeley authors were supported by NSF ATM-0639847 and NSF ATM-0511829. The authors would like to thank M. Spittler for suggestions regarding the synthetic chemistry, and to M. Motamed and S. House in the research group of R. Sarpong for assistance and facilities for performing synthesis. K. Wilson and J. Smith are thanked as well for their assistance with the AMS experiments. Discussions with D. Farmer and J. Jimenez regarding the data analysis were also very appreciated.
Edited by: A. J. M. Piters
References
Aiken, A., DeCarlo, P., and Jimenez, J.: Elemental analysis of or-ganic species with electron ionization high-resolution mass spec-trometry, Anal. Chem., 79, 8350–8358, 2007.
Aiken, A. C., DeCarlo, P. F., Kroll, J. H., Worsnop, D. R., Huff-man, J. A., Docherty, K. S., Ulbrich, I. M., Mohr, C., Kim-mel, J. R., Sueper, D., Sun, Y., Zhang, Q., Trimborn, A., North-way, M., Ziemann, P. J., Canagaratna, M. R., Onasch, T. B., Al-farra, M. R., Prevot, A. S. H., Dommen, J., Duplissy, J., Met-zger, A., Baltensperger, U., and Jimenez, J. L.: O/C and OM/OC ratios of primary, secondary, and ambient organic aerosols with high-resolution time-of-flight aerosol mass spectrometry, Envi-ron. Sci. Technol., 42, 4478–4485, 2008.
Aiken, A. C., Salcedo, D., Cubison, M. J., Huffman, J. A., DeCarlo, P. F., Ulbrich, I. M., Docherty, K. S., Sueper, D., Kimmel, J. R., Worsnop, D. R., Trimborn, A., Northway, M., Stone, E. A., Schauer, J. J., Volkamer, R. M., Fortner, E., de Foy, B., Wang, J., Laskin, A., Shutthanandan, V., Zheng, J., Zhang, R., Gaffney, J., Marley, N. A., Paredes-Miranda, G., Arnott, W. P., Molina, L. T., Sosa, G., and Jimenez, J. L.: Mexico City aerosol analysis during MILAGRO using high resolution aerosol mass spectrometry at the urban supersite (T0) – Part 1: Fine particle composition and organic source apportionment, Atmos. Chem. Phys., 9, 6633– 6653, 2009,
http://www.atmos-chem-phys.net/9/6633/2009/.
Alfarra, M. R.: Insights Into Atmospheric Organic Aerosols Us-ing An Aerosol Mass Spectrometer, Ph.D. Thesis, University of Manchester, 2004.
Alfarra, M. R., Paulsen, D., Gysel, M., Garforth, A. A., Dom-men, J., Pr´evˆot, A. S. H., Worsnop, D. R., Baltensperger, U., and Coe, H.: A mass spectrometric study of secondary organic aerosols formed from the photooxidation of anthropogenic and biogenic precursors in a reaction chamber, Atmos. Chem. Phys.,
6, 5279–5293, 2006,
http://www.atmos-chem-phys.net/6/5279/2006/.
Allan, J., Delia, A., Coe, H., Bower, K., Alfarra, M., Jimenez, J., Middlebrook, A., Drewnick, F., Onasch, T., Canagaratna, M., Jayne, J., and Worsnop, D.: A Generalised method for the extrac-tion of chemically resolved mass spectra from aerodyne aerosol mass spectrometer data, J. Aerosol Sci., 35, 909–922, 2004. Arey, J., Aschermann, S. M., Kwok, E. S. C., and Atkinson, R.:
Alkyl Nitrate, Hydroxyalkyl Nitrate, and Hydroxycarbonyl For-mation from the NOx-Air Photooxidations of C5-C8n-Alkanes, J. Phys. Chem. A., 105, 1020–1027, 2001.
Canagartna, M., Jayne, J., Jimenez, J., Allan, J., Alfarra, M., Zhang, Q., Onaxch, T., Drewnick, F., Coe, H., Middlebrook, A., Delia, A., Williams, L., Trimborn, A., Northway, M., De-Carlo, P., Kolb, C., Davidovits, P., and Worsnop, D.: Chemical and microphysical characteriation of ambient aerosols with the aerodyne aerosol mass spectrometer, Mass Spectrom. Rev., 26, 185–222, 2007.
Cottrell, L. D., Griffin, R. J., Jimenez, J. L., Zhang, Q., Ulbrich, I., Ziemba, L. D., Beckman, P. J., Sive, C. B., and Talbot, R. W.: Submicron particles at Thompson Farm during ICARTT mea-sured using aerosol mass spectrometry, J. Geophys. Res., 113, D08212, doi:10.1029/2007JD009192, 2008.
Day, D. A., Wooldridge, P. J., Dillon, M., Thornton, J. A., and Cohen, R. C.: A thermal dissociation laser-induced fluores-cence instrument for in situ detection of NO2, peroxy nitrates, alkyl nitrates, and HNO3, J. Geophys. Res., 107(D6), 4046, doi:10.1029/2001JD000779, 2002.
DeCarlo, P. F., Kimmel, J. R., Trimborn, A., Northway, M. J., Jayne, J. T., Aiken, A. C., Gonin, M., Fuhrer, K., Horvath, T., Docherty, K. S., Worsnop, D. R., and Jimenez, J. L.: Field-deployable, high-resolution, time-of-flight aerosol mass spec-trometer, Anal. Chem., 78, 8281–8289, 2006.
Dzepina, K., Arey, J., Marr, L. C., Worsnop, D. R., Salcedo, D., Zhang, Q., Onasch, T. B., Molina, L. T., Molina, M. J., and Jimenez, J. L.: Detection of particle-phase polycyclic aeromatic hydrocarbons in Mexico City using and aerosol mass spectrom-eter, Int. J. Mass. Spectrom., 263, 152–170, 2007.
Fry, J. L., Kiendler-Scharr, A., Rollins, A. W., Wooldridge, P. J., Brown, S. S., Fuchs, H., Dub´e, W., Mensah, A., dal Maso, M., Tillmann, R., Dorn, H.-P., Brauers, T., and Cohen, R. C.: Organic nitrate and secondary organic aerosol yield from NO3oxidation ofβ-pinene evaluated using a gas-phase kinetics/aerosol parti-tioning model, Atmos. Chem. Phys., 9, 1431–1449, 2009, http://www.atmos-chem-phys.net/9/1431/2009/.
G´omez-Gonza´alez, Y., Surratt, J. D., Ceyckens, F., Szmigiel-ski, R., Vermeylen, R., Jaoui, M., LewandowSzmigiel-ski, M., Offen-berg, J. H., Kleindienst, T. E., Edney, E. O., Blockhuys, F., Alsenoy, C. V., Maenhaut, W., and Claeys, M.: Characteri-zation of organosulfates from the photooxidation of isoprene and unsaturated fatty acids in ambient aerosol using liquid chromatography/(-)electrospray ionization mass spectrometry, J. Mass. Spec., 43, 371–382, 2008.
Huffman, J. A., Docherty, K. S., Aiken, A. C., Cubison, M. J., Ul-brich, I. M., DeCarlo, P. F., Sueper, D., Jayne, J. T., Worsnop, D. R., Ziemann, P. J., and Jimenez, J. L.: Chemically-resolved aerosol volatility measurements from two megacity field studies, Atmos. Chem. Phys., 9, 7161–7182, 2009,
http://www.atmos-chem-phys.net/9/7161/2009/.
Jimenez, J. L., Jayne, J. T., Shi, Q., Kolb, C. E., Worsnop, D. R., Yourshaw, I., Seinfeld, J. H., Flagan, R. C., Zhang, X., Smith, K. A., Morris, J. W., and Davidovits, P.: Ambient aerosol sampling using the Aerodyne Aerosol Mass Spectrometer, J. Geophys. Res., 108(D7), 8425, doi:10.1029/2001JD001213, 2003.
Kroll, J. H. and Seinfeld, J. H.: Chemistry of secondary organic aerosol: Formation and evolution of low-volatility organics in the atmosphere, Atmos. Environ., 42, 3593–3624, 2008. Lanz, V. A., Alfarra, M. R., Baltensperger, U., Buchmann, B.,
Hueglin, C., and Pr´evˆot, A. S. H.: Source apportionment of sub-micron organic aerosols at an urban site by factor analytical mod-elling of aerosol mass spectra, Atmos. Chem. Phys., 7, 1503– 1522, 2007,
http://www.atmos-chem-phys.net/7/1503/2007/.
Lanz, V. A., Alfarra, M. R., Baltensperger, U., Buchmann, B., Hueglin, C., Szidat, S., Wehreli, M. N., Wacker, L., Weimer, S., Caseiro, A., Puxbaum, H., and Pr´evˆot, A. S. H.: Source attribu-tion of submicron organic aerosols during wintertime inversions by advanced factor analysis of aerosol mass spectra, Environ. Sci. Technol., 42, 214–220, 2008.
Moffet, R. C., de Foy, B., Molina, L. T., Molina, M. J., and Prather, K. A.: Measurement of ambient aerosols in northern Mexico City by single particle mass spectrometry, Atmos. Chem. Phys., 8, 4499–4516, 2008,
http://www.atmos-chem-phys.net/8/4499/2008/.
Muthuramu, K., Shepson, P. B., and O’Brien, J. M.: Prepara-tion, analysis, and atmospheric production of multifunctional organic nitrates, Environ. Sci. Technol., 27, 1117–1124, doi: 10.1021/es00043a010, 1993.
Ng, N. L., Kwan, A. J., Surratt, J. D., Chan, A. W. H., Chhabra, P. S., Sorooshian, A., Pye, H. O. T., Crounse, J. D., Wennberg, P. O., Flagan, R. C., and Seinfeld, J. H.: Secondary organic aerosol (SOA) formation from reaction of isoprene with nitrate radicals (NO3), Atmos. Chem. Phys., 8, 4117–4140, 2008,
http://www.atmos-chem-phys.net/8/4117/2008/.
Nichols, P. L. J., Magnusson, A. B., and Ingham, J. D.: Synthesis of nitric esters by the addition of nitric acid to the ethylene oxide ring, J. Am. Chem. Soc., 75, 4255–4258, 1953.
Nozi´ere, B., Barnes, I., and Becker, K.-H.: Product study and mech-anisms of the reactions ofα-pinene and of pinonaldehyde with OH radicals, J. Geophys. Res., 104, 23645–23656, 1999. Pankow, J. F. and Asher, W. E.: SIMPOL.1: a simple group
con-tribution method for predicting vapor pressures and enthalpies of vaporization of multifunctional organic compounds, Atmos. Chem. Phys., 8, 2773–2796, 2008,
http://www.atmos-chem-phys.net/8/2773/2008/.
Paulot, F., Crounse, J. D., Kjaergaard, H. G., Kroll, J. H., Seinfeld, J. H., and Wennberg, P. O.: Isoprene photooxidation: new in-sights into the production of acids and organic nitrates, Atmos. Chem. Phys., 9, 1479–1501, 2009,
http://www.atmos-chem-phys.net/9/1479/2009/.
Rollins, A. W., Kiendler-Scharr, A., Fry, J. L., Brauers, T., Brown, S. S., Dorn, H.-P., Dub´e, W. P., Fuchs, H., Mensah, A., Mentel, T. F., Rohrer, F., Tillmann, R., Wegener, R., Wooldridge, P. J., and Cohen, R. C.: Isoprene oxidation by nitrate radical: alkyl nitrate and secondary organic aerosol yields, Atmos. Chem. Phys., 9, 6685–6703, 2009,
http://www.atmos-chem-phys.net/9/6685/2009/.
Spittler, M.: Untersuchungen zur troposph¨arischen Oxidation von Limonen: Produktanalysen, Aerosolbildung und Photolyse von Produkten, Ph.D. Thesis, Department of Physical Chemistry, University of Wuppertal, 2001.
Surratt, J. D., Murphy, S. M., Kroll, J. H., Ng, N. L., Hildebrandt, L., Sorooshian, A., Szmigielski, R., Vermeylen, R., Maenhaut, W., Clayes, M., Flagan, R. C., and Seinfeld, J. H.: Chemical Composition of Secondary Organic Aerosol Formed from the Photooxidation of Isoprene, J. Phys. Chem. A, 110, 9665–9690, 2006.
Treves, K. and Rudich, Y.: The atmospheric fate of C3–C6 hydrox-yalkyl nitrates, J. Phys. Chem. A, 107, 7809–7817, 2003. Treves, K., Shragina, L., and Rudich, Y.: Henry’s law constants of
someβ-,γ-, andδ-hydroxy alkyl nitrates of atmospheric interest, Environ. Sci. Technol., 34, 1197–1203, 2000.