www.atmos-chem-phys.net/12/1649/2012/ doi:10.5194/acp-12-1649-2012
© Author(s) 2012. CC Attribution 3.0 License.
Chemistry
and Physics
Identification and quantification of organic aerosol from
cooking and other sources in Barcelona using aerosol mass
spectrometer data
C. Mohr1,*, P. F. DeCarlo1,**, M. F. Heringa1, R. Chirico1,***, J. G. Slowik1, R. Richter1, C. Reche2, A. Alastuey2, X. Querol2, R. Seco3,****, J. Pe ˜nuelas3, J. L. Jim´enez4,5, M. Crippa1, R. Zimmermann6,7, U. Baltensperger1, and A. S. H. Pr´evˆot1
1Laboratory of Atmospheric Chemistry, Paul Scherrer Institut (PSI), Villigen, Switzerland 2Institute for Environmental Assessment and Water Research (IDAEA-CSIC), Barcelona, Spain
3Unitat d’Ecologia Global CREAF-CEAB-CSIC, Centre de Recerca Ecol`ogica i Aplicacions Forestals, Universitat Aut`onoma de Barcelona, Barcelona, Spain
4Department of Chemistry and Biochemistry, University of Colorado, Boulder, USA
5Cooperative Institute for Research in the Environmental Sciences (CIRES), University of Colorado, Boulder, USA 6Helmholtz Zentrum Munchen, Joint Mass Spectrometry Center, Institute of Ecological Chemistry, Neuherberg, Germany 7Analytical Chemistry, Institute of Chemistry, University of Rostock, Rostock, Germany
*now at: Department of Atmospheric Sciences, University of Washington, Seattle, USA
**now at: Department of Civil, Architectural, and Environmental Engineering, Drexel University, Philadelphia, USA ***now at: Italian National Agency for New Technologies, Energy and Sustainable Economic Development (ENEA), UTAPRAD-DIM, Frascati, Italy
****now at: Atmospheric Chemistry Division, National Center for Atmospheric Research, Boulder, USA Correspondence to:A. S. H. Pr´evˆot ([email protected])
Received: 18 September 2011 – Published in Atmos. Chem. Phys. Discuss.: 6 October 2011 Revised: 18 January 2012 – Accepted: 1 February 2012 – Published: 15 February 2012
Abstract. PM1(particulate matter with an aerodynamic di-ameter <1 µm) non-refractory components and black car-bon were measured continuously together with additional air quality and atmospheric parameters at an urban back-ground site in Barcelona, Spain, during March 2009 (cam-paign DAURE, Determination of the sources of atmospheric Aerosols in Urban and Rural Environments in the western Mediterranean). Positive matrix factorization (PMF) was conducted on the organic aerosol (OA) data matrix mea-sured by an aerosol mass spectrometer, on both unit mass (UMR) and high resolution (HR) data. Five factors or sources could be identified: LV-OOA (low-volatility oxy-genated OA), related to regional, aged secondary OA; SV-OOA (semi-volatile oxygenated OA), a fresher oxygenated OA; HOA (hydrocarbon-like OA, related to traffic emis-sions); BBOA (biomass burning OA) from domestic heating or agricultural biomass burning activities; and COA (cook-ing OA). LV-OOA contributed 28 % to OA, SV-OOA 27 %, COA 17 %, HOA 16 %, and BBOA 11 %. The COA HR spectrum contained substantial signal from oxygenated ions (O:C: 0.21) whereas the HR HOA spectrum had almost
ex-clusively contributions from chemically reduced ions (O:C: 0.03). If we assume that the carbon in HOA is fossil while that in COA and BBOA is modern, primary OA in Barcelona contains a surprisingly high fraction (59 %) of non-fossil car-bon.
1 Introduction
Atmospheric aerosols, liquid or solid particles suspended in air, are of interest due to their impact on climate (IPCC, 2007), visibility (Watson, 2002), ecosystems (Grantz et al., 2003), and human health (Nel, 2005). Numerous natural and anthropogenic sources directly emit particles into the air, or release gas-phase precursors whose oxidation products parti-tion into the particle phase. Consequently, the chemical com-position of ambient particulate matter (PM) varies consider-ably and consists of many different compounds (Tsigaridis et al., 2006). A major aerosol constituent is organic mate-rial (Murphy et al., 2006; Jimenez et al., 2009). However, knowledge about sources, fate and mutual interaction of gas-phase and aerosol organics, of which it is estimated that there are between 10 000 and 100 000 different compounds, is still limited (Goldstein and Galbally, 2007). Therefore, the at-mospheric evolution of organic aerosol (OA) is the focus of intense research activities (Jimenez et al., 2009).
The complexity of the atmospheric (organic) aerosol sys-tem places great demands on measurement techniques and instrumentation (Hallquist et al., 2009). Aerosol mass spec-trometers (AMS) have become a widely applied tool (Bal-tensperger et al., 2010), because they allow chemical specia-tion, sizing and mass detection of submicron non-refractory PM at high time resolution (Canagaratna et al., 2007). Zhang et al. (2005a) deconvolved and quantified the mass concen-trations of hydrocarbon-like OA (HOA, a surrogate for pri-mary OA, POA) and oxygenated OA (OOA, a surrogate for secondary OA, SOA) using organic mass spectra obtained with an AMS. Recently, AMS data have been combined with positive matrix factorization (PMF, Paatero and Tapper, 1994; Lanz et al., 2007; Ulbrich et al., 2009), a factor analyti-cal model which outputs a number of constant source profiles (factors) and their varying contributions over time. This has led to new insights into sources contributing to OA and made the quantification of OA subtypes such as low-volatility and semi-volatile OOA (LV- and SV-OOA), HOA, and biomass burning OA (BBOA) possible (Lanz et al., 2007; Jimenez et al., 2009). A growing number of measurements in very diverse environments (e.g. Aiken et al., 2009; Huang et al., 2010) and increasing resolution of the AMS (DeCarlo et al., 2006) continuously enhance our knowledge of OA factors.
An OA factor recently reported in ambient air in several AMS studies is cooking organic aerosol (COA, Allan et al., 2010; Huang et al., 2010; Sun et al., 2011). Emissions from cooking activities had been identified as a potentially important source of PM much earlier (Gray, 1986). To a great extent an indoor air pollution problem (Fortmann et al., 2001), cooking aerosol can also contribute substantially to ambient PM concentrations: e.g. meat charbroiling and fry-ing were estimated to account for about 16 % of fine organic carbon emissions or 6 % of total fine PM concentration in the Los Angeles area (Hildemann et al., 1991a; Schauer et al., 1996). Most studies focused on meat cooking emissions
when investigating cooking aerosol; numerous compounds were identified in meat cooking OA, among which palmitic acids, stearic acid, oleic acid, and cholesterol are the most prominent (Cass, 1998; Schauer et al., 1999). Charbroiling OA was also identified in ambient air by AMS-PMF anal-yses (Lanz et al., 2007; Slowik et al., 2010). Schauer et al. (2001) extended the research on cooking PM to emissions from cooking vegetables with seed oils; studies on Chinese food cooking emissions further broadened the range of emis-sions investigated (He et al., 2004, 2010; Zhao et al., 2006). Fatty acids are the dominant group of compounds emitted by all cooking types; they differ in fractions of saturated, unsat-urated, and polyunsaturated fats depending on the type of oil or meat fat (Zhao et al., 2006). Mohr et al. (2009) character-ized primary OA from cooking various types of meat with an AMS and found that the unit mass resolution (UMR) spectral signature is very similar to HOA. The differences in the high resolution (HR) spectra are larger due to the oxygen present in the fatty acids; however, the similarity of UMR spectra from HOA and COA might be one of the reasons for the rel-atively small number of locations where COA was detected with an AMS, despite its potential importance as a contribu-tor to urban aerosol concentrations.
This paper provides a characterization of the chemi-cal composition and organic aerosol sources of PM1 in Barcelona during winter. In addition, a new method for iden-tifying COA in ambient air and estimating cooking contribu-tions to organic aerosol is presented. These techniques are demonstrated within the framework of the DAURE (Deter-mination of the sources of atmospheric Aerosols in Urban and Rural Environments in the western Mediterranean) cam-paign in Barcelona, Spain. The intense and varied sources of primary emissions in this region provide an ideal test case for the feasibility of identifying cooking emissions and de-termining their importance relative to other OA sources.
2 Method
2.1 DAURE Campaign, Barcelona (Spain)
The city of Barcelona is situated on the shore of the west-ern Mediterranean basin, wedged in between the sea and the Catalan coastal ranges running parallel to the coastline NE-SW. The Besos and the Llobregat river valleys perpendicu-lar to the coast limit the city area to the NE and SW. The warm and dry Mediterranean climate, intense solar radia-tion and low dispersive condiradia-tions favor high levels of re-gional aerosol (P´erez et al., 2008a); additionally, high an-thropogenic emissions lead to intense pollution episodes. Barcelona is one of the cities in Europe with the highest num-ber of cars per km2(Ajuntament de Barcelona, 2007). Emis-sions from the Barcelona harbor, an expanded industrial zone in the river valley and the densely populated pre-coastal de-pression behind the coastal range all add additional PM to the Barcelona area aerosol concentrations (Querol et al., 2001). Outbreaks of Saharan dust events can affect the Barcelona air quality (P´erez et al., 2006). The daily cycle of nocturnal off-shore flows and diurnal sea breeze (Jorba et al., 2011) plays an important role for the pollution dispersion in Barcelona. The sea breeze advects (polluted) coastal air masses inland, while nocturnal land breeze and mountain down slope flows transport air masses from the surrounding valleys to the city of Barcelona.
The measurement site was situated at the northwestern corner of the city centre in a small park (elevation 80 m a.s.l.) surrounded by residential areas. At a distance of ∼300 m is Diagonal Avenue, one of the main traffic arteries cross-ing Barcelona with 100 000 vehicles per day (Ajuntament de Barcelona, 2007), while the Mediterranean sea is∼6 km away.
2.2 Instrumentation and sampling
A complete list of instruments deployed during DAURE is given in Pandolfi et al. (2012). A brief discussion of the in-struments used for the present analysis is included here. Non-refractory PM1chemical composition was measured with an Aerodyne high-resolution time-of-flight aerosol mass spec-trometer (HR-ToF-AMS). This version of the AMS allows the distinction of different ions at the same nominal mass-to-charge ratio (m/z). It can be run in two ion optical modes, a single reflection mode with higher sensitivity and lower resolving power referred to as V-mode, and a so-called W mode with a two-reflectron configuration that yields higher resolving power but lower sensitivity. A detailed description of the instrument can be found in DeCarlo et al. (2006). Dur-ing DAURE the HR-ToF-AMS (abbreviated as AMS here-after) was operated alternately in V and W mode (150 s each). In W mode, 15 cycles of 5 s open and 5 s closed data in the mass spectrum (MS) mode were acquired before sav-ing. In V mode, 5 cycles of 15 s in MS mode (50 % open) plus 30 s in particle time-of-flight (PToF) mode yielded the size distribution of PM1components.
A scanning mobility particle sizer (SMPS, homebuilt by PSI, consisting of a neutralizer with a85Kr source, a
differ-ential mobility analyzer DMA, and a condensation particle counter CPC 3022A, TSI) was operated in parallel to the AMS. It measured submicron particle number size distribu-tions between 13 and 638 nm mobility diameter with a time resolution of 5 min.
Aerosol black carbon (BC) mass concentrations were de-rived from particle light attenuation (bATN) measurements (time resolution 5 min) at a wavelength of 880 nm by an aethalometer, Model AE31 (Magee Scientific).
An optical counter (Grimm Labortechnik GmbH & Co. KG; model 1.107) provided continuous measurements of PM1 (and PM2.5 and PM10, not shown) with a time res-olution of 1 h. The Grimm mass loadings were corrected using PM1 samples collected on filters as discussed by Reche et al. (2011), using the following parameters: Grimm PM1= (PM1[uncorrected]-(−0.0024))/0.8236.
The above instruments were deployed on a common sam-ple inlet with a PM2.5 cyclone (SCC 1.829, BGI Incorpo-rated), requiring a flow rate of 5 l min−1. The inlet was situ-ated on the roof of the trailer containing the instruments, at a height of∼4 m above ground. A1/2inch outer diameter (o.d.) stainless steel tube led inside the trailer (length 2.3 m) to a manifold. From there the sample air flowed (flow rate 0.4 l min−1)through a Nafion dryer (Perma-Pure, length 100 cm) and 40 cm of1/4inch o.d. stainless steel tube to the inlet of the AMS. The SMPS inlet was connected to the Nafion dryer with a 120 cm long copper tube, 6 mm o.d. Copper tubing with 105 cm of 6 mm o.d. and 10 cm of 10 mm o.d. led to the aethalometer. The total inlet residence time was 14 s for the AMS and 10 s for the SMPS under laminar flow, and 3.5 s for the aethalometer, whose last part of the inlet flow was slightly turbulent (Reynolds NumberRe= 2160).
2.3 Data analysis
AMS data were analyzed using the standard AMS data analy-sis software SQUIRREL v1.51B and PIKA v1.10B (Sueper, 2008) within Igor Pro 6.22A (Wavemetrics). A collection efficiency (CE) dependent on the nitrate fractionfNO3 was applied to the entire dataset, with CE = 0.5 forfN O3≤0.25, CE = 1 forfNO3≥0.78 and a linear increase of CE between
these values for 0.25≤fNO3≤0.78. This relationship was
empirically determined by comparisons of AMS and ancil-lary data from various field campaigns conducted within the European integrated project on aerosol cloud climate air quality interactions(EUCAARI) and theEuropean monitor-ing and evaluation programme(EMEP) all over Europe (Ne-mitz et al., 2011). DAURE data were included in that collec-tion of data sets. A very similar dependence of CE onfNO3
was recently reported by Middlebrook et al. (2012) for stud-ies in the US. The time serstud-ies of the estimated CE can be found in Fig. S1.
Fig. 1. Stacked time series of AMS species (Org, NO3, NH4, SO4, and Chl), BC measured by the aethalometer. PM1data from the Grimm laser-spectrometer (corrected using PM1samples collected on filters) are plotted on the right axis. The pie chart shows the campaign averagerelative contributions of AMS species and BC to PM1 (campaign average concentration: 18.5 µg m−3).
measured by AMS to investigate factors or sources contribut-ing to the organic mass loadcontribut-ings. The UMR input matri-ces were prepared according to the protocol outlined in Ul-brich et al. (2009) and comprised m/z’s 12–300. The HR data and error matrices were generated as outlined in De-Carlo et al. (2010). Ions fromm/z’s 12–115 were included in the data matrix; isotopes whose signal was constrained as the appropriate fraction of the peak area of their parent ion were removed. Elemental analysis of the HR data and PMF fac-tors was done using the software APES v1.05 (Sueper, 2008) within Igor Pro 6.22A. SMPS data were analyzed and cor-rected for multiply charged particles using the PSI inversion routine (Wiedensohler et al., 2011).
bATN measured at 880 nm by the aethalometer was cor-rected for multiple scattering of the light beam within the unloaded filter matrix (C= 2.81, Collaud Coen et al., 2010) and for the “shadowing” caused by the de-posited particles (f= 1.2) following the procedure by Weingartner et al. (2003), yielding the aerosol absorp-tion coefficient babs. babs and an absorption cross-section
σabs=σATN/Cof 5.91 m2g−1(σATN= 16.6 m2g−1delivered by the aethalometer data software) were then used to calcu-late BC mass concentration at 880 nm. All data are reported at local pressure and temperature conditions in local standard time (UTC + 1).
3 Results
3.1 PM1time series and bulk chemical composition
Figure 1 shows the time series of the cumulative mass of organics (Org), nitrate (NO3), chloride (Chl), ammo-nium (NH4), sulfate (SO4), and BC for the duration of the DAURE campaign. Charges are omitted for AMS nom-inally inorganic species, because non-ionic organosulfates and organonitrates may also contribute to their
concentra-tions (Farmer et al., 2010). The beginning of the cam-paign (25 February 2009–4 March 2009) and the second part (8–25 March 2009) were influenced by typical win-ter anti-cyclonic conditions in the Weswin-tern Mediwin-terranean Basin (WMB) which favor the accumulation of pollutants within the planetary boundary layer (PBL). Peak PM1 con-centrations of more than 60 µg m−3 were measured. The land/sea breeze cycle strongly influenced the daily evolu-tion of pollutant concentraevolu-tions during these episodes. The period from 4–8 March 2009 was characterized by Atlantic advection, with strong winds and precipitation on 5 March 2009. Clean air masses coming from the Atlantic renewed the polluted PBL and lowered concentrations (5–15 µg m−3 of PM1). The meteorological diurnal cycle was less distinct. Further details on meteorological and dispersion conditions during DAURE can be found in Jorba et al. (2011) and Pan-dolfi et al. (2012). Since the SMPS was used to estimate the AMS CE, Grimm PM1 data were added for compari-son purposes. The campaign average concentration value of 18.5 µg m−3of PM1compares well to 20 µg m−3of PM1 measured by combined AMS and aethalometer data. The co-efficients of a least orthogonal distance fit shown in Fig. S2 (intercept=−3.60,slope= 0.99) confirm the good agreement of AMS plus aethalometer vs. Grimm data.
for 15 %, NH+4 and SO24−for 16 % each, and elemental car-bon (EC) makes up 14 %. Comparisons of AMS nitrate to PM2.5 nitrate measured by an R&P ambient particulate ni-trate monitor (8400N, Rupprecht and Patashnick Co., Inc.) show good agreement (R2= 0.92), with the PM2.5nitrate be-ing 30 % higher.
3.2 PMF: identification of sources/components of organic aerosol (OA)
3.2.1 Factor profiles and time series
For both the UMR and HR organic data matrix, 5 fac-tors could be identified using PMF: low-volatility and semi-volatile oxygenated OA (LV-OOA and SV-OOA, the latter is a recombination of two individual factors, see section below), hydrocarbon-like OA (HOA), biomass burning OA (BBOA), and cooking OA (COA). Since the HR data matrix provides an increased level of information (individual ion signal) com-pared to the UMR data, factor profiles, time series, and main conclusions are based on the HR PMF solution. However, as there are versions of the AMS that only provide UMR data (aerosol chemical speciation monitor ACSM, Ng et al., 2011b; C-ToF-AMS, Drewnick et al., 2005; quadrupole-AMS, Canagaratna et al., 2007), the UMR PMF solution and a comparison of the UMR and HR PMF solution are presented in the SI, Sects. 3.1 and 3.2. For a discussion of the number of factors chosen and the criteria used to select the best UMR solution, we again refer the reader to the SI, Sect. 3.3. HR solution criteria are briefly outlined here, fig-ures can be found in the SI, Sect. 3.4.
The chosen 6-factor solution for the HR dataset is pre-sented in Fig. S15. The two SV-OOA factors were recom-bined into a single SV-OOA factor using the sum of the time series and the loadings-weighted average of the spectra. The 5-factor solution (Fig. S16) was discarded due to the high similarity of two factors (spectra and time series). The 7-factor solution (Fig. S17) features three LV-OOA spectra: PMF seems to assign an individual LV-OOA factor to three different sections in the time series, which can be due to small variations in instrument tuning with time. As the vari-ation in the solution spacep= 6 as a function off peak, a user-specified rotational parameter, is negligible (Figs. S18– 19), the most central solution (f peak = 0) was chosen and different SEED values (random initial values) were explored (Figs. S20 – 21). SEED = 46 was chosen as the best solu-tion due to correlasolu-tions with reference spectra, even though it exhibits the highestQ/Qexpectedvalue (12.75 compared to ∼12.55 for SEED6=46) and is thus not the mathematically optimal solution (see SI 3.3). A boxplot of the scaled residu-als (boxes are±25 % of points) perm/zis shown in Fig. S22, time series of the residuals andQ/Qexpected are shown in Fig. S23.Q/Qexpected≫1 (12.75) indicates an underestima-tion of the number of factors or of the errors in the input data, possibly due to fitting errors in the HR data which are
cur-rently not included in the total error estimation. In addition top >6 (which was explored and shown not to give a more plausible solution, see above), the introduction of a “model error term” might also reduceQ/Qexpected, however, as dis-cussed in Ulbrich et al. (2009), this is usually not applied in AMS data sets. Q/Qexpectedvalues≫1 for HR-ToF-AMS data have been shown recently by other authors, e.g. Allan et al. (2010) published aQ/Qexpectedvalue of 10.5.
Figure 2 shows the HR mass spectra of the 5 resulting factors. OOA is generally dominated by secondary organic aerosol formed in the atmosphere from gas-to-particle con-version processes of the oxidation products of volatile or-ganic compounds (VOCs, Hallquist et al., 2009). Numerous sources emitting a large number of different organic species (Goldstein and Galbally, 2007) contribute to OOA formation. However, photochemical aging causes the OOA UMR spec-tra to become progressively more and more similar and lose their source fingerprint (Andreae, 2009; Capes et al., 2008). Simultaneously, the fraction ofm/z44 (CO+2), mostly from the decarboxylation of carboxylic acids, increases (Ng et al., 2010). We use the terms “LV-OOA” and “SV-OOA” as in-troduced by Jimenez et al. (2009) although we did not ex-plicitly measure the volatility of the compounds within this study. LV-OOA and SV-OOA factors serve as a basis set for describing the range of physicochemical properties oc-curring in the dynamic evolution of OOA (Jimenez et al., 2009). The LV-OOA spectrum found here features domi-nant signals atm/z44 (with the signal at m/z 28 assumed equal to m/z 44, Aiken et al., 2008). TheR2of its corre-lation with the standard UMR LV-OOA spectrum from Ng et al. (2011a) is 0.96 (UncenteredR=0.77). The dominant ion families are CxHyO and CxHyOz(z >1); the O:C atomic ratio of 0.75 confirms the high degree of oxygenation. This value lies in the middle of the LV-OOA O:C range spanned by the 2-D framework of OA aging (where the oxidation state approximated by the O:C ratio is plotted against the satura-tion vapor pressure, Jimenez et al., 2009). It is in between the O:C ratios of 0.6 of the OOA spectrum found for Mex-ico City (where no separation of LV-OOA and SV-OOA was possible, Aiken et al., 2009) and 1.02 found for LV-OOA in aircraft measurements in the Mexico city region (DeCarlo et al., 2010). As also found by e.g. Lanz et al. (2007) and De-Carlo et al. (2010), the LV-OOA time series correlates with that of non-volatile, regionally-transported SO4(see Fig. 3,
R2= 0.43 for HR). Taken together with the high O:C ra-tio, this confirms LV-OOA as characteristic of aged, regional aerosol.
Consistent with its regional character, LV-OOA does not dis-play a pronounced diurnal pattern.
The SV-OOA spectrum was calculated by recombining two individual factors found by PMF, as described in the Supplement. Correlation with the standard SV-OOA mass spectrum from Ng et al. (2011a) yields anR2of 0.86 (Uncen-teredR=0.85). High signal atm/z44 (andm/z28) identifies it as OOA; the O:C (0.32) ratio is lower than for LV-OOA due to substantial contributions from the non-oxygen-containing ions at e.g.m/z29, 43, and 55. The substantial signal at the ion series CnH+2n+1 (m/z29, 43, 57, 71,) and CnH+2n−1(m/z 41, 55, 69,) from saturated alkanes, alkenes, and cycloalka-nes, and the diurnal cycle exhibiting the typical rush-hour peaks around 09:00 and 22:00 local time (further increased later due to the increase in boundary layer height) indicate an influence from vehicle emissions. The highest concentra-tions are measured around 11:00, linked to rapid SOA for-mation from primary emissions (Reche et al., 2011). A small peak in the late afternoon, when the photochemical activity is very high, corresponds to the daily maximum of O3 concen-trations (Pandolfi et al., 2012). The time series of SV-OOA shows a similar trend as the time series of the semi-volatile nitrate (see Fig. 3, R2= 0.22) also seen in other locations (Lanz et al., 2007; DeCarlo et al., 2010); the diurnal pat-terns of both SV-OOA and NO3(not shown) indicate that the temporal evolution of both components is driven by similar processes such as primary emissions, rapid chemical forma-tion, and the diurnal cycles of land/sea breeze and boundary layer height rather than gas-to-particle partitioning based on volatility characteristics. SV-OOA can thus be described as of more local origin, less processed than LV-OOA.
The HOA factor is related to fossil fuel combustion. Diesel exhaust is typically dominated by recondensed engine lubri-cating oil and consists mainly of n-alkanes, branched alka-nes, cycloalkaalka-nes, and aromatics (Canagaratna et al., 2004; Chirico et al., 2010), leading to high signal at the ion series CnH+2n+1 and CnH
+
2n−1. Especiallym/z57 is a major mass fragment and often used as a tracer for HOA (Zhang et al., 2005a). Given the high number of diesel cars in Barcelona (>45 % of the vehicle fleet, Reche et al., 2011) and proximity to the harbor, both vehicle and ship traffic could contribute to HOA (Murphy et al., 2009). However, the two distinct peaks in the morning and evening hours of the HOA diur-nal cycle (Fig. 4) suggest road traffic emissions as the main source; the sea breeze during the afternoon hours and the in-crease in boundary layer height have a diluting effect on the primary emissions. BC, particle number, toluene, benzene, and NOx peak at the same time of the day (Pandolfi et al., 2012). Correlation of the HOA factor found here with the standard HOA mass spectral profile from Ng et al. (2011a) yields anR2value of 0.94 (UncenteredR= 0.98). Consistent with the dominance of the reduced hydrocarbon ions (CxHy), the O:C ratio is very low (0.03), comparable to Mexico City (0.06, DeCarlo et al., 2010). The H:C elemental ratio (1.96) is the highest among the PMF factors. The HOA time
se-ries (Fig. 3) correlates with benzene (measured by a proton transfer reaction-mass spectrometer PTR-MS, Ionicon Ana-lytik), a natural constituent of gasoline and also formed by combustion (R2= 0.66), supporting the identification of road traffic as a major HOA source. The fraction of black carbon from traffic emissions was approximated by calculatingbabs
at 880 nm of PM from vehicle exhaust (babs (880 nm)traffic) using the model developed by Sandradewi et al. (2008), with an ˚Angstrom exponentαtraffic= 0.9 (Herich et al., 2011). The model uses the Lambert-Beer law to obtain equations which relate the absorption coefficients (babs)measured at two dif-ferent wavelengths with the ˚Angstrom exponents for condi-tions of pure traffic and pure biomass burning. The time se-riesbabs(880 nm)trafficand the HOA time series show a sim-ilar trend. However, there are spikes in the HOA time series not caught by the aethalometer model. This can be due to a lower time resolution of the aethalometer compared to the AMS or peaks in the organics time series assigned to HOA without or with lower concurrent BC emissions (i.e. possi-ble variations in HOA/BC emission ratios of various vehi-cles or other fossil sources in the area). Removing 18 data points (out of 6329) from spikes in the HOA time series (see Fig. S24) increases theR2value from initially 0.17 to 0.52.
BBOA in the Barcelona region can be emitted by regional agricultural open fires or due to long-range transported pol-lutants from forest or agricultural fires, and possibly also from wood-combustion heating systems in suburban and ru-ral areas (Reche et al., 2012). Characteristic mass fragments of BBOA spectra arem/z60 and 73, attributed to C2H4O+2 and C3H5O+2, respectively. The ions are fragments of an-hydrosugars such as levoglucosan, which are produced dur-ing cellulose pyrolysis (Alfarra et al., 2007). The BBOA time series closely follows the time series of the organic mass fragment 60 (Fig. 3). Contributions fromm/z29, 43, and 44 exceed the signals at m/z60 and 73 – however, as they are abundant in almost all PMF spectra, they cannot be used as tracer mass fragments for BBOA (Alfarra et al., 2007). Comparison of the BBOA factor found here with the standard BBOA spectrum from Ng et al. (2011a) yields an R2 value of 0.8 (Uncentered R= 0.9). BBOA contains high contributions from the oxygen-containing ion families. The O:C ratio of 0.24 is also higher than for the other pri-mary sources, in accordance with findings by e.g. Alfarra et al. (2007) and Aiken et al. (2009). The time series of BBOA shows a similar trend as thebabs(880 nm) from wood burning (babs(880 nm)wb), a surrogate for the BC fraction from biomass burning determined with the same method as
Fig. 2.Mass spectra of the 5-factor-PMF solution. The elemental ratios of the different factors are shown in boxes.
5
Fig. 3.Time series of the 5-factor-PMF solution and ancillary data. The right panels show the relative contributions of the respective factors to OA.
of (babs(880 nm)wb)as a function of αwb probably lead to the weak correlation. BBOA exhibits a much smoother diur-nal cycle than the other primary sources with no big peaks, which suggests that its sources are mainly outside of the city. As observed by Reche et al. (2012), concentrations during the night are slightly elevated due to smoke from open
Fig. 4. Diurnal cycles of the 5-factor-PMF solution. The colored lines represent the median per hour of day, and the shaded area the range between the 1st and the 3rd quartile of the data.
HOA spectrum; however, the oxygen-containing ions sub-stantially contribute to e.g.m/z’s 43, 55, and 57, consistent with the high degree of oxygenation of fatty acids, which are a major constituent of COA (Mohr et al., 2009; He et al., 2010). Consequently the elemental O:C ratio is higher (0.21) and the H:C ratio lower (1.57) than for HOA. An important mass fragment of COA UMR spectra ism/z55 (Lanz et al., 2007; Mohr et al., 2009; Allan et al., 2010; Sun et al., 2011). This is also shown by similarity of the time series of COA and them/z55 (Fig. 3). However, while the regression analysis of the UMR COA andm/z55 yields anR2of 0.59, theR2of 0.13 for HR COA andm/z55 is too low to confirm correlation due to the varying ratios of HR COA tom/z55. During the first part of the campaign (until 2 March 2009), HR COA is lower relative tom/z55, after 15 March 2009 it is higher. Comparison of the COA factor found here with the COA factor from Manchester (Allan et al., 2010) results in an
R2of 0.88 (UncenteredR= 0.93). The diurnal cycle (Fig. 4) shows that COA concentrations already start to rise during the late morning hours and peak around 15:00 (shortly after Spanish lunch times), when the sea breeze is at a maximum and transports the COA from downtown to the measurement site, and later in the evening around 22:00, shortly after
Spanish dinner time, due to the lower nocturnal boundary layer height. The COA diurnal cycle is consistent with those reported in previous studies (Allan et al., 2010; Huang et al., 2010; Sun et al., 2011), with peaks during midday (depend-ing on lunch times of the different countries) and in the later evening.
The right panel in Fig. 3 shows the mass of OA explained by the PMF factors. LV-OOA makes up 28 % of the OA. SV-OOA contributes 27 % to OA. Together, the secondary fraction accounts for 55 % of OA. This dominance of OOA is consistent with previous findings for various locations in Northern hemisphere midlatitudes and in central Europe (Jimenez et al., 2009; Lanz et al., 2010). For the primary components, COA makes up 17 %, HOA 16 %, and BBOA 11 %.
Fig. 5.Size distributions of PM1components for periods with high LV-OOA, SV-OOA, COA, HOA or BBOA. The number of data points averaged and the organic mass fraction (MF) of the respec-tive factor during those data points are given. Total AMS mass and SMPS data of the same time periods were added for comparison.
3.2.2 Size distributions
Figure 5 shows the mean mass size distributions of PM1 components for all periods when the percentage of total or-ganics of either LV-OOA, SV-OOA, COA, HOA or BBOA was above its upper 95 %-percentile and, at the same time, all other PMF factors’ fractions of total organics were be-low their upper 75 %-percentile. The number of points used in the average and the organic mass fractions of the corre-sponding factors during those periods are included in Fig. 5. Total AMS mass and SMPS data of the same time periods were added for comparison. The SMPS mass was calculated usingan average particle density based on the dry chemical compositiondetermined by the AMS (thus not including BC). The following densitiesρ (g cm−3)were used (Duplissy et al., 2011): for Org, ρ= 1.27; for SO4, ρ= 1.78; for NO3,
ρ= 1.72; for NH4,ρ= 1.75; and for Chl,ρ= 1.4. The SMPS mobility diameter was converted to the vacuum aerodynamic diameter (dva) (DeCarlo et al., 2004) using these densities and assuming spherical particles.
Periods with a larger impact of LV-OOA show a single-mode distribution peaking at 400 nm dva (accumulation mode), consistent with its identification as aged, region-ally influenced aerosol (Zhang et al., 2005b). The total AMS and SMPS mass size distributions show very good agreement, indicating negligible concentrations of BC dur-ing high LV-OOA periods and sphericity of particles (De-Carlo et al., 2004; Slowik et al., 2004). During high SV-OOA episodes, the size distribution exhibits both a strong accumulation mode and a smaller mode withdva<100 nm. This is most likely due to condensation of fresh secondary OA (Zhang et al., 2005b). Compared to the AMS total mass, the SMPS mass distribution is much broader with a lower accumulation mode peak height, indicating the potential role of non-spherical particles at higher sizes. Potential evapo-rative losses of semi-volatile species such as ammonium ni-trate and SV-OOA in the DMA-CPC system (Gysel et al., 2007) could also lead to this underestimation (the ammo-nium nitrate fraction is larger during SV-OOA dominated periods than when LV-OOA concentrations are high). The AMS size distribution during high HOA episodes features a bimodal distribution with contributions from particles with
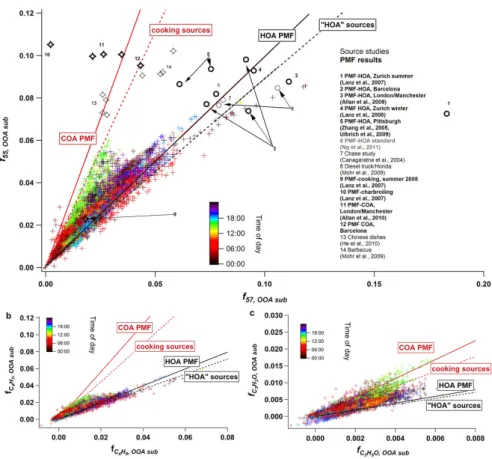
Fig. 6. f55,OOAsub(see text) plotted againstf57,OOAsub(a),fC4H7+,OOAsubplotted againstfC4H+9,OOAsub
andfC3H3O+,OOAsubagainst
fC3H5O+,OOAsub (c)for the whole Barcelona dataset. Data points are colored according to time of day. Included in(a)areF55 and
F57extracted from various PMF HOA and COA factors (bold symbols), as well as from cooking and traffic source emission studies (thin symbols), the lines represent the linear fits applied to each group. Note that axes are scaled differently for clarity reasons.
by Hildemann et al. (1991b) for meat cooking aerosol, with the peak center at around 200 nm mobility diameter. Rogge et al. (1991) explained the formation of PM from (meat) cooking activities by nucleation and growth of evaporated grease, which most likely yields spherical particles. For periods when BBOA dominates the organic composition, also ammonium nitrate concentrations are rather high. As shown in Fig. 4, BBOA is slightly increased during night-time, when lower temperatures favor partitioning of semi-volatile species such as nitrate into the particle phase. Con-sequently, the difference between SMPS and total AMS mass size distribution is especially distinct for BBOA episodes. The AMS size distribution peaks at∼500 nm, contributions from particles with a dva of ∼200 nm can be observed as well.
3.3 Cooking organic aerosol
As described in Sect. 3.2.1, COA and HOA show clear dif-ferences in the ratio of oxygen-containing ions to reduced ions and thus in their degree of oxygenation. However, if only AMS UMR data is available, the detection of COA in
ambient air can be difficult due to the similarity of its UMR spectrum with HOA (Mohr et al., 2009). This spectral sim-ilarity complicates efforts to resolve distinct HOA and COA factors by PMF and is a likely cause of the scarcity of COA factors resolved from urban AMS datasets (Lanz et al., 2007; Allan et al., 2010; Huang et al., 2010; Slowik et al., 2010; Crippa et al., 2012). However, the substantial contributions of COA to total organic PM1suggest the importance of this anthropogenic activity to urban air quality. Here the spectral characteristics of HOA and COA discussed above are used to develop an approach for distinguishing and quantifying the contributions of HOA and COA to ambient aerosol.
3.3.1 Organic mass fragments 55 and 57
Fig. 7. Stacked diurnal cycle of the time series of the fractions ofm/z55(a), C4H+7 (b), and C3H3O+(c)of LV-OOA, SV-OOA, HOA, COA, and BBOA, respectively, normalized to total organics.
quantities:
f55,OOAsub=(m/z55−m/z55LV−OOA−m/z55SV−OOA)/Org (1)
f57,OOAsub=(m/z57−m/z57LV−OOA−m/z57SV−OOA)/Org (2) Contributions from LV- and SV-OOA are calculated as the product of the factor time series and the mass fraction of the selected m/z in the factor mass spectrum. Figure 6a showsf55,OOAsubas a function off57,OOAsubfor the whole Barcelona dataset. The data points fall into a V-shape in the scatter plot; subtraction of the LV- and SV-OOA inter-ferences changed the intercept to 0 (compare Fig. S25) but
did not otherwise alter the result. Data points are colored by time of day. Thef55,OOAsub/f57,OOAsubslope is steepest in the afternoon, corresponding to the peak in the COA di-urnal pattern (see Fig. 4). In contrast, the shallowest slopes are found in the road traffic-dominated morning and evening hours.
Figure 6a also includesF55 (defined asm/z55/Org) and
F57 (m/z 57/Org) from PMF HOA and COA factors (bold symbols), as well as from emission spectra of cooking and road traffic sources (thin symbols). These factors/sources were grouped as “cooking-like” or “traffic-like”, and a lin-ear fit was applied to each group. Point #1, Zurich Sum-mer PMF-HOA (Lanz et al., 2007), was excluded as an out-lier. Fits to the cooking-like (red solid and dotted lines) and traffic-like (black solid and dotted lines) follow the higher and lower edges of the Barcelona data in Fig. 6a, which cor-respond to cooking- and traffic-influenced data, respectively. This supports the use of thef55,OOAsub/f57,OOAsubratio as a metric for identifying COA.
Figure 2 shows thatm/z55 for HOA is composed mostly of a different ion (C4H+7)than COA (C4H+7 and C3H3O+). High resolution source spectra show consistent results; see Fig. S26. Similarly, for HOAm/z57 is composed of C4H+9 while COA m/z 57 includes both C4H+9 and C3H5O+. A simplified apportionment of these ions is assessed in Fig. 6b and c, where C3H3O+ and C3H5O+ are apportioned to COA, with C4H+7 and C4H+9 apportioned entirely to HOA. These figures are similar to Fig. 6a, with f55,OOAsub and
f57,OOAsub replaced byfC4H+7,OOAsubandfC4H9
+,OOAsub in Fig. 6b, and by fC
3H3O+,OOAsub and fC3H5O+,OOAsub in
Fig. 6c. Solid and dashed lines are the same as in Fig. 6a. HOA and COA are much less distinguishable in Fig. 6b than for the UMR data (6a), with the data points mostly aligned to the HOA fit line. This results from the low ra-tio offC
4H+7,OOAsub to fC4H+9,OOAsub. In contrast, Fig. 6c
shows thatfC3H3O+,OOAsubandfC
3H5O+,OOAsubare
Fig. 8.Comparison of PMF COA and COA estimated using organic mass fragments 55, 57, and 44 (COA est), time series(a)and scatterplot of time series(b).
3.3.2 Estimation of COA fromm/z55
In this section a simple approximation to estimate the COA concentration based on the time series of the organic mass fragments 55, 57, and 44 is provided. Similar methods to estimate HOA, BBOA, and OOA concentrations have been given by Aiken et al. (2009). As described in the previous section,m/z55 can be used as a tracer for COA, even though its signal also has contributions from the other factors, mostly HOA and OOA (Eq. 2). BBOA can contribute as well to m/z55; however, due to the high variability wood burning spectra (Weimer et al., 2008) and the low BBOA concentra-tions in Barcelona it was not considered in the estimation. m/z55=m/z55(COA)+m/z55(HOA)+m/z55(OOA) (3) Consequently, the contributions from the other factors have to be subtracted and the remainingm/z55(COA) has to be scaled up by a factorq to yield the estimated COA concen-tration COAest,
COAest=q×m/z55(COA) (4) The contribution from OOA tom/z55 is assumed to be linear withm/z44,
m/z55(OOA)=b×m/z44 (5)
where
b=F55,OOA
F44,OOA
(6)
F55,OOAdenotes the signal atm/z55 in the OOA mass spec-trum normalized to the sum of the specspec-trum.
The contribution from HOA tom/z55 is assumed to be linear withm/z57,
m/z55(HOA)=a×m/z57(HOA) (7)
where
a=F55,HOA
F57,HOA
(8) m/z57 can have contributions not only from HOA, but also from COA and OOA; thus:
m/z57(HOA)=m/z57−m/z57(COA)−m/z57(OOA) (9) The last term in Eq. (9) is again linear withm/z44, with the coefficient
c=F57,OOA
F44,OOA
(10) With
m/z57(COA)=1
d×m/z55(COA) (11) d=F55,COA
F57,COA
(12) Eq. (4) can be solved as
COAest=q× "1
am/z55−m/z57+ c− b a
m/z44 1
a−1d
#
(13)
with
q= 1
F55,COA
(14) The coefficients a, b, c, d, and q were estimated using the PMF factor mass spectra from this study and those published in Allan et al. (2010), and Crippa et al. (2011):
q= 11±2;a= 0.9±0.2;b= 0.15±0.1;c= 0.07±0.07; and
PMF COA time series and COAestyields anR2 of 0.7; the
R2of the correlation with the HR solution is lower (0.32) due to the period in the beginning, until 02 March 2009 (compare Sect. 3.2.1). Removing the Barcelona data (a= 0.8,b= 0.12,
c= 0.03, d= 2.2, and q= 10) from the average coefficients calculation did not change the values fora,b,c,d, andq; thus, the comparison between COAestand PMF COA is not positively biased by the double use of the same data set. The application of this approach to other datasets and the com-parison of coefficient values will be of great interest, as dis-crepancies can also be influenced by some variation of mass spectral patterns between different instruments.
4 Conclusions
Several studies confirm the possible importance of cooking activities as a major contributor to urban aerosol loadings; however, the number of urban environments where COA was detected and quantified is still very low. A reason for that might be the similarity of AMS UMR spectra of HOA and COA. This paper presents an approach to detect cook-ing organic aerosol (COA) in ambient datasets and a simple method based on organic mass fragments 55, 57, and 44 mea-sured by AMS to estimate COA concentrations.
AMS data were acquired at an urban background site in Barcelona, Spain, during March 2009, in order to in-vestigate the specific high PM winter anticyclone episodes. PMF analysis revealed 5 factors or sources contributing to OA: LV-OOA, related to regional, aged secondary OA; SV-OOA, an early-generation secondary OA with substantial contributions from immediately formed secondary or oxi-dized primary OA from vehicle emissions; HOA (primary hydrocarbon-like OA, again related to traffic and possibly ship emissions); BBOA from domestic heating or agricul-tural wood burning activities; and COA (cooking organic aerosol). From these results we estimate that POA in Barcelona has a non-fossil carbon fraction of about 59 %, which helps explain the high non-fossil fraction of OC ob-served during DAURE.
The COA HR spectrum contains considerable signal from oxygenated ions whereas the HR HOA spectrum has al-most exclusively contributions from chemically reduced ions, however, on a UMR basis, the spectral patterns are very similar. Plottingm/z55 normalized to total organics against m/z57 normalized to total organics helps identify COA in ambient datasets: The data points fall into a V-shape, with HOA-influenced data aligned to the lower arm, a line de-fined by fittingF55 and F57 from various PMF HOA and vehicle emissions spectra; COA influenced data points lie on the upper arm of the V-shape denoted by a fit ofF55 and
F57 from PMF COA factors and cooking emissions spectra. HR data show that this differentiation is mainly driven by the oxygen-containing ions C3H3O+and C3H5O+. C3H3O+ shows lower signal than C4H+7, but that signal is to a larger
extent from COA emissions than that from C4H+7 compared to the other factors, and thus helps identifying the COA fac-tor much better than C4H+7.
The agreement of COA estimated based on mass frag-ments 55, 57, and 44 and the PMF COA is satisfying for the present dataset. The application of this approach to other datasets will be of great interest to validate the coefficients determined in this study.
COA contributes 17 % to organic PM in Barcelona during the winter anticyclonic pollution episodes, consistent with the high non-fossil fraction of carbonaceous PM1 found by 14C analysis. This is a significant fraction with consequences for human health; even more so since cooking is usually an indoor activity and what is being measured at an urban back-ground site is already significantly diluted compared to the emission sites. The study emphasizes the significance of cooking activities for ambient air quality and confirms the importance of chemical composition measurements with a high mass and time resolution.
Supplementary material related to this article is available online at:
http://www.atmos-chem-phys.net/12/1649/2012/ acp-12-1649-2012-supplement.pdf.
Acknowledgements. We thank the organizers of the DAURE
project, including Mar Viana and everybody else at ICTJA for their work and help. We acknowledge the CCES project IMBALANCE and the EU-FP7 project EUCAARI for financial support and ’Accion Complementaria DAURE’ from the Spanish Ministry of Science and Innovation (CGL2007-30502-E/CLI) for infrastructure support. P. F. DeCarlo is grateful for the postdoctoral support from the US-NSF (IRFP# 0701013). J. Pe˜nuelas and R. Seco were sup-ported by the Spanish Government projects CGL2010-17172 and Consolider Ingenio Montes CSD2008-00040, and by a postdoctoral grant from Fundaci´on Ram´on Areces to R. Seco. The National Center for Atmospheric Research is sponsored by the National Science Foundation. J. L. Jimenez was supported by NSF ATM-0919189 and DOE (BER, ASR program) DE-FG02-11ER65293.
Edited by: L. Molina
References
Aiken, A. C., Salcedo, D., Cubison, M. J., Huffman, J. A., DeCarlo, P. F., Ulbrich, I. M., Docherty, K. S., Sueper, D., Kimmel, J. R., Worsnop, D. R., Trimborn, A., Northway, M., Stone, E. A., Schauer, J. J., Volkamer, R. M., Fortner, E., de Foy, B., Wang, J., Laskin, A., Shutthanandan, V., Zheng, J., Zhang, R., Gaffney, J., Marley, N. A., Paredes-Miranda, G., Arnott, W. P., Molina, L. T., Sosa, G., and Jimenez, J. L.: Mexico City aerosol analysis during MILAGRO using high resolution aerosol mass spectrometry at the urban supersite (T0) – Part 1: Fine particle composition and organic source apportionment, Atmos. Chem. Phys., 9, 6633– 6653, doi:10.5194/acp-9-6633-2009, 2009.
Ajuntament de Barcelona: Dades b`asiques 2006, Direcci´o de serveis de mobilitat, Barcelona, 2007.
Alfarra, M. R., Prevot, A. S. H., Szidat, S., Sandradewi, J., Weimer, S., Lanz, V. A., Schreiber, D., Mohr, M., and Baltensperger, U.: Identification of the mass spectral signature of organic aerosols from wood burning emissions, Environ. Sci. Technol., 41, 5770– 5777, 2007.
Allan, J. D., Williams, P. I., Morgan, W. T., Martin, C. L., Flynn, M. J., Lee, J., Nemitz, E., Phillips, G. J., Gallagher, M. W., and Coe, H.: Contributions from transport, solid fuel burning and cooking to primary organic aerosols in two UK cities, Atmos. Chem. Phys., 10, 647–668, doi:10.5194/acp-10-647-2010, 2010. Andreae, M. O.: A new look at aging aerosols, Science, 326, 1493–
1494, doi:10.1126/science.1183158, 2009.
Baltensperger, U., Chirico, R., DeCarlo, P. F., Dommen, J., Gaeggeler, K., Heringa, M. F., Li, M. L., Prevot, A. S. H., Al-farra, M. R., Gross, D. S., and Kalberer, M.: Recent develop-ments in the mass spectrometry of atmospheric aerosols, Eur. J. Mass Spectrom., 16, 389–395, 2010.
Canagaratna, M. R., Jayne, J. T., Ghertner, D. A., Herndon, S., Shi, Q., Jimenez, J. L., Silva, P. J., Williams, P., Lanni, T., Drewnick, F., Demerjian, K. L., Kolb, C. E., and Worsnop, D. R.: Chase studies of particulate emissions from in-use New York City vehi-cles, Aerosol. Sci. Technol., 38, 555–573, 2004.
Canagaratna, M. R., Jayne, J. T., Jimenez, J. L., Allan, J. D., Al-farra, M. R., Zhang, Q., Onasch, T. B., Drewnick, F., Coe, H., Middlebrook, A., Delia, A., Williams, L. R., Trimborn, A. M., Northway, M. J., DeCarlo, P. F., Kolb, C. E., Davidovits, P., and Worsnop, D. R.: Chemical and microphysical characterization of ambient aerosols with the Aerodyne aerosol mass spectrometer, Mass Spectrom. Rev., 26, 185–222, 2007.
Capes, G., Johnson, B., McFiggans, G., Williams, P. I., Haywood, J., and Coe, H.: Aging of biomass burning aerosols over West Africa: Aircraft measurements of chemical composition, mi-crophysical properties, and emission ratios, J. Geophys. Res-Atmos., 113, D00C15, doi:10.1029/2008JD009845, 2008. Cass, G. R.: Organic molecular tracers for particulate air pollution
sources, TRAC-Trend. Anal. Chem., 17, 356–366, 1998. Chirico, R., DeCarlo, P. F., Heringa, M. F., Tritscher, T., Richter,
R., Pr´evot, A. S. H., Dommen, J., Weingartner, E., Wehrle,ˆ
G., Gysel, M., Laborde, M., and Baltensperger, U.: Impact of aftertreatment devices on primary emissions and secondary or-ganic aerosol formation potential from in-use diesel vehicles: re-sults from smog chamber experiments, Atmos. Chem. Phys., 10, 11545–11563, doi:10.5194/acp-10-11545-2010, 2010.
Crippa, M., DeCarlo, P. F., Mohr, C., Heringa, M. F., Chirico,R., Slowik, J. G., Poulain, L., Wiedensohler, A., Freutel, F.,Drewnick, F., Schneider, J., Di Marco, C. F., Nemitz, E.,
Zim-mermann,R., Els¨asser, M., Pr´evˆot, A. S. H., and Baltensperger, U.: Wintertime aerosols chemical composition and source appor-tionmentin the metropolitan area of Paris, in preparation, 2012. DeCarlo, P. F., Slowik, J. G., Worsnop, D. R., Davidovits, P., and
Jimenez, J. L.: Particle morphology and density characteriza-tion by combined mobility and aerodynamic diameter measure-ments. Part 1, Theory Aerosol. Sci. Technol., 38, 1185–1205, doi:10.1080/027868290903907, 2004.
DeCarlo, P. F., Kimmel, J. R., Trimborn, A., Northway, M. J., Jayne, J. T., Aiken, A. C., Gonin, M., Fuhrer, K., Horvath, T., Docherty, K. S., Worsnop, D. R., and Jimenez, J. L.: Field-deployable, high-resolution, time-of-flight aerosol mass spectrometer, Anal. Chem., 78, 8281–8289, 2006.
DeCarlo, P. F., Ulbrich, I. M., Crounse, J., de Foy, B., Dunlea, E. J., Aiken, A. C., Knapp, D., Weinheimer, A. J., Campos, T., Wennberg, P. O., and Jimenez, J. L.: Investigation of the sources and processing of organic aerosol over the Central Mex-ican Plateau from aircraft measurements during MILAGRO, At-mos. Chem. Phys., 10, 5257–5280, doi:10.5194/acp-10-5257-2010, 2010.
Docherty, K. S., Aiken, A. C., Huffman, J. A., Ulbrich, I. M., De-Carlo, P. F., Sueper, D., Worsnop, D. R., Snyder, D. C., Grover, B. D., Eatough, D. J., Goldstein, A. H., Ziemann, P. J., and Jimenez, J. L.: The 2005 Study of Organic Aerosols at River-side (SOAR-1): instrumental intercomparisons and fine parti-cle composition, Atmos. Chem. Phys. Discuss., 11, 6301–6362, doi:10.5194/acpd-11-6301-2011, 2011.
Drewnick, F., Hings, S. S., DeCarlo, P., Jayne, J. T., Gonin, M., Fuhrer, K., Weimer, S., Jimenez, J. L., Demerjian, K. L., Bor-rmann, S., and Worsnop, D. R.: A new time-of-flight aerosol mass spectrometer (TOF-AMS) – Instrument description and first field deployment, Aerosol. Sci. Technol., 39, 637–658, 2005.
Duplissy, J., DeCarlo, P. F., Dommen, J., Alfarra, M. R., Met-zger, A., Barmpadimos, I., Prevot, A. S. H., Weingartner, E., Tritscher, T., Gysel, M., Aiken, A. C., Jimenez, J. L., Cana-garatna, M. R., Worsnop, D. R., Collins, D. R., Tomlinson, J., and Baltensperger, U.: Relating hygroscopicity and composition of organic aerosol particulate matter, Atmos. Chem. Phys., 11, 1155–1165, doi:10.5194/acp-11-1155-2011, 2011.
Farmer, D. K., Matsunaga, A., Docherty, K. S., Surratt, J. D., Se-infeld, J. H., Ziemann, P. J., and Jimenez, J. L.: Response of an aerosol mass spectrometer to organonitrates and organosulfates and implications for atmospheric chemistry, P. Natl. A Sci. In-dia, 107, 6670–6675, doi:10.1073/pnas.0912340107, 2010. Fortmann, R., Kariher, P., and Clayton, R.: Indoor air quality:
Res-idential cooking exposures. Final report., State of California Air Resources Board, Research Division, Sacramento, CA, 2001. Goldstein, A. H. and Galbally, I. E.: Known and unexplored organic
constituents in the earth’s atmosphere, Environ. Sci. Technol., 41, 1514–1521, 2007.
Grantz, D. A., Garner, J. H. B., and Johnson, D. W.: Ecolog-ical effects of particulate matter, Environ. Int., 29, 213–239, doi:10.1016/s0160-4120(02)00181-2, 2003.
Gray, H. A.: Control of atmospheric fine primary carbon particle concentrations. Final report for California Air Resources Board., Environmental Quality Laboratory, California Institute of Tech-nology, Pasadena, 353 pp., 1986.
N., Cubison, M. J., Williams, P. I., Flynn, M. J., McFiggans, G. B., and Coe, H.: Closure study between chemical composition and hygroscopic growth of aerosol particles during TORCH2, Atmos. Chem. Phys., 7, 6131–6144, doi:10.5194/acp-7-6131-2007, 2007.
Hallquist, M., Wenger, J. C., Baltensperger, U., Rudich, Y., Simp-son, D., Claeys, M., Dommen, J., Donahue, N. M., George, C., Goldstein, A. H., Hamilton, J. F., Herrmann, H., Hoff-mann, T., Iinuma, Y., Jang, M., Jenkin, M. E., Jimenez, J. L., Kiendler-Scharr, A., Maenhaut, W., McFiggans, G., Mentel, Th. F., Monod, A., Prev´ ot, A. S. H., Seinfeld, J. H., Surratt, J. D.,ˆ
Szmigielski, R., and Wildt, J.: The formation, properties and impact of secondary organic aerosol: current and emerging is-sues, Atmos. Chem. Phys., 9, 5155–5236, doi:10.5194/acp-9-5155-2009, 2009.
He, L.-Y., Hu, M., Huang, X.-F., Yu, B.-D., Zhang, Y.-H., and Liu, D.-Q.: Measurement of emissions of fine particulate organic matter from Chinese cooking, Atmos. Environ., 38, 6557–6564, 2004.
He, L.-Y., Lin, Y., Huang, X.-F., Guo, S., Xue, L., Su, Q., Hu, M., Luan, S.-J., and Zhang, Y.-H.: Characterization of high-resolution aerosol mass spectra of primary organic aerosol emis-sions from Chinese cooking and biomass burning, Atmos. Chem. Phys., 10, 11535–11543, doi:10.5194/acp-10-11535-2010, 2010. Herich, H., Hueglin, C., and Buchmann, B.: A 2.5 year’s source ap-portionment study of black carbon from wood burning and fos-sil fuel combustion at urban and rural sites in Switzerland, At-mos. Meas. Tech., 4, 1409–1420, doi:10.5194/amt-4-1409-2011, 2011.
Hildemann, L. M., Markowski, G. R., and Cass, G. R.: Chemi-cal composition of emissions from urban sources of fine organic aerosol, Environ. Sci. Technol., 25, 744–759, 1991a.
Hildemann, L. M., Markowski, G. R., Jones, M. C., and Cass, G. R.: Submicrometer aerosol mass distributions of emissions from boilers, fireplaces, automobiles, diesel trucks, and meat-cooking operations, Aerosol. Sci. Technol., 14, 138–152, 1991b. Huang, X.-F., He, L.-Y., Hu, M., Canagaratna, M. R., Sun, Y.,
Zhang, Q., Zhu, T., Xue, L., Zeng, L.-W., Liu, X.-G., Zhang, Y.-H., Jayne, J. T., Ng, N. L., and Worsnop, D. R.: Highly time-resolved chemical characterization of atmospheric submi-cron particles during 2008 Beijing Olympic Games using an Aerodyne High-Resolution Aerosol Mass Spectrometer, Atmos. Chem. Phys., 10, 8933–8945, doi:10.5194/acp-10-8933-2010, 2010.
IPCC: Fourth Assessment Report: The Physical Science Basis, Working Group I, Final Report, Geneva, Switzerland, available at: http://www.ipcc.ch/ipccreports/ar4-wg1.htm, 2007.
Jimenez, J. L., Canagaratna, M. R., Donahue, N. M., Prevot, A. S. H., Zhang, Q., Kroll, J. H., DeCarlo, P. F., Allan, J. D., Coe, H., Ng, N. L., Aiken, A. C., Docherty, K. S., Ulbrich, I. M., Grieshop, A. P., Robinson, A. L., Duplissy, J., Smith, J. D., Wil-son, K. R., Lanz, V. A., Hueglin, C., Sun, Y. L., Tian, J., Laak-sonen, A., Raatikainen, T., Rautiainen, J., Vaattovaara, P., Ehn, M., Kulmala, M., Tomlinson, J. M., Collins, D. R., Cubison, M. J., Dunlea, E. J., Huffman, J. A., Onasch, T. B., Alfarra, M. R., Williams, P. I., Bower, K., Kondo, Y., Schneider, J., Drewnick, F., Borrmann, S., Weimer, S., Demerjian, K., Salcedo, D., Cot-trell, L., Griffin, R., Takami, A., Miyoshi, T., Hatakeyama, S., Shimono, A., Sun, J. Y., Zhang, Y. M., Dzepina, K., Kimmel, J.
R., Sueper, D., Jayne, J. T., Herndon, S. C., Trimborn, A. M., Williams, L. R., Wood, E. C., Middlebrook, A. M., Kolb, C. E., Baltensperger, U., and Worsnop, D. R.: Evolution of organic aerosols in the atmosphere, Science, 326, 1525–1529, 2009. Jorba, O., Pandolfi, M., Spada, M., Baldasano, J. M., Pey, J.,
Alastuey, A., Arnold, D., Sicard, M., Arti˜nano, B., Revuelta, M. A., and Querol, X.: The DAURE field campaign: meteoro-logical overview, Atmos. Chem. Phys. Discuss., 11, 4953–5001, doi:10.5194/acpd-11-4953-2011, 2011.
Lanz, V. A., Alfarra, M. R., Baltensperger, U., Buchmann, B., Hueglin, C., and Pr´evot, A. S. H.: Source apportionment ofˆ
submicron organic aerosols at an urban site by factor analyti-cal modelling of aerosol mass spectra, Atmos. Chem. Phys., 7, 1503–1522, doi:10.5194/acp-7-1503-2007, 2007.
Lanz, V. A., Alfarra, M. R., Baltensperger, U., Buchmann, B., Hueglin, C., Szidat, S., Wehrli, M. N., Wacker, L., Weimer, S., Caseiro, A., Puxbaum, H., and Prevot, A. S. H.: Source attribu-tion of submicron organic aerosols during wintertime inversions by advanced factor analysis of aerosol mass spectra, Environ. Sci. Technol., 42, 214–220, doi:10.1021/Es0707207, 2008. Lanz, V. A., Prev´ ot, A. S. H., Alfarra, M. R., Weimer, S., Mohr,ˆ
C., DeCarlo, P. F., Gianini, M. F. D., Hueglin, C., Schneider, J., Favez, O., D’Anna, B., George, C., and Baltensperger, U.: Char-acterization of aerosol chemical composition with aerosol mass spectrometry in Central Europe: an overview, Atmos. Chem. Phys., 10, 10453–10471, doi:10.5194/acp-10-10453-2010, 2010. Middlebrook, A. M., Bahreini, R., Jimenez, J. L., and Cana-garatna, M. R.: Evaluation of composition-dependent col-lection efficiencies for the Aerodyne aerosol mass spectrom-eter using field data, Aerosol. Sci. Technol., 46, 258–271, doi:10.1080/02786826.2011.620041, 2011.
Minguill´on, M. C., Perron, N., Querol, X., Szidat, S., Fahrni, S., Alastuey, A., Jimenez, J. L., Mohr, C., Ortega, A., Day, D. A., Lanz, V. A., Wacker, L., Reche, C., Cusack, M., Amato, F., Kiss, G., Hoffer, A., Decesari, S., Moretti, F., Hillamo, R., Teinil¨a, K., Seco, R., Pe˜nuelas, J., Metzger, A., Schallhart, S., M¨uller, M., Hansel, A., Burkhart, J., Baltensperger, U., and Prevot, A. S. H.: Fossil versus contemporary sources of fine elemental and organic carbonaceous particulate matter during the DAURE campaign in Northeast Spain, Atmos. Chem. Phys., 11, 12067–12084, 10,
http://www.atmos-chem-phys.net/11/12067/10/.5194/acp-11-12067-2011, 2011.
Mohr, C., Huffman, J. A., Cubison, M. J., Aiken, A. C., Docherty, K. S., Kimmel, J. R., Ulbrich, I. M., Hannigan, M., and Jimenez, J. L.: Characterization of primary organic aerosol emissions from meat cooking, trash burning, and motor vehicles with high-resolution aerosol mass spectrometry and comparison with ambi-ent and chamber observations, Environ. Sci. Technol., 43, 2443– 2449, 2009.
Mohr, C., Richter, R., DeCarlo, P. F., Pr´evˆot, A. S. H., and Bal-tensperger, U.: Spatial variation of chemical composition and sources of submicron aerosol in Zurich during wintertime using mobile aerosol mass spectrometer data, Atmos. Chem. Phys., 11, 7465–7482, doi:10.5194/acp-11-7465-2011, 2011.
doi:10.1029/2006JD007340, 2006.
Murphy, S. M., Agrawal, H., Sorooshian, A., Padr´o, L. T., Gates, H., Hersey, S., Welch, W. A., Jung, H., Miller, J. W., Cocker, D. R., Nenes, A., Jonsson, H. H., Flagan, R. C., and Seinfeld, J. H.: Comprehensive simultaneous shipboard and airborne characteri-zation of exhaust from a modern container ship at sea, Environ. Sci. Technol., 43, 4626–4640, 2009.
Nel, A.: Air pollution-related illness: Effects of particles, Science, 308, 804–806, doi:10.1126/science.1108752, 2005.
Nemitz, E., Jimenez, J. L., Huffman, J. A., Ulbrich, I. M., Cana-garatna, M. R., Worsnop, D. R., and Guenther, A. B.: An Eddy-covariance system for the measurement of surface/atmosphere exchange fluxes of submicron aerosol chemical species – First application above an urban area, Aerosol. Sci. Technol., 42, 636– 657, 2008.
Nemitz, E., Prevot, A. S. H., ¨Aij¨al¨a, M., Allan, J. D., Berresheim, H., Carbone, S., Canagaratna, M. R., Capes, G., Ceburnis, D., Choularton, T., Coe, H., Cubison, M. J., Dall’Osto, M., Di Marco, C. F., DeCarlo, P. F., Ehn, M., Eriksson, A., Freney, E., Herrmann, H., Jimenez, J. L., Hildebrandt, L., Juninen, H., Kiendler-Scharr, A., Laaksonen, A., Lanz, V. A., McFiggans, G., Mensah, A., Mentel, T. F., Mohr, C., O’Dowd, C., Ortega, A., Ovadnevaite, J., Pagels, J., Pandis, S. N., Phillips, G. J., Poulain, L., Raatikainen, T., Saarikoski, S., Sellegri, K., Spindler, G., Sueper, D., Swietlicki, E., Tiitta, P., and Worsnop, D. R.: Eu-ropean submicron aerosol chemical composition derived from a campaign-based Aerosol Mass Spectrometer network, in prepa-ration, 2012.
Ng, N. L., Canagaratna, M. R., Zhang, Q., Jimenez, J. L., Tian, J., Ulbrich, I. M., Kroll, J. H., Docherty, K. S., Chhabra, P. S., Bahreini, R., Murphy, S. M., Seinfeld, J. H., Hildebrandt, L., Donahue, N. M., DeCarlo, P. F., Lanz, V. A., Prev´ ot, A. S. H.,ˆ
Dinar, E., Rudich, Y., and Worsnop, D. R.: Organic aerosol components observed in Northern Hemispheric datasets from Aerosol Mass Spectrometry, Atmos. Chem. Phys., 10, 4625– 4641, doi:10.5194/acp-10-4625-2010, 2010.
Ng, N. L., Canagaratna, M. R., Jimenez, J. L., Zhang, Q., Ulbrich, I. M., and Worsnop, D. R.: Real-time methods for estimating organic component mass concentrations from aerosol mass spec-trometer data, Environ. Sci. Technol., 45, 910–916, 2011a. Ng, N. L., Herndon, S. C., Trimborn, A., Canagaratna, M. R.,
Croteau, P. L., Onasch, T. B., Sueper, D., Worsnop, D. R., Zhang, Q., Sun, Y. L., and Jayne, J. T.: An aerosol chemical speciation monitor (ACSM) for routine monitoring of the composition and mass concentrations of ambient aerosol, Aerosol. Sci. Technol., 45, 780–794, 2011b.
Paatero, P. and Tapper, U.: Positive matrix factorization – a nonneg-ative factor model with optimal utilization of error-estimates of data values, Environmetrics, 5, 111–126, 1994.
Pandolfi, M., Querol, X., Alastuey, A., Jimenez, J. L., Cusack, M., Reche, C., Pey, J., Mohr, C., DeCarlo, P. F., Ortega, A., Day, D., Prevot, A. S. H., Baltensperger, U., Arti˜nano, B., Baldasano, J. M., Jorba, O., Burkhart, J., Hansel, A., Schallhart, S., M¨uller, M., Metzger, M., Saarikoski, S., Cubison, M. J., Ng, S., Lorente, J., Nemitz, E., Di Marco, C., Pe˜nuelas, J., Sicard, M., Comeron, A., Amato, F., Moreno, T., Viana , M., P´erez, N., Moreno, N., Seco, R., Filella, I., Llusi`a, J., Piot, M., and Pay, M. T.: Sources and origin of PM in the Western Mediterranean Basin: An overview of the DAURE campaign, in preparation, 2012.
P´erez, C., Nickovic, S., Baldasano, J. M., Sicard, M., Rocaden-bosch, F., and Cachorro, V. E.: A long Saharan dust event over the western Mediterranean: Lidar, Sun photometer observations, and regional dust modeling, J. Geophys. Res., 111, D15214, doi:10.1029/2005JD006579, 2006.
P´erez, N., Pey, J., Castillo, S., Viana, M., Alastuey, A., and Querol, X.: Interpretation of the variability of levels of regional back-ground aerosols in the Western Mediterranean, Sci. Total Envi-ron., 407, 527–540, 2008a.
P´erez, N., Pey, J., Querol, X., Alastuey, A., L´opez, J. M., and Viana, M.: Partitioning of major and trace components in PM10-PM2.5 -PM1at an urban site in Southern Europe, Atmos. Environ., 42, 1677–1691, 2008b.
Pey, J., P´erez, N., Querol, X., Alastuey, A., Cusack, M., and Reche, C.: Intense winter atmospheric pollution episodes affecting the Western Mediterranean, Sci. Total Environ., 408, 1951–1959, 2010.
Querol, X., Alastuey, A., Rodriguez, S., Plana, F., Ruiz, C. R., Cots, N., Massagu´e, G., and Puig, O.: PM10and PM2.5source appor-tionment in the Barcelona Metropolitan area, Catalonia, Spain, Atmos. Environ., 35, 6407–6419, 2001.
Reche, C., Viana , M., Amato, F., Querol, X., Moreno, T., Min-guill´on, M. C., Alastuey, A., Hillamo, R., Teinil¨a, K., Saarnio, K., Seco, R., and Mohr, C.: Biomass burning contributions to urban aerosols in a coastal Mediterranean city, in preparation, 2012.
Reche, C., Viana, M., Moreno, T., Querol, X., Alastuey, A., Pey, J., Pandolfi, M., Pr´evˆot, A., Mohr, C., Richard, A., Arti˜nano, B., Gomez-Moreno, F. J., and Cots, N.: Peculiarities in atmospheric particle number and size-resolved speciation in an urban area in the western Mediterranean: Results from the DAURE campaign, Atmos. Environ., 45, 5282–5293, 2011.
Rogge, W. F., Hildemann, L. M., Mazurek, M. A., Cass, G. R., and Simonelt, B. R. T.: Sources of fine organic aerosol 1., Char-broilers and meat cooking operations, Environ. Sci. Technol., 25, 1112–1125, 1991.
Sandradewi, J., Pr´evot, A. S. H., Szidat, S., Perron, N., Alfarra, M.ˆ
R., Lanz, V. A., Weingartner, E., and Baltensperger, U.: Using aerosol light absorption measurements for the quantitative deter-mination of wood burning and traffic emission contributions to particulate matter, Environ. Sci. Technol., 42, 3316–3323, 2008. Schauer, J. J., Rogge, W. F., Hildemann, L. M., Mazurek, M. A., and Cass, G. R.: Source apportionment of airborne particulate matter using organic compounds as tracers, Atmos. Environ., 30, 3837–3855, 1996.
Schauer, J. J., Kleeman, M. J., Cass, G. R., and Simoneit, B. R. T.: Measurement of emissions from air pollution sources. 1., C-1 through C-29 organic compounds from meat charbroiling, Envi-ron. Sci. Technol., 33, 1566–1577, 1999.
Schauer, J. J., Kleeman, M. J., Cass, G. R., and Simoneit, B. R. T.: Measurement of emissions from air pollution sources. 4. C1-C27 organic compounds from cooking with seed oils, Environ. Sci. Technol., 36, 567–575, 2001.
1206–1222, doi:10.1080/027868290903916, 2004.
Slowik, J. G., Vlasenko, A., McGuire, M., Evans, G. J., and Abbatt, J. P. D.: Simultaneous factor analysis of organic particle and gas mass spectra: AMS and PTR-MS measurements at an urban site, Atmos. Chem. Phys., 10, 1969–1988, doi:10.5194/acp-10-1969-2010, 2010.
Sueper, D.: ToF-AMS High Resolution Analysis Software – Pika, online available at: http://cires.colorado.edu/jimenez-group/ ToFAMSResources/ToFSoftware/PikaInfo/, 2008.
Sun, Y. L., Zhang, Q., Schwab, J. J., Demerjian, K. L., Chen, W. N., Bae, M. S., Hung, H. M., Hogrefe, O., Frank, B., Ratti-gan, O. V., and Lin, Y. C.: Characterization of the sources and processes of organic and inorganic aerosols in New York city with a high-resolution time-of-flight aerosol mass spectrometer, Atmos. Chem. Phys., 11, 1581–1602, doi:10.5194/acp-11-1581-2011, 2011.
Tsigaridis, K., Krol, M., Dentener, F. J., Balkanski, Y., Lathi`ere, J., Metzger, S., Hauglustaine, D. A., and Kanakidou, M.: Change in global aerosol composition since preindustrial times, At-mos. Chem. Phys., 6, 5143–5162, doi:10.5194/acp-6-5143-2006, 2006.
Ulbrich, I. M., Canagaratna, M. R., Zhang, Q., Worsnop, D. R., and Jimenez, J. L.: Interpretation of organic components from Posi-tive Matrix Factorization of aerosol mass spectrometric data, At-mos. Chem. Phys., 9, 2891–2918, doi:10.5194/acp-9-2891-2009, 2009.
Ulbrich, I. M., Canagaratna, M. R., Cubison, M. J., Zhang, Q., Ng, N. L., Aiken, A. C., and Jimenez, J. L.: Three-dimensional factorization of size-resolved organic aerosol mass spectra from Mexico City, Atmos. Meas. Tech., 5, 195–224, doi:10.5194/amt-5-195-2012, 2012.
Watson, J. G.: Visibility: Science and regulation, J. Air Waste Man-age., 52, 628–713, 2002.
Weimer, S., Alfarra, M. R., Schreiber, D., Mohr, M., Pr´evˆot, A. S. H., and Baltensperger, U.: Organic aerosol mass spectral signatures from wood-burning emissions: Influence of burn-ing conditions and wood type, J. Geophys. Res., 113, D10304, doi:10.1029/2007JD009309, 2008.
Wiedensohler, A., Birmili, W., Nowak, A., Sonntag, A., Weinhold, K., Merkel, M., Wehner, B., Tuch, T., Pfeifer, S., Fiebig, M., Fj¨araa, A. M., Asmi, E., Sellegri, K., Depuy, R., Venzac, H., Vil-lani, P., Laj, P., Aalto, P., Ogren, J. A., Swietlicki, E., Roldin, P., Williams, P., Quincey, P., Hglin, C., Fierz-Schmidhauser, R., Gysel, M., Weingartner, E., Riccobono, F., Santos, S., Gr¨uning, C., Faloon, K., Beddows, D., Harrison, R. M., Monahan, C., Jen-nings, S. G., O’Dowd, C. D., Marinoni, A., Horn, H.-G., Keck, L., Jiang, J., Scheckman, J., McMurry, P. H., Deng, Z., Zhao, C. S., Moerman, M., Henzing, B., and de Leeuw, G.: Particle mo-bility size spectrometers: harmonization of technical standards and data structure to facilitate high quality long-term observa-tions of atmospheric particle number size distribuobserva-tions, Atmos. Meas. Tech. Discuss., 3, 5521–5587, doi:10.5194/amtd-3-5521-2010, 2010.
Zhang, Q., Alfarra, M. R., Worsnop, D. R., Allan, J. D., Coe, H., Canagaratna, M. R., and Jimenez, J. L.: Deconvolutionand quan-tification of hydrocarbon-like and oxygenated organic aerosols based on aerosol mass spectrometry, Environ. Sci. Technol., 39, 4938–4952, 2005a.
Zhang, Q., Worsnop, D. R., Canagaratna, M. R., and Jimenez, J. L.: Hydrocarbon-like and oxygenated organic aerosols in Pitts-burgh: insights into sources and processes of organic aerosols, Atmos. Chem. Phys., 5, 3289–3311, doi:10.5194/acp-5-3289-2005, 2005b.