S
UMMARYProteomic approach has allowed large-scale studies of protein expression in diferent
tis-sues and body luids in discrete conditions and/or time points. Recent advances of
meth-odologies in this ield have opened new opportunities to obtain relevant information on
normal and abnormal processes occurring in the human body. In the current report, the
main proteomics techniques and their application to human disease study are reviewed.
Keywords:
Proteomics; neoplasms; polyacrylamide gel electrophoresis; mass
spectrom-etry; diseases.
©2012 Elsevier Editora Ltda. All rights reserved.
Study conducted at Faculdade de Medicina de São José do Rio Preto (Famerp), São José do Rio Preto, SP, Brazil
Submitted on: 10/11/2011 Approved on: 01/20/2012
Financial Support: FAPESP, CNPq, CAPES
Correspondence to: Eloiza Helena Tajara Av. Brig. Faria Lima, 5416 São José do Rio Preto, SP, Brazil CEP: 15090-000 [email protected]
Conflict of interest: None.
Proteomics: methodologies and applications to the study of human
diseases
E
DUARDOB
UZOLINB
ARBOSA1, A
LESSANDRAV
IDOTTO2, G
IOVANAM
USSIP
OLACHINI2, T
IAGOH
ENRIQUE3,
A
LESSANDRAB
ERNADETET
ROVÓDEM
ARQUI4, E
LOIZAH
ELENAT
AJARA51 Medical Undergraduate Student, Faculdade de Medicina de São José do Rio Preto (Famerp), São José do Rio Preto, SP, Brazil 2 PhD in Health Sciences; Post-doctorate, Famerp, São José do Rio Preto, SP, Brazil
3 MSc in Health Sciences; PhD, Famerp, São José do Rio Preto, SP, Brazil
Sample
Liquid chromatography
Ionization Fragmentation
Mass analysis
Data analysis Detector Peptide
Proteins
Electrophoresis
1D 2D
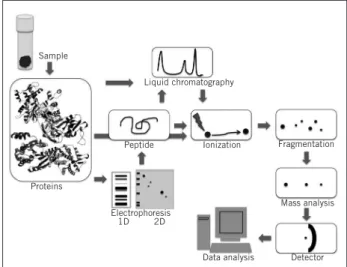
Figure 1 –
Different methodologies can be combined in
proteomic studies. Methodologies more commonly used
involve protein extraction from the sample, separation by
one- (1-D) or two-dimensional (2-D) electrophoresis and/or
liquid chromatography, ionization, fragmentation, peptide
analysis and detection, and data analysis.
I
NTRODUCTIONIn the search for molecular markers that could assist in the
early diagnosis and treatment of several human diseases,
including cancer, many studies have focused on changes in
genes, their transcripts, and protein products involved in
important cellular processes.
Recent methodological approaches allowing a wide
gene expression analysis include cDNA
1microarray
tech-nique, serial analysis of gene expression (SAGE)
2, and
large-scale sequencing techniques using state-of-the-art
equipment
3. he study of gene expression by using these
techniques gives a molecular proile and provides
oppor-tunities to identify important changes occurring at the
RNA level. However, transcript analysis is impaired by a
susceptibility to breakdown and a nonconformity between
the transcript and the protein concentration
4. Moreover,
information on processes modulating protein function
and activity, such as post-translational changes,
protein-protein interactions, transportation, and breakdown are
lost in RNA analysis
5. hus, it is important that, in parallel
to data derived from the genome and clinical data,
infor-mation on protein diferences across normal and altered
tissue and/or body luids are also collected so that the
mechanisms involved in human disease are understood,
with consequent beneit for patients.
To identify and understand the diferences, it is crucial
to know the set of proteins encoded by the genome and
de-ined as the proteome
6. Indeed, the proteome is not only
the sum of products translated from genomic sequences,
but it also includes proteins resulting from
post-transcrip-tional and post-translapost-transcrip-tional processing, as well as
com-plexes formed by these biomolecules
7. In addition to its
great complexity, the proteome is dynamic and its proile
changes according to physiological status and phases of cell
diferentiation. Some estimates suggest that over a million
diferent types of proteins are present in cells, tissues, and
body luids in discrete conditions and/or time points
8. he
term proteomics regards the study of this set of molecules,
that are directly or indirectly responsible for
control-ling all or nearly all biological processes. As well-deined
by Valledor and Jorrin
9, proteomics is the descriptive and
quantitative study of proteins, from those in a subcellular
organelle to those in an ecosystem, as well as their
varia-tions in the population, changes in response to the
environ-ment or resulting from normal or altered developenviron-ment, and
modiications and interactions with other proteins.
M
ETHODOLOGYINPROTEOMICSMany of the techniques employed in proteomics focus
on the identiication of biomarkers, but they are limited
for direct medical applications. Other techniques have a
potential for automation and use in clinical routine with
diagnostic purpose, and allow the analysis of many kinds
of samples and changes in the pattern of protein
expres-sion associated with a disease. Overall, methodologies
employed in proteomics (Figure 1) may be classiied into
bottom-up and top-down types. he former, also termed
shotgun
7, includes liquid chromatographic separation of
peptides derived from tryptic digestion of complex protein
solutions, followed by mass spectrometry (MS) analysis.
he top-down method, in contrast, is a process in which
intact proteins (not peptides) undergo MS analysis.
Bot-tom-up approaches have many advantages, such as
sen-sitivity and reproducibility, even for complex proteomes,
such as cell lysates and serum. However, the responses
obtained are fragments of a whole, and although protein
identiication based on a few peptides is possible,
post-translational modiications are not recognized. In
addi-tion, a peptide may either be lost during chromatography,
or appropriate mass spectra may not be generated. hus,
top-down proteomics has received a great deal of attention
from the scientiic community
10.
Combining these approaches with other processes,
such as subcellular fractionation or protein
immunopre-cipitation, can be quite efective to enrich a sample with
low-abundance compounds or cell organelles of interest
11.
Fresh samples constitute the irst choice in these studies,
but as they are diicult to obtain, particularly in rare
dis-eases, some methods have been developed for parain
em-bedded specimens
12.
P
ROTEINSEPARATIONBYONE-
ANDTWO-
DIMENSIONALELECTROPHORESIS
luids. Appropriate protein extraction is crucial to obtain
good electrophoretic results. As a function of the various
types and sources of biological samples, the extraction
procedure needs individual optimization. In most cases,
proteins need to be solubilized, disaggregated, denatured,
and treated with disulide bond reducing agents
13.
In typical 2-D electrophoresis, proteins are separated
in two consecutive steps. At the irst step, termed
iso-electric focusing (IEF), molecules migrate in a
polyacryl-amide gel with an immobilized
14or amphoteric
bufer-generated
15pH gradient until they reach a point (pH) in
which their charge equals zero (isoelectric point – IP).
At the second step, proteins undergo an
electropho-resis whose direction is perpendicular to IEF in
poly-acrylamide gel containing sodium dodecyl sulfate
(SDS-PAGE), being separated according to their
mo-lecular mass. his second step is similar to a 1-D
elec-trophoresis, in which molecules are directly applied to
SDS-PAGE and separated according to their size.
In order to make protein bands or spots visible (1-D
and 2-D, respectively), gels are stained by Coomassie
blue, silver nitrate, or other commercially available dyes.
In 2-D gels, 100 to 2,000 spots can be visualized, each
one of them containing one to several proteins, and some
post-translational changes are easily detected as
vertical-ly or horizontalvertical-ly aligned trains of spots. Ater gel image
digitalization and use of computer tools, the background
material is extracted, the spots are compared, and the
data are normalized and statistically analyzed for protein
volume or intensity quantiication
16. A simpler protocol is
used for 1-D gels, whose bands of interest or full runs are
sliced and analyzed
17. Proteins found in these slices or in
2-D gel spots are digested into peptides by trypsin, with
cleavage being made ater arginine or lysine residues.
Many modiications have already been made in
the 2-D original protocol. One of the most recent and
popular is based on labelling cyanine luorescent dyes
reacting with lysine or cysteine residues. his labeling
gave rise to a technique, the Fluorescent 2-D Diferential
In-Gel Electrophoresis (2-D DIGE)
18, allowing for the
analysis of two protein samples marked with diferent
luorochromes in the same gel, thus reducing inter-gel
variation and improving the eiciency and accuracy of
the method.
Although 1-D and 2-D electrophoresis techniques can
generate much information, they have limitations. One
of the most important limitations is the presence of some
proteins in elevated concentrations, especially in certain
body luids, which makes electrophoretic migration of
less abundant proteins more diicult. Another limitation
is that the extraction of intact proteins from the gel for
top-down analysis is diicult, but some attempts to
cir-cumvent this problem have been made
10.
P
EPTIDEFRACTIONATIONBYLIQUIDCHROMATOGRAPHYANDIDENTIFICATIONBYMASSSPECTROMETRY
Several types of chromatography are used to reduce the
sample complexity or to complement protein and peptide
separation by electrophoresis. In liquid chromatography
(LC), the analyte is dissolved in a liquid phase without
chemically interacting with it, and percolates a stationary
phase usually packed into one
19or several columns with
diferent stationary phases, such as in Multi-dimensional
Protein Identiication Technology (MudPIT)
20,21.
Although the analytes are characterized by molecular
mass (and IP in 2-D) and puriied or fractionated by
chro-matography, they need to be identiied; this is performed
by mass spectrometry
22. he technique basically consists of
ionizing a compound and evaluating the ion mass/charge
(m/z) ratio. he equipment comprises a ionization source,
one or two mass analyzers and a detector. he irst
com-ponent is used to generate peptide or protein ions, usually
transferring protons (H
+) to the molecules without
modi-fying their chemical structure. he ion is accelerated by
an electric ield and separated by m/z in a mass analyzer,
or it is selected according to a previously determined m/z,
being fragmented in a tandem process (MS2 or MS/MS).
Finally, the ions pass through the detector, which is
con-nected to a computer with data analysis sotware
19.
I
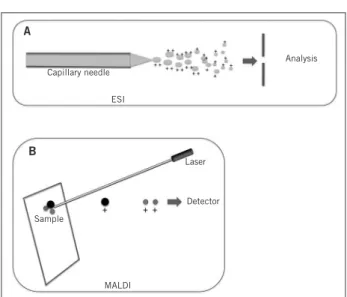
ONIZATIONMETHODSCurrently, two main ionization methods are available
and used in proteomics, Matrix-Assisted Laser
Desorp-tion/Ionization (MALDI) and Electrospray Ionization
(ESI), with the former being employed for solid state
samples and the latter for liquid state samples (Figure 2).
In MALDI, peptides are co-crystallized with an organic
matrix, usually alpha-cyano-4-hydroxycinnamic acid.
Ater laser bombardment, the matrix sublimates and its
ions transfer the charge to analytes, resulting in peptide
ion formation
23. One MALDI variant termed
Surface-En-hanced Laser Desorption/Ionization (SELDI) is usually
employed to analyze a low-molecular-weight proteome
and uses several matrices or chips that explore the
chro-matographic and biophysical characteristics of diferent
proteins. hese chips can exhibit hydrophobic surfaces;
ion exchange surfaces or surfaces with immobilized
me-tallic ions; or even antibodies, receptors, enzymes, and
ligands with high ainity for speciic proteins
24. hus,
Figure 2 –
Ionization methods. (
A
) ESI method: an
aqueous solution containing the analyte is forced through
a capillary needle and ejected as a spray with highly
charged droplets, which generate analyte ionized forms
after solvent evaporation. (
B
) MALDI method: peptides are
co-crystallized in an organic matrix and ionized after laser
bombardment.
In contrast with MALDI, in ESI an aqueous solution
with the analyte is forced to pass through a capillary
nee-dle undergoing high voltage. he solution is ejected as a
spray with highly charged droplets that generate analyte
ionized forms ater the solvent is evaporated by a heated
inert gas low
26.
T
YPESOFANALYZERSRegardless of the ionization method, the ion molecular
mass is assessed in an analyzer ater passing through a
vacuum chamber. he most common analyzers are Time
Of Flight (TOF), quadrupole (Q), and ion trap (IT)
19.
In TOF analyzers, the ions resulting from the irst step
are accelerated by a potential between two electrodes and
pass through a vacuum tube at a speed that is inversely
related to their mass. When the ions reach the detector,
the time elapsed from the ionization up to the detection is
used to derive the m/z value. In fact, the detector converts
the signal of the ion passage into an analog signal, which is
read and interpreted by a workstation. he inal result is a
plot of m/z versus intensity (ion count), usually referred to
as MS spectrum
27. he generated signals are compared with
information available in databases, such as MASCOT
28and SEQUEST
29, to identify the protein of interest.
One of the limitations of the MALDI-TOF system is
that the detection of low-molecular-weight proteins is
dif-icult, as they generate few peptides. he system is also
not able to detect more than one component in a mixture.
TOF analyzers may be combined with Q analyzers, which
have a set of four-rod electrodes and work as mass ilters
so that their performance can be improved. Between these
electrodes, an electric ield ensures that only ions with a
certain m/z ratio travel to the detector, while the others
are delected
30.
he IT analyzers ilter and entrap ions of interest in
a tridimensional electric ield and these are gradually
re-leased in an m/z ascending order
31. Fourier Transform
Ion Cyclotron Resonances (FT-ICRs) are ion traps with
an additional magnetic ield forcing ions to exhibit a
cir-cular movement with high frequency cycles. he analyzer
determines the m/z ratio from the cyclotronic movement
frequency by using the Fourier transform
19. Orbitrap is
an-other type of IT analyzer wherein ions oscillate along and
around a single spiral electrode. his oscillation frequency
is directly related to the square root of the m/z ratio and
can be determined with high accuracy
32,33. his technology
has migrated towards hybrid systems with two
indepen-dent mass spectrometers that combine, for example, an ion
trap and an orbitrap, or an ion trap and a FT-ICR.
P
ROTEINIDENTIFICATIONAter determining the m/z ratio of the intact peptide, its
sequencing can be performed through a second MS event,
as described above: more abundant peptides are
specii-cally selected and undergo fragmentation by collision with
an inert gas (collision-induced dissociation – CID) or by
electron transference (ETD); the latter is advantageous
for preserving protein post-translational modiications in
top-down analysis. he parental peptide fragmentation
occurs predominantly along its skeleton, usually between
the carbonyl oxygen and the amide nitrogen, thus
generat-ing two ion groups termed y and b. he resultgenerat-ing MS/MS
spectrum is, in fact, a list of m/z ratios for distinct
frag-ments whose mass diferences correspond to single amino
acids. Evaluating these size-ascending fragments from the
N-terminus (b ion series) or the C-terminus (y ion series)
allows for deducing the peptide sequence. With the results
for several peptides, the protein can be identiied
33.
Q
UANTITATIVEMETHODSIn recent years, several methods of absolute and relative
protein quantiication in samples assessed by MS have
been developed. Originally, the only available platform
was 2-D gel, a technology that allows for the assessment of
hundreds or thousands of protein spots, despite its
limita-tions
9. More recently, some methods use protein or peptide
labeling by isotopes or other reactants identiiable by MS,
such as linkers with heavy isotopes in Isotope-coded
Af-inity Tag (ICAT)
34, Isobaric Tags in Isobaric Tags for
Rela-tive and Absolute Quantiication (iTRAQ)
35and in vivo
labelling of proteins with amino acids containing
nonra-dioactive isotopes in Stable Isotope Labeling with Amino
acids in Cell Culture (SILAC)
36. In short, two samples to
be compared are covalently modiied by isotopes (e.g.,
1H
Capillary needleAnalysis
ESI
A
Detector
Sample
MALDI
Laser
versus
2H,
12C versus
13C) and diferences in protein
quan-tities are determined by the intensity ratio of diferentially
labeled peptides.
Labeling-free quantiication methods have also been
developed thanks to technological advances in liquid
chromatography and mass spectrometry systems, as well
as in bioinformatics tools for data interpretation
37. As an
example, the intensity of peaks of mass spectra generated
by peptide ions is correlated with abundant protein. he
same is observed regarding the count of MS/MS spectra,
as Old et al.
38noted.
A
PPLICATIONSINTHESTUDYOFHUMANDISEASESAlthough the proteome fraction possibly identiiable by
us-ing the approaches described above has been growus-ing, the
analysis is still incomplete even in simpler cells, especially
for low-abundance (such as receptors, signal transducers,
and regulators), basic, and hydrophobic proteins, as well
as membrane proteins or those with molecular mass above
150 kDa or below 10 kDa
39. his picture is supposed to
change because methodologies and technologies in this
ield have had great advances over the last years and have
reached high levels of resolution and application potential.
As expressed by Walsh et al.
40, proteomics has moved from
the question “what?” towards questions involving “when,
where, how, and how much”.
However, what are the beneits of proteomic studies for
human disease management? he literature on this
sub-ject is extensive, and many relevant data have already been
obtained, including the characterization, albeit partial, of
proteins in diferent tissues and conditions, and of
subpro-teomes, such as phosphoproteomes
41and glycoproteomes
42.
However, speciic and sensitive biomarkers are not
easily identiied through proteomic approaches. his is
re-vealed, for example, by data obtained from head and neck,
breast, colon, and ovarian cancers
43-45; although they are
diferent conditions, they show similar changes. Only one
screening test (OVA1) developed with the SELDI-TOF
methodology for ovarian cancer has been approved
46,47.
Tissues afected by most human diseases are not easily
accessible for analysis and they will be unlikely to be used in
routine analysis. One of the main limitations is cell
hetero-geneity, possibly leading to inaccurate results if a thorough
histopathological study is not performed. Laser
microdis-section overcomes this problem, but it generates a reduced
number of cells and introduces extra sample handling. In
contrast, body luids have characteristics that surpass these
limitations and are appropriate for developing low- or
less-invasive diagnostic and prognostic tools. Moreover, they
are especially appropriate when longitudinal monitoring is
required
32. Prostate speciic antigen (PSA) in prostate
can-cer, and tyrosine kinase receptor CD340 in breast cancer
are good examples that proteins released into the blood
by diseased tissues can be illness indicators when the
con-centration is altered
48. However, there are many technical
challenges in the use of these biological materials, with the
most important being the complexity, the dynamic
charac-teristic of the protein composition, and the need to analyze
a great number of patients to determine intra- and
inter-individual variability for a potential marker. In addition,
one marker alone would hardly have enough sensitivity
and speciicity for prediction or diagnosis for developing
clinical tests; protein panels associated with speciic
condi-tions will likely be required.
Several organ-speciic body luids have already been
characterized aiming at clinical use, such as urine for
Anderson-Fabry disease
49; cerebrospinal luid for multiple
sclerosis
50and amyotrophic lateral sclerosis
51, Alzheimer
disease
52, Creutzfeldt-Jakob disease
53, and Parkinson
dis-ease
54; bronchioalveolar lavage for chronic obstructive
pul-monary disease
55; synovial luid for osteoarthritis
56; tears
for keratoconus
57; and nipple aspirate for breast cancer
58.
B
ODYFLUIDS:
SALIVASaliva is a biological material well studied by proteomic
approaches. Comprising a mixture of components
secret-ed by salivary glands and derivsecret-ed from the blood, it is
like-ly the most accessible luid in our body
59. It plays an
im-portant role in supporting oral health by participating in
processes such as dental enamel remineralization, defense
against microorganisms, lubrication, digestion, and pH
and taste modulation
59-62. hese attributes result from the
component characteristics, including proteins, hormones,
small molecules (such as urea), and electrolytes (such as
calcium, bicarbonate, phosphate, and luoride)
59. Salivary
proteins have been studied by traditional and proteomic
biochemical techniques, and hundreds have already been
identiied both in total saliva and in individual gland
se-cretion, although those expressed in low levels certainly
have not yet been detected
57,63-89.
he great interest in saliva as a luid for diagnosis has
led to a standardization of collection and storage
process-es
90mainly because several factors afect saliva low and
composition. Among these factors, physiological status,
drugs, foods, odors, circadian rhythm, gender, age, blood
composition, and degree of salivary gland activity
91,92are
noticed. hus, low parameters and salivary composition
have been explored in monitoring hormone
93and drug
94levels, exposition to environmental pollutants
95and
in-fectious agents
96, and disease monitoring, including
peri-odontitis
97, diabetes mellitus
98, cystic ibrosis
99, Sjögren
syndrome
100, salivary gland diseases
101, and breast
102,103,
ovarian
104, and oral
105,106cancer. Regarding oral cancer, the
Figure 3 –
Gels resulting from 2-D serum protein
electrophoresis from patients with neurofibromatosis. (
A
)
Without and (
B
) with depletion of more abundant proteins.
in contact with the afected tissue, thus receiving proteins
secreted or derived from dead cells, its potential use ranges
from early detection
107to aggressiveness prediction and
prognostics
108.
Although many studies have identiied salivary
bio-markers in local and systemic diseases, their validation
in large sample groups is not available, and data from
diferent authors on the same disease show conlicting
results
109. Nevertheless, a number of interesting
associa-tions have been reported. For example, elevated
transfer-rin levels were observed in patients with oral carcinoma,
correlated with tumor size and stage. Assays for ELISA
were highly speciic and sensitive for early detection of
this carcinoma, which makes transferrin a promising
marker
110. his protein is essential for cells with a high
proliferation level, and is involved in DNA synthesis and
transduction paths of mitogenic signals
111.
Regarding the potential of therapy response
predic-tion, recently Vidotto et al.
112observed that the levels of
some salivary proteins in patients with head and neck
carcinoma revert to a pattern similar to that observed in
healthy individuals ater treatment. Among these proteins,
two of them (PLUNC and ZN-alpha-2-GP) are related to
inlammation, which is frequently found in these tumors.
B
ODY FLUIDS:
SERUM/
PLASMAAlthough saliva and other body luids allow for obtaining
relevant data for proteomic analysis, mainly in diseases
afecting speciic tissues and organs, no question remains
that serum and plasma are much more comprehensive.
hese blood fractions are among the most important
sources of biological markers and can provide rich
infor-mation about physiological and pathological processes
113.
heir analysis for diagnostic purpose is well known, and
both fractions are similar in composition. However,
plas-ma appears to be more stable and more appropriate than
serum to assess low-molecular-weight proteins. On the
other hand, serum is the material of choice for several
tests because plasma anticoagulants interfere with some
methods employed
44.
Only 22 proteins, such as albumin, transferrin,
hap-toglobin, immunoglobulins, and lipoproteins make over
95% of serum/plasma proteome. Many cell proteins, in
contrast, enter circulation in very reduced levels
114. As an
example, albumin is found in blood in a millimolar (10
-3mol) concentration, while other proteins, such as
cyto-kines, have an activity in concentrations between 10
-12mol and 10
-9mol
115. his smaller group certainly includes
disease biomarkers
116whose detection unfortunately may
be interfered with by very abundant proteins. In a review
by Kawashima et al.
117, various depletion methods are
used; however, they oten result in the removal of
low-molecular-weight proteins (Figure 3).
Schiess et al.
48, by comparing known markers with
pro-teins identiied by proteomic approaches, observed
plas-matic concentrations with very diferent orders of
magni-tude. While levels of markers such as PSA and CD340 are
in the range of pg to ng/mL, the levels of classic plasma
proteins are in the order of µg to mg/mL. hese data show
the need for advances in technology so that detection limits
reach lower concentration levels
114. Recently, measurements
by Selected Reaction Monitoring (SRM) in mass
spectrom-etry have been used to overcome these diiculties, as they
focus on
a priori
selected protein sets which have generated
very consistent data
118,119, especially when abundant
com-ponent depletion and fractionation are combined
120.
Despite these limitations, many data have already been
obtained from the serum/plasma of patients with
diabe-tes
121,122; autoimmune diseases
123; heart
124and infectious
125diseases; Parkinson
126and Alzheimer
52diseases;
endome-triosis
127; bladder
128, head and neck
129-132, colon
133,134,
esoph-agus
135, stomach
136, liver
137,138, breast
139,140, pancreas
141,142,
prostate
143,144, lung
145,146, and kidney
147-149tumors; and also
pregnant women with fetuses with Down syndrome
150.
Although the number of publications is high, only one
screening test developed from proteomic approaches has
been approved (OVA1). he test analyzes a protein panel
(CA125, transthyretin or prealbumin, apolipoprotein A1,
beta-2-microglobulin, and transferrin) and, when
com-bined with clinical and imaging evaluation, presents a
sensitivity higher than 90% for pre-surgical assessment of
ovarian cancer risk
46,47.
F
INAL CONSIDERATIONSMany factors afect the results of proteomic analysis,
es-pecially regarding body luids. Patient and environmental
characteristics are among these factors
44,151. In the
pre-ana-lytical stage, material processing introduces other variables,
such as collection method, type of storage, and initial
sam-ple treatments. Likewise, proteolytic breakdown products
generated in the analytical stage inluence the results if
ef-fective protease inhibitors are not used. Breakdown by
ca-tabolism is equally important
152, although
low-molecular-weight fragments are not always nonspeciic, such as those
derived from transthyretin
153and osteopontin
154.
97 kD 66 kD
45 kD
30 kD
20,1 kD
14,4 kD
he clinical aspect of proteomic studies has also faced
a few challenges. One of them is prospective analysis of
representative and well-characterized populations to
ac-quire statistical power and surpass the limitations
result-ing from individual variability and biological material
processing.
Despite these challenges, there is no doubt that the
results of proteomic approaches are potentially useful in
several clinical research areas, such as diagnosis, therapy
response monitoring, endpoint prediction, disease
sub-type classiication, risk determination, characterization
of metabolic pathways, biomarker quantiication, and
therapeutic target generation
40.
In recent years, many important biological questions
have been answered by proteomics and hundreds of
can-didate biomarkers have been introduced. However, few
markers have surpassed the identiication stage. heir
successful application to clinical practice will depend on
sensitive platforms; development of protein panels; and
collaborative studies including physicians,
epidemiolo-gists, molecular bioloepidemiolo-gists, and bioinformaticians with a
relevant clinical issue and well-deined recruitment and
characterization parameters for patients and samples.
A
CKNOWLEDGEMENTShe authors acknowledge the Fundação de Amparo à
Pesquisa do Estado de São Paulo/FAPESP, the Conselho
Nacional de Desenvolvimento Cientíico e Tecnológico/
CNPq, and the Coordenação de Aperfeiçoamento de
Pessoal de Nível Superior/CAPES for the research grants.
he authors are grateful to the GENCAPO (Head and
Neck Genome Project) team for the valuable discussions
that motivated the current review.
R
EFERENCES1. DeRisi J, Penland L, Brown PO, Bittner ML, Meltzer PS, Ray M, et al. Use of a cDNA microarray to analyze gene expression patterns in human cancer. Nat Genet. 1996;14(4):457-60.
2. Velculescu VE, Zhang L, Vogelstein B, Kinzler KW. Serial analysis of gene ex-pression. Science. 1995;270(5235):484-7.
3. Fullwood MJ, Wei CL, Liu ET, Ruan Y. Next-generation DNA sequencing of paired-end tags (PET) for transcriptome and genome analyses. Genome Res. 2009;19(4):521-32.
4. Gygi SP, Rochon Y, Franza BR, Aebersold R. Correlation between protein and mRNA abundance in yeast. Mol Cell Biol. 1999;19(3):1720-30.
5. Gstaiger M, Aebersold R. Applying mass spectrometry-based proteomics to genetics, genomics and network biology. Nat Rev Genet. 2009;10(9):617-27. 6. Wilkins MR, Sanchez JC, Gooley AA, Appel RD, Humphery-Smith I,
Hoch-strasser DF, et al. Progress with proteome projects: why all proteins expressed by a genome should be identiied and how to do it. Biotechnol Genet Eng Rev. 1996;13:19-50.
7. Ahrens CH, Brunner E, Qeli E, Basler K, Aebersold R. Generating and navigating proteome maps using mass spectrometry. Nat Rev Mol Cell Biol. 2010;11(11):789-801.
8. Jensen ON. Modiication-speciic proteomics: characterization of post-translational modiications by mass spectrometry. Curr Opin Chem Biol. 2004;8(1):33-41.
9. Valledor L, Jorrin J. Back to the basics: maximizing the information obtained by quantitative two dimensional gel electrophoresis analyses by an appropriate experimental design and statistical analyses. J Proteomics. 2011;74(1):1-18. 10. Armirotti A, Damonte G. Achievements and perspectives of top-down
pro-teomics. Propro-teomics. 2010;10(20):3566-76.
11. Kosako H, Nagano K. Quantitative phosphoproteomics strategies for under-standing protein kinase-mediated signal transduction pathways. Expert Rev Proteomics. 2011;8(1):81-94.
12. Nirmalan NJ, Hughes C, Peng J, McKenna T, Langridge J, Cairns DA, et al. Initial development and validation of a novel extraction method for quanti-tative mining of the formalin-ixed, parain-embedded tissue proteome for biomarker investigations. J Proteome Res. 2011;10(2):896-906.
13. de Marqui AB, Vidotto A, Polachini GM, Bellato CM, Cabral H, Leopoldino AM, et al. Solubilization of proteins from human lymph node tissue and two-dimensional gel storage. J Biochem Mol Biol. 2006;39(2):216-22.
14. Bjellqvist B, Ek K, Righetti PG, Gianazza E, Gorg A, Westermeier R, et al. Iso-electric focusing in immobilized pH gradients: principle, methodology and some applications. J Biochem Biophys Methods. 1982;6(4):317-39.
15. OFarrell PH. High resolution two-dimensional electrophoresis of proteins. J Biol Chem. 1975;250(10):4007-21.
16. Dowsey AW, Dunn MJ, Yang GZ. he role of bioinformatics in two-dimen-sional gel electrophoresis. Proteomics. 2003;3(8):1567-96.
17. Rezaul K, Wu L, Mayya V, Hwang SI, Han D. A systematic characterization of mitochondrial proteome from human T leukemia cells. Mol Cell Proteomics. 2005;4(2):169-81.
18. Unlu M, Morgan ME, Minden JS. Diference gel electrophoresis: a single gel method for detecting changes in protein extracts. Electrophoresis. 1997;18(11):2071-7.
19. May C, Brosseron F, Chartowski P, Schumbrutzki C, Schoenebeck B, Marcus K. Instruments and methods in proteomics. Methods Mol Biol. 2011;696:3-26. 20. Schirmer EC, Yates JR, 3rd, Gerace L. MudPIT: A powerful proteomics tool for
discovery. Discov Med. 2003;3(18):38-9.
21. Washburn MP, Wolters D, Yates JR, 3rd. Large-scale analysis of the yeast pro-teome by multidimensional protein identiication technology. Nat Biotech-nol. 2001;19(3):242-7.
22. Chen CH. Review of a current role of mass spectrometry for proteome re-search. Anal Chim Acta. 2008;624(1):16-36.
23. Zaluzec EJ, Gage DA, Watson JT. Matrix-assisted laser desorption ionization mass spectrometry: applications in peptide and protein characterization. Protein Expr Purif. 1995;6(2):109-23.
24. Tang N, Tornatore P, Weinberger SR. Current developments in SELDI ain-ity technology. Mass Spectrom Rev. 2004;23(1):34-44.
25. Gustafsson JO, Oehler MK, Ruszkiewicz A, McColl SR, Hofmann P. MALDI imaging mass spectrometry (MALDI-IMS) - application of spatial proteomics for ovarian cancer classiication and diagnosis. Int J Mol Sci. 2011;12(1):773-94.
26. Nguyen S, Fenn JB. Gas-phase ions of solute species from charged droplets of solutions. Proc Natl Acad Sci USA. 2007;104(4):1111-7.
27. Wollnik H. TOF-MS. Mass Spectrom Rev. 1993;12(1):89-114.
28. Perkins DN, Pappin DJ, Creasy DM, Cottrell JS. Probability-based protein identiication by searching sequence databases using mass spectrometry data. Electrophoresis. 1999;20(18):3551-67.
29. Eng JK, McCormack AL, Yates JRI. An approach to correlate tandem mass spectral data of peptides with amino acid sequences in a protein database. Am Soc Mass Spectrom. 1994;5(976-989).
30. Chernushevich IV, Loboda AV, homson BA. An introduction to quadru-pole-time-of-light mass spectrometry. J Mass Spectrom. 2001;36(8):849-65. 31. Wang Y, Franzen J, Wanczek KP. he non-linear resonance ion trap. Part
2. A general theoretical analysis. Int J Mass Spectrom Ion Processes. 1993;124(1):125-44.
32. Hu Q, Noll RJ, Li H, Makarov A, Hardman M, Graham Cooks R. he Orbi-trap: a new mass spectrometer. J Mass Spectrom. 2005;40(4):430-43. 33. Walther TC, Mann M. Mass spectrometry-based proteomics in cell biology.
J Cell Biol. 2010;190(4):491-500.
34. Gygi SP, Rist B, Gerber SA, Turecek F, Gelb MH, Aebersold R. Quantitative analysis of complex protein mixtures using isotope-coded ainity tags. Nat Biotechnol. 1999;17(10):994-9.
35. hompson A, Schafer J, Kuhn K, Kienle S, Schwarz J, Schmidt G, et al. Tan-dem mass tags: a novel quantiication strategy for comparative analysis of complex protein mixtures by MS/MS. Anal Chem. 2003;75(8):1895-904. 36. Ong SE, Blagoev B, Kratchmarova I, Kristensen DB, Steen H, Pandey A, et
al. Stable isotope labeling by amino acids in cell culture, SILAC, as a sim-ple and accurate approach to expression proteomics. Mol Cell Proteomics. 2002;1(5):376-86.
37. Piersma SR, Fiedler U, Span S, Lingnau A, Pham TV, Hofmann S, et al. Worklow comparison for label-free, quantitative secretome proteomics for cancer biomarker discovery: method evaluation, diferential analysis, and veriication in serum. J Proteome Res. 2010;9(4):1913-22.
38. Old WM, Meyer-Arendt K, Aveline-Wolf L, Pierce KG, Mendoza A, Sevinsky JR, et al. Comparison of label-free methods for quantifying human proteins by shotgun proteomics. Mol Cell Proteomics. 2005;4(10):1487-502. 39. Fey SJ, Larsen PM. 2D or not 2D. Two-dimensional gel electrophoresis. Curr
Opin Chem Biol. 2001;5(1):26-33.
41. Sudhir PR, Hsu CL, Wang MJ, Wang YT, Chen YJ, Sung TY, et al. Phospho-proteomics identiies oncogenic Ras signaling targets and their involvement in lung adenocarcinomas. PLoS One. 2011;6(5):e20199.
42. Zeng X, Hood BL, Sun M, Conrads TP, Day RS, Weissfeld JL, et al. Lung cancer serum biomarker discovery using glycoprotein capture and liquid chromatography mass spectrometry. J Proteome Res. 2010;9(12):6440-9. 43. Matta A, Ralhan R, DeSouza LV, Siu KW. Mass spectrometry-based clinical
proteomics: head-and-neck cancer biomarkers and drug-targets discovery. Mass Spectrom Rev. 2010;29(6):945-61.
44. Huijbers A, Velstra B, Dekker TJ, Mesker WE, van der Burgt YE, Mertens BJ, et al. Proteomic serum biomarkers and their potential application in cancer screening programs. Int J Mol Sci. 2010;11(11):4175-93.
45. Findeisen P, Neumaier M. Mass spectrometry based proteomics proiling as diagnostic tool in oncology: current status and future perspective. Clin Chem Lab Med. 2009;47(6):666-84.
46. Fung ET. A recipe for proteomics diagnostic test development: the OVA1 test, from biomarker discovery to FDA clearance. Clin Chem. 2010;56(2):327-9. 47. Zhang Z, Chan DW. he road from discovery to clinical diagnostics:
les-sons learned from the irst FDA-cleared in vitro diagnostic multivariate index assay of proteomic biomarkers. Cancer Epidemiol Biomarkers Prev. 2010;19(12):2995-9.
48. Schiess R, Wollscheid B, Aebersold R. Targeted proteomic strategy for clini-cal biomarker discovery. Mol Oncol. 2009;3(1):33-44.
49. Vojtova L, Zima T, Tesar V, Michalova J, Prikryl P, Dostalova G, et al. Study of urinary proteomes in Anderson-Fabry disease. Ren Fail. 2010;32(10):1202-9. 50. Ottervald J, Franzen B, Nilsson K, Andersson LI, Khademi M, Eriksson B,
et al. Multiple sclerosis: Identiication and clinical evaluation of novel CSF biomarkers. J Proteomics. 2010;73(6):1117-32.
51. Zhou JY, Ajehi-Sadat L, Asress S, Duong DM, Cudkowicz M, Glass JD, et al. Galectin-3 is a candidate biomarker for amyotrophic lateral sclerosis: discov-ery by a proteomics approach. J Proteome Res. 2010;9(10):5133-41. 52. Blennow K, Hampel H, Weiner M, Zetterberg H. Cerebrospinal luid and
plasma biomarkers in Alzheimer disease. Nat Rev Neurol. 2010;6(3):131-44. 53. Steinacker P, Rist W, Swiatek-de-Lange M, Lehnert S, Jesse S, Pabst A, et al.
Ubiquitin as potential cerebrospinal luid marker of Creutzfeldt-Jakob dis-ease. Proteomics. 2010;10(1):81-9.
54. van Dijk KD, Teunissen CE, Drukarch B, Jimenez CR, Groenewegen HJ, Berendse HW, et al. Diagnostic cerebrospinal luid biomarkers for Parkinsons disease: a pathogenetically based approach. Neurobiol Dis. 2010;39(3):229-41.
55. Merkel D, Rist W, Seither P, Weith A, Lenter MC. Proteomic study of human bronchoalveolar lavage luids from smokers with chronic obstructive pulmo-nary disease by combining surface-enhanced laser desorption/ionization-mass spectrometry proiling with desorption/ionization-mass spectrometric protein identiication. Proteomics. 2005;5(11):2972-80.
56. Gobezie R, Kho A, Krastins B, Sarracino DA, hornhill TS, Chase M, et al. High abundance synovial luid proteome: distinct proiles in health and os-teoarthritis. Arthritis Res her. 2007;9(2):R36.
57. Lema I, Brea D, Rodriguez-Gonzalez R, Diez-Feijoo E, Sobrino T. Pro-teomic analysis of the tear ilm in patients with keratoconus. Mol Vis 2010;16:2055-61.
58. Pawlik TM, Fritsche H, Coombes KR, Xiao L, Krishnamurthy S, Hunt KK, et al. Signiicant diferences in nipple aspirate luid protein expression between healthy women and those with breast cancer demonstrated by time-of-light mass spectrometry. Breast Cancer Res Treat. 2005;89(2):149-57.
59. Dawes C. Salivary low patterns and the health of hard and sot oral tissues. J Am Dent Assoc. 2008;139(Suppl):18S-24S.
60. Amaechi BT, Higham SM. In vitro remineralization of eroded enamel lesions by saliva. J Dent. 2001;29(5):371-6.
61. Tabak LA. In defense of the oral cavity: the protective role of the salivary secretions. Pediatr Dent. 2006;28(2):110-7; discussion 92-8.
62. Suh KI, Lee JY, Chung JW, Kim YK, Kho HS. Relationship between salivary low rate and clinical symptoms and behaviours in patients with dry mouth. J Oral Rehabil. 2007;34(10):739-44.
63. Musumeci V, Cherubini P, Zuppi C, Zappacosta B, Ghirlanda G, Di Salvo S. Aminotransferases and lactate dehydrogenase in saliva of diabetic patients. J Oral Pathol Med. 1993;22(2):73-6.
64. Hirtz C, Chevalier F, Centeno D, Egea JC, Rossignol M, Sommerer N, et al. Complexity of the human whole saliva proteome. J Physiol Biochem. 2005;61(3):469-80.
65. Beeley JA, Sweeney D, Lindsay JC, Buchanan ML, Sarna L, Khoo KS. Sodium dodecyl sulphate-polyacrylamide gel electrophoresis of human parotid sali-vary proteins. Electrophoresis. 1991;12(12):1032-41.
66. Beeley JA, Khoo KS. Salivary proteins in rheumatoid arthritis and Sjogrens syndrome: one-dimensional and two-dimensional electrophoretic studies. Electrophoresis. 1999;20(7):1652-60.
67. Denny P, Hagen FK, Hardt M, Liao L, Yan W, Arellanno M, et al. he pro-teomes of human parotid and submandibular/sublingual gland salivas col-lected as the ductal secretions. J Proteome Res. 2008;7(5):1994-2006. 68. Fábián TK, Gáspár J, Fejérdy L, Kaán B, Bálint M, Csermely P, et al. HSP-70
is present in human saliva. Med Sci Monit. 2003;9(1):62-5.
69. Fang X, Yang L, Wang W, Song T, Lee CS, DeVoe DL, et al. Comparison of electrokinetics-based multidimensional separations coupled with electrospray ionization-tandem mass spectrometry for characterization of human salivary proteins. Anal Chem. 2007;79(15):5785-92.
70. Ghafouri B, Tagesson C, Lindahl M. Mapping of proteins in human saliva us-ing two-dimensional gel electrophoresis and peptide mass us-ingerprintus-ing. Pro-teomics. 2003;3(6):1003-15.
71. Guo T, Rudnick PA, Wang W, Lee CS, Devoe DL, Balgley BM. Characteriza-tion of the human salivary proteome by capillary isoelectric focusing/nanorev-ersed-phase liquid chromatography coupled with ESI-tandem MS. J Proteome Res. 2006;5(6):1469-78.
72. Hardt M, homas LR, Dixon SE, Newport G, Agabian N, Prakobphol A, et al. Toward deining the human parotid gland salivary proteome and pepti-dome: identiication and characterization using 2D SDS-PAGE, ultrailtration, HPLC, and mass spectrometry. Biochemistry. 2005;44(8):2885-99.
73. Hu S, Yu T, Xie Y, Yang Y, Li Y, Zhou X, et al. Discovery of oral luid biomarkers for human oral cancer by mass spectrometry. Cancer Genomics Proteomics. 2007;4(2):55-64.
74. Hu S, Arellano M, Boontheung P, Wang J, Zhou H, Jiang J, et al. Sali-vary proteomics for oral cancer biomarker discovery. Clin Cancer Res. 2008;14(19):6246-52.
75. Hu S, Denny P, Xie Y, Loo JA, Wolinsky LE, Li Y, et al. Diferentially expressed protein markers in human submandibular and sublingual secretions. Int J On-col. 2004;25(5):1423-30.
76. Hu S, Xie Y, Ramachandran P, Ogorzalek Loo RR, Li Y, Loo JA, et al. Large-scale identiication of proteins in human salivary proteome by liquid chroma-tography/mass spectrometry and two-dimensional gel electrophoresis-mass spectrometry. Proteomics. 2005;5(6):1714-28.
77. Huang CM. Comparative proteomic analysis of human whole saliva. Arch Oral Biol. 2004;49(12):951-62.
78. Messana I, Cabras T, Inzitari R, Lupi A, Zuppi C, Olmi C, et al. Characteriza-tion of the human salivary basic proline-rich protein complex by a proteomic approach. J Proteome Res. 2004;3(4):792-800.
79. Papale M, Pedicillo MC, Di Paolo S, hatcher BJ, Lo Muzio L, Bufo P, et al. Saliva analysis by surface-enhanced laser desorption/ionization time-of-light mass spectrometry (SELDI-TOF/MS): from sample collection to data analysis. Clin Chem Lab Med. 2008;46(1):89-99.
80. Ramachandran P, Boontheung P, Xie Y, Sondej M, Wong DT, Loo JA. Identii-cation of N-linked glycoproteins in human saliva by glycoprotein capture and mass spectrometry. J Proteome Res. 2006;5(6):1493-503.
81. Schipper R, Loof A, de Groot J, Harthoorn L, van Heerde W, Dransield E. Salivary protein/peptide proiling with SELDI-TOF-MS. Ann NY Acad Sci. 2007;1098:498-503.
82. Todd AL, Ng WY, Lee YS, Loke KY, hai AC. Evidence of autoantibodies to glutamic acid decarboxylase in oral luid of type 1 diabetic patients. Diabetes Res Clin Pract. 2002;57(3):171-7.
83. Vitorino R, Lobo MJ, Ferrer-Correira AJ, Dubin JR, Tomer KB, Domingues PM, et al. Identiication of human whole saliva protein components using pro-teomics. Propro-teomics. 2004;4(4):1109-15.
84. Walz A, Stuhler K, Wattenberg A, Hawranke E, Meyer HE, Schmalz G, et al. Proteome analysis of glandular parotid and submandibular-sublingual saliva in comparison to whole human saliva by two-dimensional gel electrophoresis. Proteomics. 2006;6(5):1631-9.
85. Wilmarth PA, Riviere MA, Rustvold DL, Lauten JD, Madden TE, David LL. Two-dimensional liquid chromatography study of the human whole saliva proteome. J Proteome Res. 2004;3(5):1017-23.
86. Xie H, Rhodus NL, Griin RJ, Carlis JV, Griin TJ. A catalogue of human saliva proteins identiied by free low electrophoresis-based peptide separation and tandem mass spectrometry. Mol Cell Proteomics. 2005;4(11):1826-30. 87. Yao Y, Berg EA, Costello CE, Troxler RF, Oppenheim FG. Identiication of
pro-tein components in human acquired enamel pellicle and whole saliva using novel proteomics approaches. J Biol Chem. 2003;278(7):5300-8.
88. Salivary Proteome Knowledge Base. Available from: http://hspp.dent.ucla.edu/ cgi-bin/hspmscgi-bin/search_pro_c.cgi.
89. Sys-BodyFluid Database.Available from: www.biosino.org/bodyluid/luid. jsp?bf=Saliva.
90. Navazesh M. Methods for collecting saliva. Ann NY Acad Sci. 1993;694:72-7. 91. Hardt M, Witkowska HE, Webb S, homas LR, Dixon SE, Hall SC, et al.
As-sessing the efects of diurnal variation on the composition of human parotid saliva: quantitative analysis of native peptides using iTRAQ reagents. Anal Chem. 2005;77(15):4947-54.
92. Aps JK, Martens LC. Review: he physiology of saliva and transfer of drugs into saliva. Forensic Sci Int. 2005;150(2-3):119-31.
93. Lu Y, Bentley GR, Gann PH, Hodges KR, Chatterton RT. Salivary estradiol and progesterone levels in conception and nonconception cycles in women: evalu-ation of a new assay for salivary estradiol. Fertil Steril. 1999;71(5):863-8. 94. Maseda C, Hama K, Fukui Y, Matsubara K, Takahashi S, Akane A. Detection of
delta 9-THC in saliva by capillary GC/ECD ater marihuana smoking. Forensic Sci Int. 1986;32(4):259-66.
96. Li C, Ha T, Ferguson DA, Jr., Chi DS, Zhao R, Patel NR, et al. A newly devel-oped PCR assay of H. pylori in gastric biopsy, saliva, and feces. Evidence of high prevalence of H. pylori in saliva supports oral transmission. Dig Dis Sci. 1996;41(11):2142-9.
97. Henskens YM, Veerman EC, Mantel MS, van der Velden U, Nieuw Amerongen AV. Cystatins S and C in human whole saliva and in glandular salivas in peri-odontal health and disease. J Dent Res. 1994;73(10):1606-14.
98. Anil S, Remani P, Beena VT, Nair RG, Vijayakumar T. Immunoglobulins in the saliva of diabetic patients with periodontitis. Ann Dent. 1995;54(1-2):30-3. 99. Mandel ID, Kutscher A, Denning CR, hompson RH, Jr., Zegarelli EV. Salivary
studies in cystic ibrosis. Am J Dis Child. 1967;113(4):431-8.
100. Ben-Aryeh H, Spielman A, Szargel R, Gutman D, Scharf J, Nahir M, et al. Si-alochemistry for diagnosis of Sjogrens syndrome in xerostomic patients. Oral Surg Oral Med Oral Pathol. 1981;52(5):487-90.
101. Armstrong D, Van Wormer D, Dimmitt S. Tissue peroxidase in the normal and neoplastic salivary gland. J Clin Lab Anal. 1991;5(4):293-8.
102. Jenzano JW, Courts NF, Timko DA, Lundblad RL. Levels of glandular kalli-krein in whole saliva obtained from patients with solid tumors remote from the oral cavity. J Dent Res. 1986;65(1):67-70.
103. Streckfus C, Bigler L, Dellinger T, Dai X, Kingman A, higpen JT. he presence of soluble c-erbB-2 in saliva and serum among women with breast carcinoma: a preliminary study. Clin Cancer Res. 2000;6(6):2363-70.
104. Chen DX, Schwartz PE, Li FQ. Saliva and serum CA 125 assays for detecting malignant ovarian tumors. Obstet Gynecol. 1990;75(4):701-4.
105. Ohshiro K, Rosenthal DI, Koomen JM, Streckfus CF, Chambers M, Ko-bayashi R, et al. Pre-analytic saliva processing afect proteomic results and biomarker screening of head and neck squamous carcinoma. Int J Oncol. 2007;30(3):743-9.
106. Dowling P, Wormald R, Meleady P, Henry M, Curran A, Clynes M. Analysis of the saliva proteome from patients with head and neck squamous cell car-cinoma reveals diferences in abundance levels of proteins associated with tumour progression and metastasis. J Proteomics. 2008;71(2):168-75. 107. de Jong EP, Xie H, Onsongo G, Stone MD, Chen XB, Kooren JA, et al.
Quan-titative proteomics reveals myosin and actin as promising saliva biomark-ers for distinguishing pre-malignant and malignant oral lesions. PLoS One. 2010;5(6):e11148.
108. Wu JY, Yi C, Chung HR, Wang DJ, Chang WC, Lee SY, et al. Poten-tial biomarkers in saliva for oral squamous cell carcinoma. Oral Oncol. 2010;46(4):226-31.
109. Castagnola M, Cabras T, Vitali A, Sanna MT, Messana I. Biotechnological im-plications of the salivary proteome. Trends Biotechnol. 2011; 29(8):409-18. 110. Jou YJ, Lin CD, Lai CH, Chen CH, Kao JY, Chen SY, et al. Proteomic
identii-cation of salivary transferrin as a biomarker for early detection of oral cancer. Anal Chim Acta. 2010;681(1-2):41-8.
111. Daniels TR, Delgado T, Rodriguez JA, Helguera G, Penichet ML. he trans-ferrin receptor part I: biology and targeting with cytotoxic antibodies for the treatment of cancer. Clin Immunol. 2006;121(2):144-58.
112. Vidotto A, Henrique T, Raposo LS, Maniglia JV, Tajara EH. Salivary and se-rum proteomics in head and neck carcinomas: before and ater surgery and radiotherapy. Cancer Biomark. 2010; 8(2):95-107.
113. Omenn GS, States DJ, Adamski M, Blackwell TW, Menon R, Hermjakob H, et al. Overview of the HUPO Plasma Proteome Project: results from the pi-lot phase with 35 collaborating laboratories and multiple analytical groups, generating a core dataset of 3020 proteins and a publicly-available database. Proteomics. 2005;5(13):3226-45.
114. Surinova S, Schiess R, Huttenhain R, Cerciello F, Wollscheid B, Aebersold R. On the development of plasma protein biomarkers. J Proteome Res. 2011;10(1):5-16.
115. Anderson NL, Anderson NG. he human plasma proteome: history, charac-ter, and diagnostic prospects. Mol Cell Proteomics. 2002;1(11):845-67. 116. Tirumalai RS, Chan KC, Prieto DA, Issaq HJ, Conrads TP, Veenstra TD.
Characterization of the low molecular weight human serum proteome. Mol Cell Proteomics. 2003;2(10):1096-103.
117. Kawashima Y, Fukutomi T, Tomonaga T, Takahashi H, Nomura F, Maeda T, et al. High-yield peptide-extraction method for the discovery of subnanomolar biomarkers from small serum samples. J Proteome Res. 2010;9(4):1694-705. 118. Wolf-Yadlin A, Hautaniemi S, Laufenburger DA, White FM. Multiple reac-tion monitoring for robust quantitative proteomic analysis of cellular signal-ing networks. Proc Natl Acad Sci USA. 2007;104(14):5860-5.
119. Picotti P, Bodenmiller B, Mueller LN, Domon B, Aebersold R. Full dy-namic range proteome analysis of S. cerevisiae by targeted proteomics. Cell. 2009;138(4):795-806.
120. Keshishian H, Addona T, Burgess M, Kuhn E, Carr SA. Quantitative, multiplexed assays for low abundance proteins in plasma by targeted mass spectrometry and stable isotope dilution. Mol Cell Proteomics. 2007;6(12):2212-29.
121. Riaz S, Alam SS, Akhtar MW. Proteomic identiication of human serum bio-markers in diabetes mellitus type 2. J Pharm Biomed Anal. 2010;51(5):1103-7. 122. Liu X, Feng Q, Chen Y, Zuo J, Gupta N, Chang Y, et al. Proteomics-based
identiication of diferentially-expressed proteins including galectin-1 in the blood plasma of type 2 diabetic patients. J Proteome Res. 2009;8(3):1255-62.
123. de Seny D, Fillet M, Ribbens C, Maree R, Meuwis MA, Lutteri L, et al. Mo-nomeric calgranulins measured by SELDI-TOF mass spectrometry and calprotectin measured by ELISA as biomarkers in arthritis. Clin Chem. 2008;54(6):1066-75.
124. Kiernan UA, Nedelkov D, Nelson RW. Multiplexed mass spectrometric im-munoassay in biomarker research: a novel approach to the determination of a myocardial infarct. J Proteome Res. 2006;5(11):2928-34.
125. He QY, Lau GK, Zhou Y, Yuen ST, Lin MC, Kung HF, et al. Serum biomarkers of hepatitis B virus infected liver inlammation: a proteomic study. Proteomics. 2003;3(5):666-74.
126. Zhao X, Xiao WZ, Pu XP, Zhong LJ. Proteome analysis of the sera from Chi-nese Parkinson’s disease patients. Neurosci Lett. 2010;479(2):175-9. 127. Seeber B, Sammel MD, Fan X, Gerton GL, Shaunik A, Chittams J, et al.
Proteomic analysis of serum yields six candidate proteins that are difer-entially regulated in a subset of women with endometriosis. Fertil Steril. 2010;93(7):2137-44.
128. Minami S, Sato Y, Matsumoto T, Kageyama T, Kawashima Y, Yoshio K, et al. Proteomic study of sera from patients with bladder cancer: usefulness of S100A8 and S100A9 proteins. Cancer Genomics Proteomics. 2010;7(4):181-9. 129. Freed GL, Cazares LH, Fichandler CE, Fuller TW, Sawyer CA, Stack BC, Jr.,
et al. Diferential capture of serum proteins for expression proiling and bio-marker discovery in pre- and posttreatment head and neck cancer samples. Laryngoscope. 2008;118(1):61-8.
130. Lai CH, Chang NW, Lin CF, Lin CD, Lin YJ, Wan L, et al. Proteomics-based identiication of haptoglobin as a novel plasma biomarker in oral squamous cell carcinoma. Clin Chim Acta. 2010;411(13-14):984-91.
131. Wei YS, Zheng YH, Liang WB, Zhang JZ, Yang ZH, Lv ML, et al. Identiication of serum biomarkers for nasopharyngeal carcinoma by proteomic analysis. Cancer. 2008;112(3):544-51.
132. Cheng AJ, Chen LC, Chien KY, Chen YJ, Chang JT, Wang HM, et al. Oral cancer plasma tumor marker identiied with bead-based ainity-fractionated proteomic technology. Clin Chem. 2005;51(12):2236-44.
133. Ransohof DF, Martin C, Wiggins WS, Hitt BA, Keku TO, Galanko JA, et al. Assessment of serum proteomics to detect large colon adenomas. Cancer Epi-demiol Biomarkers Prev. 2008;17(8):2188-93.
134. Gemoll T, Roblick UJ, Auer G, Jornvall H, Habermann JK. SELDI-TOF serum proteomics and colorectal cancer: a current overview. Arch Physiol Biochem. 2010;116(4-5):188-96.
135. Liu WL, Zhang G, Wang JY, Cao JY, Guo XZ, Xu LH, et al. Proteomics-based identiication of autoantibody against CDC25B as a novel serum marker in esophageal squamous cell carcinoma. Biochem Biophys Res Commun. 2008;375(3):440-5.
136. Chong PK, Lee H, Loh MC, Choong LY, Lin Q, So JB, et al. Upregulation of plasma C9 protein in gastric cancer patients. Proteomics. 2010;10(18):3210-21. 137. Sun Y, Zang Z, Xu X, Zhang Z, Zhong L, Zan W, et al. Diferential proteomics identiication of HSP90 as potential serum biomarker in hepatocellular carci-noma by two-dimensional electrophoresis and mass spectrometry. Int J Mol Sci. 2010;11(4):1423-33.
138. Feng JT, Liu YK, Song HY, Dai Z, Qin LX, Almoti MR, et al. Heat-shock pro-tein 27: a potential biomarker for hepatocellular carcinoma identiied by se-rum proteome analysis. Proteomics. 2005;5(17):4581-8.
139. Hamrita B, Chahed K, Trimeche M, Guillier CL, Hammann P, Chaieb A, et al. Proteomics-based identiication of alpha1-antitrypsin and haptoglobin pre-cursors as novel serum markers in iniltrating ductal breast carcinomas. Clin Chim Acta. 2009;404(2):111-8.
140. Goncalves A, Esterni B, Bertucci F, Sauvan R, Chabannon C, Cubizolles M, et al. Postoperative serum proteomic proiles may predict metastatic relapse in high-risk primary breast cancer patients receiving adjuvant chemotherapy. Oncogene. 2006;25(7):981-9.
141. Rong Y, Jin D, Hou C, Hu J, Wu W, Ni X, et al. Proteomics analysis of serum protein proiling in pancreatic cancer patients by DIGE: up-regulation of man-nose-binding lectin 2 and myosin light chain kinase 2. BMC Gastroenterol. 2010;10:68.
142. Xue A, Scarlett CJ, Chung L, Butturini G, Scarpa A, Gandy R, et al. Discovery of serum biomarkers for pancreatic adenocarcinoma using proteomic analysis. Br J Cancer. 2010;103(3):391-400.
143. Al-Ruwaili JA, Larkin SE, Zeidan BA, Taylor MG, Adra CN, Aukim-Hastie CL, et al. Discovery of serum protein biomarkers for prostate cancer progression by proteomic analysis. Cancer Genomics Proteomics. 2010;7(2):93-103. 144. Byrne JC, Downes MR, ODonoghue N, OKeane C, ONeill A, Fan Y, et al.
2D-DIGE as a strategy to identify serum markers for the progression of prostate cancer. J Proteome Res. 2009;8(2):942-57.
145. Bharti A, Ma PC, Maulik G, Singh R, Khan E, Skarin AT, et al. Haptoglobin alpha-subunit and hepatocyte growth factor can potentially serve as serum tu-mor biomarkers in small cell lung cancer. Anticancer Res. 2004;24(2C):1031-8. 146. Shevchenko VE, Arnotskaya NE, Zaridze DG. Detection of lung cancer using plasma protein proiling by matrix-assisted laser desorption/ionization mass spectrometry. Eur J Mass Spectrom. 2010;16(4):539-49.
148. Sarkissian G, Fergelot P, Lamy PJ, Patard JJ, Culine S, Jouin P, et al. Identii-cation of pro-MMP-7 as a serum marker for renal cell carcinoma by use of proteomic analysis. Clin Chem. 2008;54(3):574-81.
149. Vermaat JS, van der Tweel I, Mehra N, Sleijfer S, Haanen JB, Roodhart JM, et al. Two-protein signature of novel serological markers apolipoprotein-A2 and serum amyloid alpha predicts prognosis in patients with metastatic renal cell cancer and improves the currently used prognostic survival models Ann Oncol. 2010;21(7):1472-81.
150. Kolla V, Jeno P, Moes S, Tercanli S, Lapaire O, Choolani M, et al. Quantitative proteomics analysis of maternal plasma in Down syndrome pregnancies using isobaric tagging reagent (iTRAQ). J Biomed Biotechnol. 2010;2010:952047. 151. Hawkridge AM, Muddiman DC. Mass spectrometry-based biomarker
discov-ery: toward a global proteome index of individuality. Annu Rev Anal Chem. 2009;2:265-77.
152. Apweiler R, Aslanidis C, Deufel T, Gerstner A, Hansen J, Hochstrasser D, et al. Approaching clinical proteomics: current state and future ields of application in luid proteomics. Clin Chem Lab Med. 2009;47(6):724-44.
153. Zhang Z, Bast RC Jr, Yu Y, Li J, Sokoll LJ, Rai AJ, et al. hree biomarkers identi-ied from serum proteomic analysis for the detection of early stage ovarian cancer. Cancer Res. 2004;64(16):5882-90.