Regardless the degree of hearing loss, any subject who reports hearing and communication
dificulties should be considered as a potential
candidate to use hearing aids3.
The Hearing Aid – HA has the function of amplify sounds in a way that allows the subject to use their reminiscent hearing in an effective way3.
Selection and itting process of the HA should
aim the decrease of activity limitations and participation restrictions, the effective use of the prosthesis itself and patient’s satisfaction4. In 2012, a study developed with elderly carriers of sensori-neural hearing loss reported an improvement on life quality, more body balance and less preoccupation
on falling, tinnitus decrease and self-conidence increase after the hearing aid itting5.
Among several questionnaires available for area professionals, the International Outcome Inventory for Hearing Aids (IOI-HA) is often used
THE USE OF SELF-ASSESSMENT QUESTIONNAIRES
FOR VALIDATION OF THE RESULTS IN HEARING
AID SELECTION AND FITTING PROCESS
O uso de questionário de autoavaliaçâo na validação
dos resultados do processo de seleção e adaptação
de dispositivos eletrônicos de ampliicação sonora individual
Vanessa Schneider Broca (1), Renata Coelho Scharlach (2)
(1) Instituto de Estudos Avançados da Audição- IEAA, São Paulo, SP, Brasil.
(2) Universidade Federal de Santa Catarina - UFSC, Florianó-polis, SC, Brasil.
Conlict of interest: non-existent
INTRODUCTION
According to the data from 2010 Census1, 9.8 million Brazilian people declared to present hearing impairment (HI). Probably, this number is much higher, as the World’s Health Organization declares2 more than 15 million Brazilian people have hearing problems, because often the problem is not realized or it is denied by subjects. Frequently, not accept
hearing dificulties, causes an absence of treatment
that can intensify the frustration in not hearing and leads the subject to isolation.
ABSTRACT
Purpose: verify the effect of the use of hearing aid in hearing impaired subjects through a self-assessment questionnaire. Methods: the questionnaire International Outcome Inventory for Hearing Aids was used to validate the results. 22 hearing aid users, aged 32 and 85 years, with bilateral sensorineural hearing loss from mild to severe, post-lingual, were evaluated. All participants were users
of ampliication with unilateral or bilateral adaptation for at least 12 weeks. Results: the mean total
score obtained in the application of the questionnaire was 27 and there was no signiicant difference
(p = 0.191) between scores on the seven questions in the questionnaire, being the average of 3.85
points. There was no correlation of results either with the patients’ age or with time of ampliication. There was no signiicant difference in the total score of the questionnaire as well as factors 1 and 2 when considered: degree of hearing loss, audiometric coniguration, hearing aid model and unilateral
or bilateral adaptation. Conclusion: through the application of the questionnaire it was found that the
use of sound ampliication has beneicial effects for their users and that they were satisied with their
use.
bilateral. The researchers applied as exclusion criteria: less than three months itting or more than
60 months, other types of hearing loss, patients who developed hearing loss before language acquisition and patients who do not received the hearing aid in
the ofice where the study was performed.
Data collection was made from January to June of 2012 and all the participants were submitted to the application of the questionnaire IOI-HA (International Outcome Inventory for Hearing Aids), proposed
by Cox et al in 200013. This material is a product
of the Workshop Self-Report Outcome Measures in
Audiological Rehabilitation that happened in 2000
and was organized by Cox and collaborators. His
proposal was to complement tests that measure aspects involved in adaptation process of hearing aids.
The questionnaire is composed by seven
questions of the following aspects: beneits,
residual activities limitation, satisfaction, residual participation restriction, impact on others’ lives and
life quality. Each of the questions has ive alterna -tives, being the patient guided to choose the answer that corresponds to their reality. The score for each
question varies from one (worst result) to ive (best
result), and the higher score (the sum of all items) is of 35 points. According to the analysis criteria of the questionnaire, a high score is indication of a positive evaluation of patient’s development with the electronic device use. The gross value is the sum of all answers and the adjusted value is the mean of all answers. The factor 1 is the sum of questions 1,2,4 and 7 and factor 2 is the sum of questions 3,5 and 6, respectively correspondent to subjects’ interaction with their own prosthesis, and subjects’ interaction with other people in their environment, Figure 1. In the present study, the researcher has read the questionnaire aloud to every participant.
The results were submitted to descriptive and inferential statistical analysis, being used
non-parametric tests. The signiicance level estab
-lished was of 5% (0.05). All the conidence intervals
throughout the study were constructed with 95% of
statistic conidence.
in national6,7 and international8 researches for
subjects’ self-assessment, regarding ampliication.
This material was designed with questions of low cognitive demands and an ease reading level for subjects, aiming to improve the cooperation between researchers and professionals of rehabili-tation programs in many hearing health services9. The questionnaire (IOI-HA) aims to document from the subjects’ point of view the evolution of daily use the prosthesis, considering not only the satisfaction level, but also the limitations on basic activities, participation restrictions, impact on others and life quality10,11. By applying the questionnaire IOI-HA is possible to document the evolution of the hearing aid use considering its use in daily routine, its
beneits and subjects’ satisfaction level. As well as
being possible to observe improvement on more limited activities, as noisier places, and mainly the decrease of the impact that the impairment may cause on others, consequently an improvement on life quality12.
The present study aimed to verify the effect of hearing aid use on patients through a self-assessment questionnaire.
METHODS
This research was approved by the Committee of Ethics in Research under protocol no 04/2011. Users among three to 60 months of using hearing aid, agreed on participate and signed a Consent Form. The collection was made in an audiological
ofice, located in the city of Balneário Camburiú –
SC, in which patients received the HA. This sample was chosen because there are few researches with
patients of private ofices and also it is a convenient
sample.
It is a cross-sectional, descriptive, analytic study planned to validate the results of the selection and
itting process of hearing aid electronic devices. It
was interviewed 22 HA users, among 32 and 85 years old, carriers of sensorineural bilateral post-lingual hearing loss of mild to severe degree. All
was of 3.75 and the masculine gender of 4.03; the factor 2 adjusted for the feminine gender was of 3.89 and the for de masculine gender of 3.76.
The sample was characterized by the features of
the HA itting and the degree of hearing loss before
the presentation of the results collected by applying the questionnaire IOI-HA.
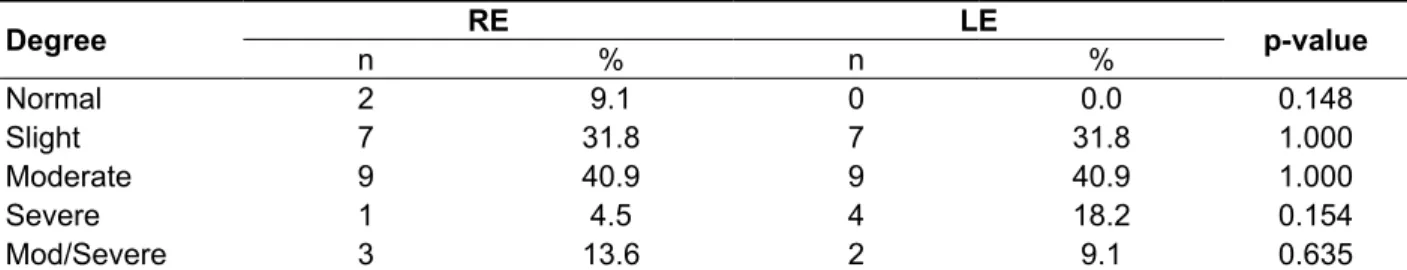
Table 1 indicates there was no difference regarding the degree of hearing loss between ears, according to Davis and Silverman, 197014. The Equality of Proportions Tests for Two Samples also highlighted that for both right and left ears the hearing loss of moderate degree was more prevalent in the sample, being possible to observe statistic difference with normal, moderately severe and severe degrees (Table2).
RESULTS
It had participated in the study 22 subjects, carriers of sensorineural bilateral hearing loss.
Regarding the gender, it was veriied that 12
subjects (54.5%) were feminine gender and 10 were masculine gender (45.5%) and this difference was
not signiicant (p= 0.546), according to the Equality
for Proportions Test of Two Samples. The mean age was of 70.4 years old ± 14.7. Both feminine and masculine subjects were treated as a single group,
since the score was not signiicant to be treated
as two groups. The adjusted total of the feminine gender was of 3.80 and the masculine gender was of 3.91. The factor 1 adjusted of the feminine gender
Table 1- Subjects distribution according to degree of hearing loss for both right and left ear (n= 22)
Degree RE LE p-value
n % n %
Normal 2 9.1 0 0.0 0.148
Slight 7 31.8 7 31.8 1.000
Moderate 9 40.9 9 40.9 1.000
Severe 1 4.5 4 18.2 0.154
Mod/Severe 3 13.6 2 9.1 0.635
Subtitle: mod/severe (moderately severe) Two Portions Equality Test
Table 2 – Demonstration of p value relative to the comparison of the degree of hearing loss in each ear
Degree RE Le
Normal 0.015 <0,001
Mild 0.531 0.531
Moderate Ref. Ref.
Severe 0.004 0.099
Mod/Severe 0.042 0.015
Caption: mod/severe (moderately severe) Two Portions Equality Test
Regarding the features of HA itting, the Equality
of Proportions Tests for Two Samples presented
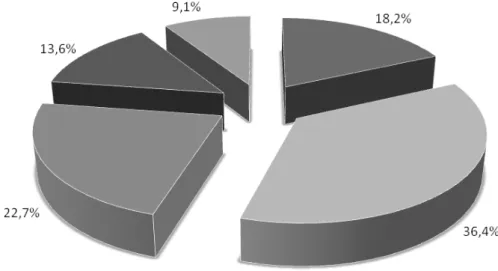
signiicant difference (p=0.03) between the type of itting, being 16 subjects (72.7%) with bilateral itting and only six (27.3%) with unilateral itting. Also, the
most used HA was completely-in-the-canal (CIC) with 36.4%, and the less used was the receiver-in-the ear (BTE RITE) with 9.1%, however, this was
not a signiicant difference (p=0.228). In Figure
2 is possible to observe the distribution of the HA indicated by type. The behind-the-ear models were divided into conventional behind-the-ear (BTE CO)
with 18.2%, and behind-the-ear open itting (BTE
In Table 3 is presented the mean score obtained in each question of the IOI-HA questionnaire and the comparison between scores, and in Figure 3
the distribution of subjects who attributed maximum score (ive points) for each question.
About the HA adjustment, 15 subjects (68.2%) used programmable devices and seven (31.8%) were users of trimmer adjusted HA, that difference
was signiicant (p=0.016). Eventually, the average time of ampliication use was of 23.6 months ± 16.4.
Following, it will be presented the results relative to the questionnaire IOI-HA application.
Caption: BTE CO (conventional behind-the-ear), CIC (completely-in-the-canal), ITC (in-the-canal), BTE AA (behind-the-ear open
itting) e BTE REC (behind-the-ear received-in-canal).
Figure 2 – Distribution of hearing aids according to the adapted model
Table 3 – The Mean obtained on each question of the International Inventory – Hearing Aid and the comparison of results obtained among 22 subjects
QI-AASI Q1 Q2 Q3 Q4 Q5 Q6 Q7
Mean 3.73 3.68 3.55 4.09 4.09 3.86 4.00
Median 4 4 4 4 4 4 4
Standard
Deviation 1.39 1.13 1.01 1.06 1.02 1.25 1.02
Q1 3 3 3 3 3 3 3
Q3 5 4 4 5 5 5 5
n 22 22 22 22 22 22 22
CI 0.58 0.47 0.42 0.45 0.43 0.52 0.43
p-value 0.191
Caption: CI: Conidence Interval and n: sample.
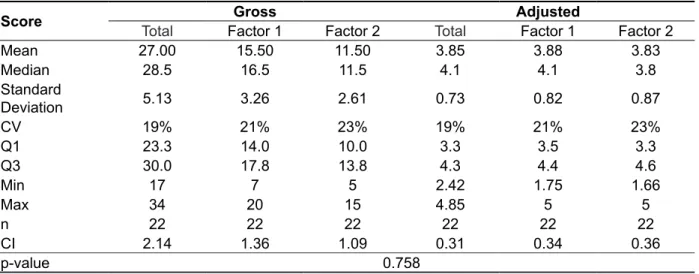
Table 4 shows the mean score from the total value (gross and adjusted) and of factors 1 and 2 (gross and adjusted) found in the questionnaire
application. The Wilcoxon’s Test showed there was no signiicant difference between the score of the
factor 1 adjusted and the factor 2 adjusted (p=0.758). The statistical Friedman’s Test highlighted there
was no signiicant difference (p=0.191) among
the mean of all questions achieved in the IOI-HA questionnaire.
Caption: Q1:- question 1; Q2: - question 2; Q3: - question 3; Q4: - question 4; Q5: question 5; Q6: - question 6 and Q7: - question 7.
Figure 3 - Distribution (%) of subjects related to the higher grade applied in each question of the International Inventory –HA.
Table 4 – Mean score of the total (gross and adjusted) and of the factors 1 and 2 (gross and adjusted) in the application of the International Inventory – HA (n=22)
Score Gross Adjusted
Total Factor 1 Factor 2 Total Factor 1 Factor 2
Mean 27.00 15.50 11.50 3.85 3.88 3.83
Median 28.5 16.5 11.5 4.1 4.1 3.8
Standard
Deviation 5.13 3.26 2.61 0.73 0.82 0.87
CV 19% 21% 23% 19% 21% 23%
Q1 23.3 14.0 10.0 3.3 3.5 3.3
Q3 30.0 17.8 13.8 4.3 4.4 4.6
Min 17 7 5 2.42 1.75 1.66
Max 34 20 15 4.85 5 5
n 22 22 22 22 22 22
CI 2.14 1.36 1.09 0.31 0.34 0.36
p-value 0.758
is no signiicant correlation between ages and itting
time with the adjusted scores, that is, statistically they are independent results.
Table 5 presents the results of the correlation on adjusted scores obtained by applying the IOI-HA
with the variables age and time of HA itting. There
Table 5 - Correlation of the adjusted scores (total, factor 1 and factor2) obtained from the application
of the II-HA with the variables age and time of the hearing aid itting
II-HA
Adjusted Value Age Time of itting
Total Corr 1.7% -11.6%
P-value 0.940 0.607
Factor 1 Corr -0.7% -4.4%
P- value 0.976 0.844
Factor 2 Corr 11.1% -31.7%
P- value 0.624 0.151
Caption: total, factor 1 (questions 1,2,4 and 7) and factor 2 (questions 3,5 and 6) Spearman’s Correlation Test
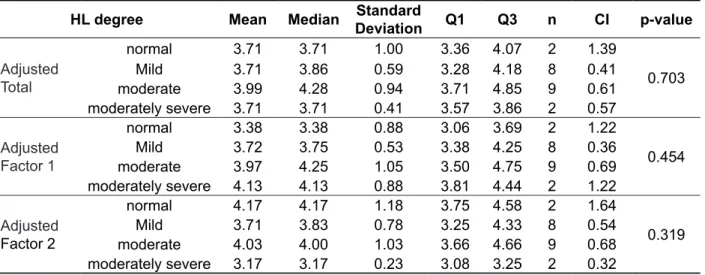
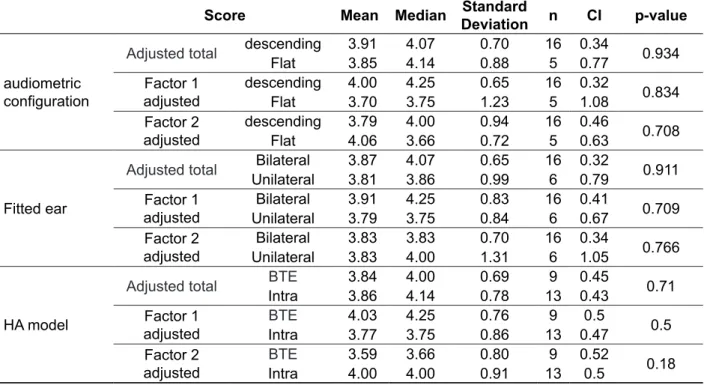
To conclude, in the analysis presented in Tables 6 and 7 were developed comparisons between results from IOI-HA and features audiological and
of ampliication.
The analysis presented in Table 6 revealed that
there was no signiicant difference between scores
obtained in IOI-HA regarding degree of hearing loss, considering the better ear.
In Table 7 the Mann-Whitney’s Test was used to compare adjusted scores with audiometric conigu
-ration, itted ear and HA type. The analysis showed there was no signiicant difference between scores
considering the variables.
Table 6 - Comparison of the adjusted scores (total, factor 1 and factor 2) regarding the degree of hearing loss of the better ear
HL degree Mean Median Standard
Deviation Q1 Q3 n CI p-value
Adjusted Total
normal 3.71 3.71 1.00 3.36 4.07 2 1.39
0.703
Mild 3.71 3.86 0.59 3.28 4.18 8 0.41
moderate 3.99 4.28 0.94 3.71 4.85 9 0.61 moderately severe 3.71 3.71 0.41 3.57 3.86 2 0.57
Adjusted Factor 1
normal 3.38 3.38 0.88 3.06 3.69 2 1.22
0.454
Mild 3.72 3.75 0.53 3.38 4.25 8 0.36
moderate 3.97 4.25 1.05 3.50 4.75 9 0.69 moderately severe 4.13 4.13 0.88 3.81 4.44 2 1.22
Adjusted Factor 2
normal 4.17 4.17 1.18 3.75 4.58 2 1.64
0.319
Mild 3.71 3.83 0.78 3.25 4.33 8 0.54
moderate 4.03 4.00 1.03 3.66 4.66 9 0.68 moderately severe 3.17 3.17 0.23 3.08 3.25 2 0.32
Caption:HL: hearing loss
Tables 1 and 2 indicated that hearing loss of moderate degree, for both right and left ears, was most prevalent for the studied population (40.9%), and there was a statistical difference regarding the degrees normal, moderately severe and severe. The most used HA was the in-the-canal type with
13 users (59.1%), although there was no signiicant
difference (p=0.228). Related to the HA adjustment,
15 (68.2%) subjects were itted with programmable
devices. In a previous study, 50% of population was
itted with in-the-canal and the other 50% was itted
with behind-the-ear devices17.
Table 3 shows the score for each question of the IOI-HA questionnaire. It is possible to conclude that the mean score for each question varied among 3.55 and 4.09; the median score was 4.0
for all questions. Moreover, it is possible to verify
through analyzes that there was no difference of answer among questions (p=1.191). In a study also developed in the south region of the country, in
2010, the mean values veriied through the seven
questions varied in 3.42 to 4.67 points, these results are very similar to this study18. A different study developed in the north region of the country, also found mean values similar to scores which varied in 3.7 to 4.4 points. However, that study found
DISCUSSION
According to the Ministry of Health, currently,
the questionnaire IOI-HA is included in the form of Selection and Fitting Hearing Aids (ordinance SAS/
MS no 587, from October 7th 2004) and evaluates seven areas considered to be important to the
success of using the HA (use, beneit, residual
activity limitation, satisfaction, residual participation restriction, impact on others’ lives and life quality). International authors synthetized the IOI-HA as a
questionnaire that allows making the comparison
among different devices and/or settings, as well as
the beneit evaluation of using the same electronic
device during a time, enabling the user to recognize the advantages offered by the device regarding
their hearing dificulties and psychosocial disad -vantages15. Therefore using questionnaires which
enable measuring and analyze these hearing difi -culties or of the handicap, it is possible to improve
the hearing aid itting period.
In this research was interviewed 22 subjects, 12 (54.5%) being feminine gender and 10 (45.5%) masculine gender. Previous studies with the same material, presented participants’ distribution very
Table 7 - Comparison of the adjusted scores (total, factor 1 and factor 2) regarding the audiometric
coniguration; if it was an unilateral or bilateral itting and the hearing aid model selected
(behind-the-ear or intra-aural)
Score Mean Median Standard
Deviation n CI p-value
audiometric coniguration
Adjusted total descending 3.91 4.07 0.70 16 0.34 0.934 Flat 3.85 4.14 0.88 5 0.77
Factor 1 adjusted
descending 4.00 4.25 0.65 16 0.32
0.834 Flat 3.70 3.75 1.23 5 1.08
Factor 2 adjusted
descending 3.79 4.00 0.94 16 0.46
0.708 Flat 4.06 3.66 0.72 5 0.63
Fitted ear
Adjusted total Bilateral 3.87 4.07 0.65 16 0.32 0.911 Unilateral 3.81 3.86 0.99 6 0.79
Factor 1 adjusted
Bilateral 3.91 4.25 0.83 16 0.41
0.709 Unilateral 3.79 3.75 0.84 6 0.67
Factor 2 adjusted
Bilateral 3.83 3.83 0.70 16 0.34
0.766 Unilateral 3.83 4.00 1.31 6 1.05
HA model
Adjusted total BTE 3.84 4.00 0.69 9 0.45 0.71
Intra 3.86 4.14 0.78 13 0.43 Factor 1
adjusted
BTE 4.03 4.25 0.76 9 0.5
0.5 Intra 3.77 3.75 0.86 13 0.47
Factor 2 adjusted
BTE 3.59 3.66 0.80 9 0.52
0.18 Intra 4.00 4.00 0.91 13 0.5
Caption: BTE (behind-the-ear), Intra (intra auricular)
same year (2005), 75% of the sample using digital
HA with bilateral itting had no dificulty in situations
of communication21. These results are much higher compared to those found in this research and in a study developed in 2010, in which it was observed
a lower number of subjects who gave the maximum
score for that question (27.7%)7. A recent article 2010 also revealed an inferior distribution of adults (30.8%) and elderlies (27.8%) who pointed the
maximum score for this question20. Still, considering the last two researches mentioned, the results in this study are inferior. Nevertheless, the researches in 2010 and 2011 were developed with populations of hearing health programs and this study was
developed with private ofice patients. That variable may have inluenced the results; therefore, further
research is necessary to evaluate better its effect. The mean of answer for question 4 was 4.09 and the median was 4 point, and 45.5% of the sample
reported to be very satisied using the hearing
aid, this result is a little inferior to the result found in a study developed in Rio Grande do Sul with adults (53.8%) and elderlies (52.8%) of a Hearing Health Program20 and in another study developed in the state of São Paulo (60%)19. A study revealed much superior results, above 90% of the subjects
satisied. Though, in this research it was considered
the sum of the answers of 4 and 5 points to reach this percentual11. In the same year (2005) a different study found 100% of the digital HA users reported
to be very satisied giving 5 points to this question21.
Taking into account the residual participation
restriction, analyzed in question 5, the mean answer also was of 4.09 points and the median was 4 points, and once again 45.5% of the sample applied
the maximum score for this item, verifying absence
of participation restriction due to the hearing loss.
In study conducted in Santa Maria, in 2010, 46.1%
of the adults and 36.1% of the elderlies interviewed
reported that after itting, the hearing dificulties do
not affect on their daily activities20. Oppositely, a study conducted in 2011, 80% had the same report19.
It can be veriied a variation of the evaluation in this
aspect analyzed by the question considering the present and previous studies.
In the question that evaluates the impact of the hearing impairment in others (question 6) the mean and median score were 3.86 and 4 points, respectively. Again, it was observed that 45% of
the sample presented the maximum score for this question emphasizing that using the ampliication,
the problems caused by the hearing impairment stop to affect or upset other people. The literature
shows different and greater results, for example in
the study conducted in 2010, both groups (53.8% adults and 72.2% elderlies) reported that their recent research (2011), with unilateral hearing loss
carriers, veriied mean values which varied in 3.53
to 4.73 points. Once again, the results are similar to this study19.
Analyzing Table 3 and Figure 2, considering question number 1 that refers to the time of use
the HA, it was conirmed the mean score of 3.73,
median score of 4 and that 40.9% of the sample
assigned maxim score to this question, that is, they
reported to use the HA more than eight hours a day. In a study of 2010, 84.6% adults and 75% elderlies reported to use the HA more than eight hours a day20 and, other study of 2011 conirmed that 66.67% of the sample use the HA more than eight hours a day19. Nevertheless, a study in 2005 found
maximum score in 44% users of HA monaural itted and in 56% users of HA binaural itted9. In the same
year, a different study veriied maximum score in 30% of the itted subjects with analogic technology
and in 70% of users with digital technology21. This result suggests that digital technology probably provides more comfort to user enabling to use the
devices longer. Some authors afirm that the fact of
the users do not reject the HA use is directly related to the acceptance of the hearing loss and,
conse-quently, to the need of ampliication use, therefore,
the relation between time of HA use in daily activities
and adaptation to ampliication can be very dificult15.
For question 2, related to the beneit of using HA,
the mean score was 3.68 and the median 4 points. Considering the median value, the HA helped fairly
and 22.7% of users gave maximum score for this
question, that is, they reported that the devices helped very much.
Considering the maximum score, previous
studies also did not reported an elevated distribution of the subjects (13.33 to 38.9%)19,20. On the other hand, different studies presented results superior to 87%, but it was considered in the analysis scores 4 and 59,21. Either way, when considering that the greater part of the sample attributed scores between
4 and 5, it is possible to afirm that the devices fulill
their goals and help their users.
In question 3, related to the residual limitation
with the ampliication use, the mean score was 3.55 points and median score was 4 points, conirming
a decrease of the participation limitation by using
the ampliication since the greater part of the sample reported just few dificulties with the HA use. Considering the maximum score possible in the
questionnaire, 18.2% of the sample reported any
dificulty in situations of communication by using the hearing aid. A previous study found maximum
scores in 56.30% and 39.10% of the sample,
was conirmed that neither subjects’ age or time of
using the HA interfered on the results of total score and of factors 1 and 2.
Finally, Tables 6 and 7 demonstrated that variables as degree of hearing loss, audiometric
coniguration, uni and bilateral itting and the HA type also did not have inluence on the IOI-HA results.
A previous study, also conducted in the south region of the country and with a sample of a hearing center, showed there was no difference among
IOI-HA scores, considering uni and bilateral itting9.
Regardless if the audiologist works in a hearing
health program or private clinic, is important and
eficient to use materials that may assist the
validation process of results. Still, authors suggest the application of the IOI-HA questionnaire during a rehabilitation process to assist in guidance for using the HA23.
CONCLUSION
This research showed that 40.9% of the sample use the HA more than eight hours a day, 45.5% of
the users afirmed to be very satisied using the hearing aids and 40.9% afirmed that, currently,
they had much more joy on living. These results
emphasize the beneit of using the device and the
improvement of life quality.
Through the application of the IOI-HA
question-naire it was veriied that using the hearing aid has beneic effect for its users and they showed themselves satisied with its use.
hearing problems do not caused negative impact on others20.
In a study of 2011, 60% of the sample reported the same19. And in 2005, 70% of the group with digital technology users answered that the hearing problem does not affect their relation with others21.
Eventually, question 7 evaluated the change in
users’ life quality by using the HA. Maximum score
was assigned by 40.9% of the sample, which means that, now, they had much more joy on living. The mean and median score was of 4 points. A previous study found slightly inferior results for both adults and elderlies (31%)20. Once again, the study of 2005, demonstrated results much superior to this and other studies, in which 95% of the sample
presented maximum score, that is, answered “much
more join on living”9.
The factors 1 and 2 relect the relation of the
subject and their HA and their environment. Table 4
conirms for both factors high mean scores, empha
-sizing good results of itting. It was veriied for the gross value of factor 1 15.5 points (maximum score of 20 points) and for factor 2 11.5 points (maximum
score of 15 points). Previous national studies and with hearing health programs populations also had high values for factors 1 and 27,22. In the present
study it was not observed signiicant differences
(p=0.758) between adjusted scores of factor 1 (3.88) and factor 2 (3.83), as in a study conducted in 20107.
Table 5 described correlation analysis made to detect if the variables age and time of using the HA,
had inluence on the results of the questionnaire. It
RESUMO
Objetivo: veriicar o efeito do uso da ampliicação sonora em deicientes auditivos por meio de um
questionário de autoavaliação. Métodos: utilizou-se o Questionário Internacional – Aparelho de
Ampliicação Sonora Individual, composto de sete questões. Avaliaram-se 22 sujeitos com idade
entre 32 e 85 anos, portadores de perda auditiva neurossensorial bilateral de grau leve a severo,
pós--lingual, usuários de aparelho de ampliicação sonora individual com adaptação unilateral ou bilateral
pelo período mínimo de 12 semanas. Resultados: o escore médio da pontuação total obtido na
aplicação do questionário foi de 27 pontos e não houve diferença signiicante (p=0,191) entre as pon
-tuações obtidas nas sete questões do questionário, sendo o valor médio de 3,85 pontos. Não houve correlação dos resultados com a idade dos pacientes nem com o tempo de uso da ampliicação. Não houve diferença signiicante no escore total do questionário bem como dos fatores 1 e 2 con
-siderando: grau da perda auditiva, coniguração audiométrica, modelo de aparelho de ampliicação
sonora individual e adaptação unilateral ou bilateral. Conclusão: com a aplicação do questionário
veriicou-se que o uso da ampliicação sonora tem efeito benéico para seus usuários e que estes se
mostraram satisfeitos com o uso.
12. Teixeira CF, Augusto LGS, NETO SSC. Prótese auditiva: satisfação do usuário com sua prótese e
com seu meio ambiente. Rev CEFAC. 2008;10(2) 245-53.
13. Cox RM, Alexander GC: Expectations about hearing aids and their relationship to itting outcome.
J Am Acad Audiol. 2000;11(7):368-82.
14. Davis H, Silverman RS. Hearing and deafness.
Nova York: Rinehart & Wiston; 1970.
15. Huch JL, Hosford-Dunn H. Inventories of
Self-Assessment Measurements of Hearing Aid Outcome. In: Sandlin RE. Hearing aid ampliication:
technical and clinical considerations. San Diego: Singular Publishing Group; 2000. p.489-555.
16. Godinho R, Keogh I, Eavey R. Perda auditivagenética. Rev Bras Otorrinolaringol. 2003;1(69):100-4.
17. Rodrigues PC, Oliveira AC, Colafêmina JF,
Menezes PL. Localização sonora em usuários de ampliicação sonora individual. Rev CEFAC.
2010;3(12):377-83.
18. Gasparin M, Menegotto IH, Cunha CS. Propriedades psicométricas do questionário internacional – aparelho de ampliicação
sonora individual. Braz J Otorhinolaryngol. 2010;76(1):85-90.
19. José MR, Campos PD, Modelli MFCG. Unilateral hearing loss: beneits and satisfaction from the
use of hearing aids. Braz J Otorhinolaryngol. 2011;2(77):221-8.
20. Lopes AS, Costa MJ, Aurélio NHS, Santos
SN, Vaucher AV. A satisfação e desempenho de
usuários de próteses auditivas atendidos em um programa de atenção à saúde auditiva. Rev CEFAC.
2010;13(4):698-709.
21. Magni C, Freiberger F, Tonn K. Avaliação do grau de satisfação entre os usuários de ampliicação de tecnologia analógica e digital. Rev
Bras Otorrinolaringol. 2005;5(71):650-7.
22. Zambonato TCF. Adaptação de aparelho de
ampliicação sonora individual em indivíduos com issura labiopalatina [dissertação]. Bauru (SP):
Hospital de Reabilitação de anomalias craniofaciais da Universidade de São Paulo; 2007.
23. Heuermann H, Kinkel M, Tchorz J. Comparison
of psychometric properties of the International Outcome Inventory for Hearing Aids (IOI-HA) in various studies. Int J Audiol. 2005;44(2):102-9.
REFERENCES
1. Instituto Brasileiro de Geograia e Estatística
(IBGE). http://www.ibge.gov.br/home/presidencia/ noticias.
2. Ministério da Saúde. Portaria número. 2.073/ GM de 28 de setembro de 2004. Institui a Política Nacional de Saúde Auditiva.
3. Russo ICP, Almeida K. O processo de reabilitação
audiológica do deiciente auditivo idoso. In: MarchesanIQ, Bolafi C, Gomes ICD, ZorziJL.
Tópicos em Fonoaudiologia. São Paulo: Editora Lovise; 1995. p.429-46.
4. Dillon H. Assessing the outcomes of hearing
rehabilitation. In: Dillon, H. Hearing Aids. New York,
Thieme; 2001.p. 95-103.
5. Lacerda CF, Silva LO, Canto RST, Cheik NC.
Efeitos da adaptação às próteses auditivas na qualidade de vida, no equilibrio e no medo da queda em idosos com perda auditiva neurossensorial. Int Arch Otorhinolaryngol. 2012;2(16):156-62.
6. Costa LP, Iório MCM. Próteses auditivas: avaliações objetivas e subjetivas em usuários de ampliicação linear e não-linear. Pró-Fono R Atual
Cient. 2006;2(10):21-30.
7. Arakawa AM, Picolini MM, Sitta EI, Oliveira AN, Bassi AKZ, Bastos JRM et al. A avaliação da satisfação dos usuários de AASI na região Amazônica. Arq Int
Otorrinolaringol. 2010;1(14):38-44.
8. Gnewikow D, Meredith M. Hearing aid outcomes with open and closed- canal ittings. The Hearing
Journal. 2006;11(59):66-72.
9. Mangi C, Armentano UM, Moreira OS, Winter EW. Investigação do grau de satisfação entre usuários de ampliicação monoaural e binaural. Distub.
Comum. 2005;17(3):323-32.
10. Cox RM, Stephens D, Kramer SE. Translations
of the international out come inventory for hearing aids (IOI-HA). Int J Audiol. 2002;41(1):3-26.
11. Cox RM. Assessment of subjective outcome of hearing aid itting: getting the client’s point of view.
Int J Audiol. 2003;42(Suppl1):S90-6.
Received on: June 4, 2013 Accepted on: February 24, 2014
Mailing Address:
Vanessa Schneider Broca Rua: 300, nº 31, centro
Balneário Camboriú –SC – Brasil
CEP: 88330-645