BGD
9, 6095–6127, 2012Linking agricultural crop management
and air quality
E. J. Cooter et al.
Title Page
Abstract Introduction
Conclusions References
Tables Figures
◭ ◮
◭ ◮
Back Close
Full Screen / Esc
Printer-friendly Version Interactive Discussion
Discussion
P
a
per
|
Dis
cussion
P
a
per
|
Discussion
P
a
per
|
Discussio
n
P
a
per
|
Biogeosciences Discuss., 9, 6095–6127, 2012 www.biogeosciences-discuss.net/9/6095/2012/ doi:10.5194/bgd-9-6095-2012
© Author(s) 2012. CC Attribution 3.0 License.
Biogeosciences Discussions
This discussion paper is/has been under review for the journal Biogeosciences (BG). Please refer to the corresponding final paper in BG if available.
Linking agricultural crop management
and air quality models for regional to
national-scale nitrogen assessments
E. J. Cooter1, J. O. Bash1, V. Benson2, and L. Ran3
1
United States Environmental Protection Agency, Office of Research and Development, National Exposure Research Lab, Research Triangle Park, North Carolina, USA
2
Benson Consulting, Columbia, Missouri, USA
3
University of North Carolina, Institute for the Environment, Chapel Hill, North Carolina, USA
Received: 18 April 2012 – Accepted: 19 April 2012 – Published: 29 May 2012
Correspondence to: E. J. Cooter (cooter.ellen@epa.gov)
BGD
9, 6095–6127, 2012Linking agricultural crop management
and air quality
E. J. Cooter et al.
Title Page
Abstract Introduction
Conclusions References
Tables Figures
◭ ◮
◭ ◮
Back Close
Full Screen / Esc
Printer-friendly Version Interactive Discussion
Discussion
P
a
per
|
Dis
cussion
P
a
per
|
Discussion
P
a
per
|
Discussio
n
P
a
per
|
Abstract
While nitrogen (N) is an essential element for life, human population growth and de-mands for energy, transportation and food can lead to excess nitrogen in the environ-ment. A modeling framework is described and implemented, to promote a more inte-grated, process-based and system-level approach to the estimation of ammonia (NH3)
5
emissions resulting from the application of inorganic nitrogen fertilizers to agricultural soils in the United States. The United States Department of Agriculture (USDA) Envi-ronmental Policy Integrated Climate (EPIC) model is used to simulate plant demand-driven fertilizer applications to commercial cropland throughout the continental US. This information is coupled with a process-based air quality model to produce
continental-10
scale NH3 emission estimates. Regional cropland NH3 emissions are driven by the timing and amount of fertilizer applied, local meteorology, and ambient air concen-trations. An evaluation of EPIC-simulated crop management activities associated with fertilizer application at planting compared with similar USDA state-level event estimates shows temporally progressive spatial patterns that agree well with one another. EPIC
15
annual inorganic fertilizer application amounts also agree well with reported spatial pat-terns produced by others, but domain-wide the EPIC values are biased about 6 % low. Preliminary application of the integrated fertilizer application and air quality modeling system produces a modified geospatial pattern of seasonal NH3 emissions that
im-proves current simulations of observed atmospheric nitrate concentrations. This
model-20
ing framework provides a more dynamic, flexible, and spatially and temporally resolved estimate of NH3emissions than previous factor-based NH3 inventories, and will
BGD
9, 6095–6127, 2012Linking agricultural crop management
and air quality
E. J. Cooter et al.
Title Page
Abstract Introduction
Conclusions References
Tables Figures
◭ ◮
◭ ◮
Back Close
Full Screen / Esc
Printer-friendly Version Interactive Discussion
Discussion
P
a
per
|
Dis
cussion
P
a
per
|
Discussion
P
a
per
|
Discussio
n
P
a
per
|
1 Background and Introduction
Nitrogen (N) is an essential element required for the growth and maintenance of all biological tissues, but human population growth and increased demands for energy, transportation and food have lead to increased N production (Galloway et al., 2008). While beneficial in N limited systems, excess N associated with these trends can
ad-5
versely impact both terrestrial and aquatic ecosystems (Lovett and Tear, 2008). In ad-dition to implications for ecosystem health and sustainability, atmospheric ammonia (NH3) gas will neutralize atmospheric acids, most notably sulfuric and nitric acid, to
form ammonium (NH+4) aerosols, a major constituent of fine particulate matter (PM2.5)
(Nenes et al., 1999), which can negatively impact human health (Pope and Dockery,
10
2006), reduce visibility and affect atmospheric radiative forcing (Hertel et al., 2011). The European Nitrogen Assessment (Sutton et al., 2011) emphasizes the need for in-tegrated, multimedia and transdisciplinary approaches to communicate effectively the risks associated with the five key societal threats from excess reactive nitrogen (i.e., water quality, air quality, greenhouse balance, ecosystems and biodiversity, and soil
15
quality). Linking an agro-ecosystem model that includes cropland management deci-sions with a regional air-quality model to simulate continental-scale bidirectional NH3
fluxes marks a significant step forward towards a more systems-level framework for N assessment.
The 2008 United States Environmental Protection Agency (EPA) National Emissions
20
Inventory (NEI) (http://www.epa.gov/ttn/chief/eiinformation.html) estimates that 83 % of US NH3emissions are associated with commercial crop and livestock production. Am-monia emissions originating from soils receiving commercial N fertilizer applications account for 33 % of all agricultural NH3emissions. This inventory was developed from
a combination of emission factors and inverse modeling (Gilliland et al., 2006) that
25
assumes unidirectional emission from soil and vegetation canopies; however, NH3 is
BGD
9, 6095–6127, 2012Linking agricultural crop management
and air quality
E. J. Cooter et al.
Title Page
Abstract Introduction
Conclusions References
Tables Figures
◭ ◮
◭ ◮
Back Close
Full Screen / Esc
Printer-friendly Version Interactive Discussion
Discussion
P
a
per
|
Dis
cussion
P
a
per
|
Discussion
P
a
per
|
Discussio
n
P
a
per
|
that inclusion of bidirectional NH3 behavior will alter regional nitrogen budget
simula-tions in ways that are important for ecosystem and human health (Dennis et al., 2010). The bidirectional (i.e., compensation point) approach described in Sutton et al. (1998) and Nemitz et al. (2001) employs a resistance-based flux model that com-pares the equilibrium concentrations of NH+4 and NH3in leaf apoplast to ambient NH3
5
air concentrations. Cooter et al. (2010) confirm that this same paradigm can simulate the measured magnitude and temporal variability of post application inorganic fertilizer NH3emissions from grain-corn soils in the US Southern Coastal Plain. This approach promises to improve current uni-directional factor-based inventories, but its national scale implementation is challenging. The foremost challenge is development of
fertil-10
izer management information on the temporal and spatial scales needed to support the dynamic regional air quality models that are used to perform regional and national scale N budget analyses. This information should reflect a range of current and alter-native farm management actions that will support analysis of N budget response to future policy and alternative climate conditions. In addition, since future climate may
15
require innovative management adaptation strategies, these estimates must rely min-imally on historical data (i.e., should be process driven) and should respond to intra-annual, inter-annual and multi-decadal weather and climate as well as land use and land cover changes. The discussion that follows describes the development of such a fertilizer simulation system, evaluates two key aspects of this system, and closes
20
with an example of the integration of this information into a regional air quality model application with bidirectional ammonia flux.
2 The agricultural fertilizer modeling system
The primary objective of fertilizer application in the US is to maximize economic re-turn related to commodity production. Crop- and region-specific fertilizer management
25
BGD
9, 6095–6127, 2012Linking agricultural crop management
and air quality
E. J. Cooter et al.
Title Page
Abstract Introduction
Conclusions References
Tables Figures
◭ ◮
◭ ◮
Back Close
Full Screen / Esc
Printer-friendly Version Interactive Discussion
Discussion
P
a
per
|
Dis
cussion
P
a
per
|
Discussion
P
a
per
|
Discussio
n
P
a
per
|
of the fertilizer is needed to properly link NH3fertilizer application with evasion. Models
that simulate the affect of both farm management practices as well as biogeochemi-cal processes on soil nitrogen concentrations can be characterized as being process, empirical or semi-empirical process based. Process-based models attempt to simulate processes at the most fundamental level and are extremely useful for basic research
5
or exploratory site-specific studies that seek to better understand the nature of these processes. Empirical models simulate many of the same processes through parame-terizations requiring less detailed input information. These models are appropriate for applications that ask broad, “what-if” questions. Semi-empirical process models use more detailed parameterizations based on process research, still support “what-if”
sce-10
nario studies, but are detailed enough to highlight specific areas in need of additional process-level analysis. Given this characterization, the Environmental Policy Integrated Climate (EPIC) model was selected for this application.
EPIC is a semi-empirical biogeochemical process model originally developed by the United States Department of Agriculture (USDA) in the early 1980’s to assess the
ef-15
fect of wind and water erosion on crop productivity (Williams et al., 1984, 2008). It is a field-scale model, but fields can extend up to 100 ha in area. In the beginning, EPIC’s focus was the characterization of the physical processes associated with ero-sion in order to simulate management solutions that maximize crop production while reducing soil and nutrient losses. Model options included characterization of various
20
tillage practices, e.g., conventional, reduced-till, no-till, contour plowing, and engineer-ing changes such as the construction of terraces, installation of tile drainage, buffer strips and wind breaks. It included a heat-unit driven above- and below-ground plant growth model, soil hydrology and soil heat budgets for multiple soil layers of vari-able thickness. EPIC also contained an economic component that supported
farm-25
BGD
9, 6095–6127, 2012Linking agricultural crop management
and air quality
E. J. Cooter et al.
Title Page
Abstract Introduction
Conclusions References
Tables Figures
◭ ◮
◭ ◮
Back Close
Full Screen / Esc
Printer-friendly Version Interactive Discussion
Discussion
P
a
per
|
Dis
cussion
P
a
per
|
Discussion
P
a
per
|
Discussio
n
P
a
per
|
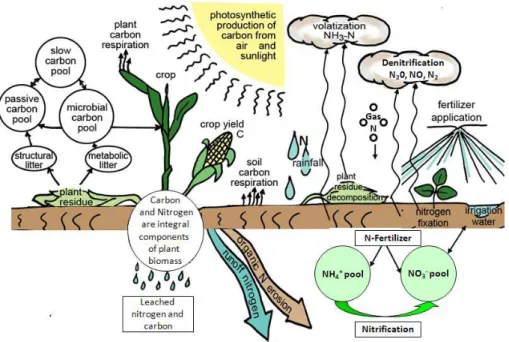
(Izaurralde et al., 2006; Parton et al., 1994; Vitousek et al., 1994). Details of these modifications and a description of N treatment is provided in Appendix A. Figure 1 illustrates the current EPIC biogeochemical configuration for N and Carbon (C). As noted in Izaurralde et al. (2006), a unique aspect of EPIC is that it treats explicitly changes in the soil matrix (density, porosity and water retention) as well as changes in
5
soil constituents, such as organic C, thereby allowing feedback mechanisms to oper-ate. In this way, EPIC is well suited for simulation of scenarios such as land use, land management and climate change in which soil moisture supply and soil matrix prop-erties vary concurrently. The current EPIC community code can be downloaded from http://epicapex.brc.tamus.edu. A relatively recent bibliography of EPIC publications is
10
available at http://www.card.iastate.edu/environment/items/EPIC reference list.pdf.
2.1 EPIC inputs
EPIC requires input information regarding soils, crop area, crop management and weather. Although our goal is to be as spatially explicit as possible, we recognize the limitations of available data and the spatial scale (regional) of the application.
15
A multi-scale approach was adopted with crop management characterized at the coars-est scale (∼104km2), followed by crops and soil/hydrology (∼103km2), and weather (∼102km2). Rather than targeting behaviors of a specific, potentially unique, farm-firm that might have only a limited spatial scale of influence, this approach facilitates the characterization of broad trends in current and future crop management and fertilizer
20
BGD
9, 6095–6127, 2012Linking agricultural crop management
and air quality
E. J. Cooter et al.
Title Page
Abstract Introduction
Conclusions References
Tables Figures
◭ ◮
◭ ◮
Back Close
Full Screen / Esc
Printer-friendly Version Interactive Discussion
Discussion
P
a
per
|
Dis
cussion
P
a
per
|
Discussion
P
a
per
|
Discussio
n
P
a
per
|
2.1.1 Crop management
Figure 2 illustrates the USDA Farm Production Regions used to characterized EPIC management practices. Each region defines a geographic area in which crops and cropping practices are similar. The USDA National Agricultural Statistical Service (NASS) Agricultural Resource Management Survey (ARMS) (http://www.ers.usda.gov/
5
Data/arms/) contains information regarding the number, type and general schedule of mechanical operations for each crop grown in each production area. In EPIC, the timing of mechanical operations, e.g., tilling, planting, harvesting are prescribed by the user or are “scheduled” using accumulated heat units. Resource additions such as fertilizer and irrigation can also be prescribed or triggered in response to “stress” conditions.
10
EPIC modifies optimal plant growth and productivity by temperature, water, aeration, nutrient and aluminum toxicity stresses (Williams et al., 2008). The present application uses a combination of prescribed and automatically scheduled fertilizer and irrigation operations. The prescribed application approach is similar to that reported in Goebes et al. (2003), with some important differences that increase the physical detail as well
15
as the temporal and spatial resolution of these scenarios. Appendix B contains a de-tailed description of this process.
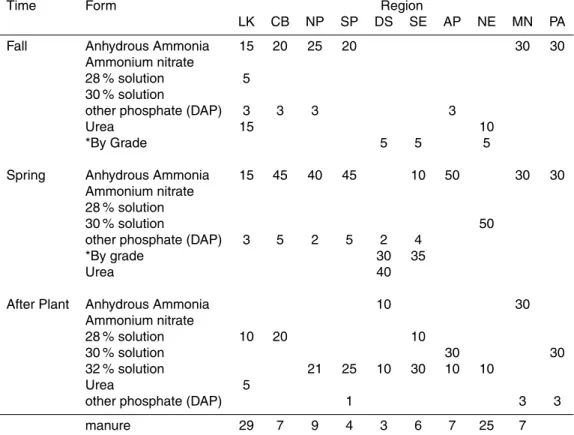
Knowledge of the reactive N form applied and the method of application are impor-tant to the characterization of NH3 evasion dynamics. Table 1 provides an example of this information for the present application. While timing is indicated by “fall, spring and
20
post-plant”, specific application dates for each crop and model grid are estimated by EPIC. Overall, anhydrous ammonia is the N form of choice for US grain corn produc-ers, but other forms also have a role, and dominant form varies by time of year and geographic region. In the US CornBelt (CB), 45 % of annual grain corn N needs are met using anhydrous ammonia (injected liquid) in the Spring, while only 15 % of Lake
25
BGD
9, 6095–6127, 2012Linking agricultural crop management
and air quality
E. J. Cooter et al.
Title Page
Abstract Introduction
Conclusions References
Tables Figures
◭ ◮
◭ ◮
Back Close
Full Screen / Esc
Printer-friendly Version Interactive Discussion
Discussion
P
a
per
|
Dis
cussion
P
a
per
|
Discussion
P
a
per
|
Discussio
n
P
a
per
|
is applied at or prior to planting (never after the crop has emerged). In contrast, 29 % of Lake States and 25 % of Northeastern (NE) annual grain corn N demand are met through manure.
2.1.2 Crops
Table 2 lists the crops that are explicitly modeled for this application. A coarse,
5
County-level spatial crop assignment is made using the USDA Census of Agriculture (http://www.agcensus.usda.gov/Publications). There are more than 3000 US counties ranging in size from 67 km2 in the Eastern US to 51 800 km2 in the West. The 2001 USGS National Land Cover Database (NLCD) is used to provide additional spatial de-tail (http://landcover.usgs.gov/uslandcover.php) (Homer et al., 2007). This is a
satel-10
lite product for the US that provides 30 m pixel-scale information for 29 aggregate land use categories. Accuracy of this product is described in Wickham et al. (2010). In the future (post 2010), the US Department of Agriculture Crop Data Layer (CDL) (http://www.nass.usda.gov/research/Cropland/SARS1a.htm) may offer even more de-tailed characterization of agricultural crop species distribution. Landcover data for
15
Canada and Mexico is estimated from the Moderate Resolution Imaging Spectrora-diometer (MODIS; http://duckwater.bu.edu/lc/mod12q1.html).
2.1.3 Soil information
The National Resources Inventory (NRI, http://www.nrcs.usda.gov/technical/nri) links crops to soils within 8-digit Hydrological Cataloging Units (sub basins or HUCs). A HUC
20
is a geographic area representing part or all of a surface drainage basin, a combination of drainage basins, or a distinct hydrologic feature. There are 150 000 8-digit HUCs in the Continental US with an average extent of∼1800 km2. For this application, only the dominant (with respect to area) soil associated with each crop is identified. The min-imum soil inputs required by EPIC includes soil layer depth, bulk density, pH, organic
25
BGD
9, 6095–6127, 2012Linking agricultural crop management
and air quality
E. J. Cooter et al.
Title Page
Abstract Introduction
Conclusions References
Tables Figures
◭ ◮
◭ ◮
Back Close
Full Screen / Esc
Printer-friendly Version Interactive Discussion
Discussion
P
a
per
|
Dis
cussion
P
a
per
|
Discussion
P
a
per
|
Discussio
n
P
a
per
|
assigned to grid cells in Canada and Mexico pending acquisition of more representative information.
Current soil structure information provided as input to EPIC may not reflect the de-sired land management scenario, and so EPIC is run for a 25-yr spin-up period to allow nutrient pools and soil characteristics to adjust to the defined management
en-5
vironment. The average annual plant demand N determined during the last 5-yr of this spin-up is used to guide initial fertilizer scenario development and to provide ini-tial conditions for simulation of year-specific weather. This ability to adjust the physical and chemical site characteristics for representation of changing landuse and cropping practices is critical to the modeling system’s value for alternative-future analyses.
10
2.1.4 Weather
EPIC requires time series of radiation, maximum and minimum temperature, precipi-tation, mean relative humidity and mean 10 m wind speed conditions. These data can come from local observations, or may be generated by a weather simulator driven by statistical parameters describing climate conditions (Williams et al., 2008).
Rec-15
ommended practice for the spin-up simulation (see Sect. 2.1.3) is to use the weather simulator and the climatological characteristics of the closest weather station to each EPIC model grid cell selected from a set of nearly 1000 historical locations. Results of the last 5 yr of this spin-up were used for system development, quality control and preliminary evaluation (see Sect. 3). In the future, year-specific gridded weather
condi-20
tions generated by numerical models such as the Weather Research Forecast Model (WRF) (Skamarock et al., 2008) will be used to ensure greater consistency between farm management and regional air quality models. In addition, time series of daily wet and dry deposition from these models will be input to explore the interplay between fertilizer N additions and atmospheric sources of N.
BGD
9, 6095–6127, 2012Linking agricultural crop management
and air quality
E. J. Cooter et al.
Title Page
Abstract Introduction
Conclusions References
Tables Figures
◭ ◮
◭ ◮
Back Close
Full Screen / Esc
Printer-friendly Version Interactive Discussion
Discussion
P
a
per
|
Dis
cussion
P
a
per
|
Discussion
P
a
per
|
Discussio
n
P
a
per
|
2.2 Example EPIC results
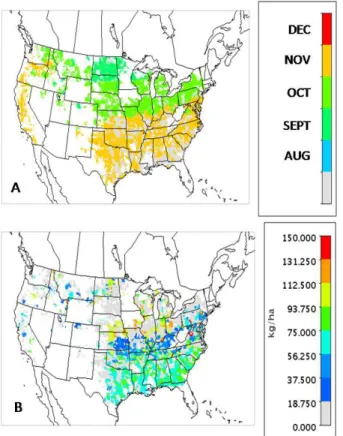
Appendix C contains an example scenario created when Sect. 2.1 inputs are combined to describe the emission environment for grain corn in the Southeast production region. Figure 3 illustrates the 5-yr average EPIC-estimated date of first fertilizer application and application rate for winter wheat across the US. Winter wheat is planted in the fall,
5
undergoes vernalization, resumes growth in the spring and then is harvested in the late spring or early summer. The grey areas in Fig. 3a indicate grid cells in which the first fertilizer application is not simulated as occurring until after vernalization. Figure 3b indicates the rate for all first applications for any grid cell containing 16 or more ha of wheat. A value of zero indicates that wheat is reported in a grid cell, but no fertilizer is
10
applied.
3 Evaluation of continental-scale EPIC simulations
3.1 Application timing
Peak NH3 emissions are tightly coupled to the timing and amount of fertilizer appli-cation. Periodic national-scale management surveys report relative application timing,
15
e.g., pre-plant, at plant, post-plant and the average number of applications, but date-specific application reports are rarely available. The most commonly available infor-mation for a variety of crops is date of planting and harvest. As stated previously, the majority of inorganic N is applied just prior to, or at planting so the proper characteriza-tion of this event is key. Harvest date, including the removal of some or all crop residue,
20
impacts soil temperature and soil moisture, which influence subsequent nutrient trans-formations as well as rates and timing of fertilizer applied to fall-sown crops.
Weekly crop progress data, reported as a fraction of crop area within a state or county on which the operation has been completed, is available in digitized form from the National Agricultural Statistical Services (http://www.nass.usda.gov/Data and
BGD
9, 6095–6127, 2012Linking agricultural crop management
and air quality
E. J. Cooter et al.
Title Page
Abstract Introduction
Conclusions References
Tables Figures
◭ ◮
◭ ◮
Back Close
Full Screen / Esc
Printer-friendly Version Interactive Discussion
Discussion
P
a
per
|
Dis
cussion
P
a
per
|
Discussion
P
a
per
|
Discussio
n
P
a
per
|
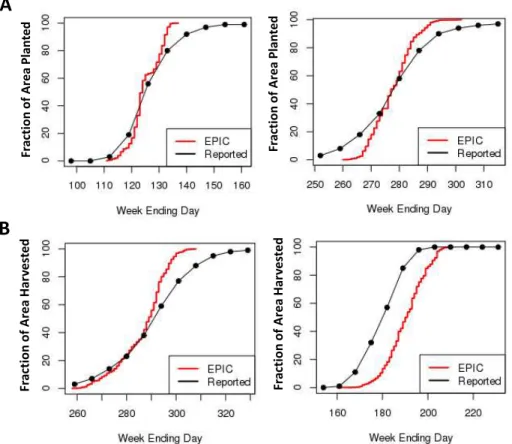
statistics/Quick Stats). A reporting week runs from Monday through Sunday, with re-ports beginning the week ending the first Sunday in April (week #13). First, the mean planting and harvest dates from the last 5 EPIC spin-up years for each grid cell are assigned to crop progress weekly “bins.” Next, the fraction of crop-specific area in each bin is estimated and is summed through time. Figure 4a illustrates 5-yr USDA reported
5
and EPIC estimated planting date distributions for rainfed grain corn in Iowa (Corn Belt) and rainfed winter wheat in Kansas (Northern Plains). Figure 4b shows a similar com-parison for harvest dates. While Fig. 4 results show good agreement with observations, relationships for other crops and locations require further refinement.
3.2 Application amount
10
A second key aspect of EPIC for use in process-based air-quality models is the amount of fertilizer applied. This is explored through comparison of the EPIC simulation results to three alternative annual application estimates. Figure 5a shows the distribution of EPIC 5-yr average annual fertilizer applications to agricultural lands in each US County based exclusively on crop N demand. A ca. 2002 timeframe is a common US air
qual-15
ity baseline year and so it is used in this initial analysis. County total on-farm use is determined as shown in Eq (1).
Use=
n
X
i=1 crop
X
j=1
(Ni j−manurej)(cfi j)14 400 (1)
where Use is the county total inorganic N application in kg,nis the number of model grid cells contained within the county, crop is the number of crops contained within the
20
grid cell, Ni jis the 5-yr average plant-demand N in kg ha−1, manure is the portion of that demand met through manure application (kg ha−1) (e.g., Table 1) and cf
i jis the fraction
of the grid cell assigned to cropj. The total agricultural crop or pasture area in each grid cell is constrained to NLCD land use classes 81 and 82. These totals are fraction-ally distributed by crop species as suggested by the 2002 USDA Census of Agriculture.
BGD
9, 6095–6127, 2012Linking agricultural crop management
and air quality
E. J. Cooter et al.
Title Page
Abstract Introduction
Conclusions References
Tables Figures
◭ ◮
◭ ◮
Back Close
Full Screen / Esc
Printer-friendly Version Interactive Discussion
Discussion
P
a
per
|
Dis
cussion
P
a
per
|
Discussion
P
a
per
|
Discussio
n
P
a
per
|
Open counties contain no agricultural or hay/pasture landuse (via NLCD). Figure 5b, d show patterns of fertilizer use from the Ruddy et al. (2006) United States Geological Survey (USGS) analysis and the USEPA National Emissions Inventory (NEI). Both the USGS and USEPA estimates use Association of American Plant Food Control Officials (AAPFCO) data for direct farmer sales (e.g., AAPFCO, 2002), but each Agency
pro-5
cesses these data differently. The USGS estimate (Fig. 5b) allocates the state-level AAPFCO data to counties using USDA Survey-based estimates of farmer fertilizer ex-penditures. If no farmer expenditures are reported, a valid value of zero is assigned. The USEPA estimates (Fig. 5d) are annual sums generated by Carnegie Mellon Univer-sity (CMU) (Goebes et al., 2003) that have been reallocated to aggregate agricultural
10
land use classes. The original CMU estimate uses county level AAPFCO reports for the 26 available states and the USGS state allocation method elsewhere. If no sales are reported for a county in a state that reports county sales, a value of zero is as-signed to that county. The USEPA inventory does not distinguish between agricultural and non-agricultural fertilizer sales, and values shown in Fig. 5d include both sources.
15
A domain-wide comparison of the USEPA and USGS values for farm plus non-farm use agree to within about 6 %. Clearly, the USGS and USEPA estimates are not inde-pendent, and so a third Survey-based estimated is provided. Figure 5c is based on the 1997 USDA Agricultural Practice Survey (Potter et al., 2006). Gray areas in this map represent federally owned lands or areas in which there were too few survey responses
20
to meet non-disclosure requirements.
The Fig. 5a geospatial pattern, based solely on simulated plant N demand, appears to be a reasonable hybrid solution of sales and survey results. Estimated N manure applications have been removed from the EPIC total. Overall, EPIC results are about 7 % below USGS domain-wide totals, but tend to be higher than USGS estimates in
25
BGD
9, 6095–6127, 2012Linking agricultural crop management
and air quality
E. J. Cooter et al.
Title Page
Abstract Introduction
Conclusions References
Tables Figures
◭ ◮
◭ ◮
Back Close
Full Screen / Esc
Printer-friendly Version Interactive Discussion
Discussion
P
a
per
|
Dis
cussion
P
a
per
|
Discussion
P
a
per
|
Discussio
n
P
a
per
|
production uncertainty is not included. It is unclear that any one Fig. 5 estimate is inherently superior to another, but the EPIC rates appear to lie within the range of published estimate uncertainty (Sabota et al., 2012). The greatest advantage of the EPIC estimate over those derived from sales or survey-based information is that it is process-driven and does not rely on historical observation. This characteristic supports
5
the use of EPIC to gage physically-driven N demand response to a variety of alternative environmental or policy scenarios that may or may not have historical analogs. Another means of determining the value of the EPIC estimates is to use them in an air quality modeling application, and to compare those results to atmospheric observations. An example of such an application is presented in Sect. 4.
10
4 Coupling to a regional air quality model
The system developed in Sect. 2 and evaluated in Sect. 3 provides management and process-driven fertilizer application rate and timing information at spatial and tempo-ral scales appropriate for the bidirectional version of the Community Multi-Scale Air Quality (CMAQ) model version 5.0 (Pleim et al., 2012), which makes use of the Nemitz
15
et al. (2001) two layer resistance model for bidirectional NH3exchange. A brief
descrip-tion of this implementadescrip-tion and example results are presented below. A more complete presentation of results is provided in Bash et al. (2012).
The CMAQ 5.0 modeling system employs a 3-dimensional Eulerian modeling ap-proach to address air quality issues such as tropospheric ozone, fine particles, acid
20
deposition and visibility degradation (Byun and Schere, 2006). The CMAQ modeling system is a comprehensive, state-of-the science, “one atmosphere” system that in-cludes a meteorological model to describe atmospheric conditions, emission models for anthropogenic and natural emissions that are released into the atmosphere, and a chemical-transport modeling system (CTM) to simulate chemical transformations,
25
BGD
9, 6095–6127, 2012Linking agricultural crop management
and air quality
E. J. Cooter et al.
Title Page
Abstract Introduction
Conclusions References
Tables Figures
◭ ◮
◭ ◮
Back Close
Full Screen / Esc
Printer-friendly Version Interactive Discussion
Discussion
P
a
per
|
Dis
cussion
P
a
per
|
Discussion
P
a
per
|
Discussio
n
P
a
per
|
allocated emissions from point, nonpoint and mobile source inventories. Emissions from inorganic fertilizer applications were removed from the inventories when using the CMAQ NH3bidirectional flux option to avoid double counting. The CMAQ CTM
param-eterizes wet and dry deposition processes, transport due to horizontal and vertical ad-vection and diffusion, and the dynamic partitioning of pollutants, including NH3, to fine
5
and course aerosols. Changes in one pollutant can influence the concentrations and sinks of other pollutants directly or indirectly through chemistry, transport and aerosol processes.
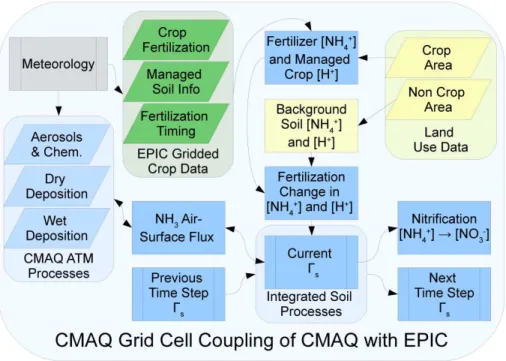
An example of the coupling of EPIC output and processes in each model time step in CMAQ with bidirectional exchange is shown in Fig. 6. Crop specific EPIC simulated
10
fertilization rates, timing, method, and managed soil pH values are used to estimate [NH+4] and the corresponding [H+] changes for each crop assigned to the NLCD agri-cultural area fraction of the grid cell. The EPIC fertilizer application method information is used to allocate the fertilizer to the plow depth for injected or knifed-in applications, or to the surface for spray or drip applications. These inputs are combined with the grid
15
cell crop distribution from BELD4, a standard CMAQ input data set that links NLCD-constrained Census of Agricultural crop areas to CMAQ grid cells, and supports bio-genic emission estimation for 230 natural and managed vegetation species. The result is a temporally and spatially detailed description of the increase in soil emission poten-tial,Γs, due to fertilizer application in agricultural land use categories. Following Walker
20
et al. (2006), a non-agriculturalΓsof 20 is used for other land covers. Ammonia evasion
and NH+4 nitrification losses were modeled for each CMAQ soil layer, leading to a dy-namic, process-driven estimate ofΓstemporal decay. Nitrification losses were modeled
within CMAQ as in EPIC (Williams et al., 2008), and NH3evasion was modeled using
the CMAQ bidirectional exchange based on the two layer resistance model of Nemitz
25
BGD
9, 6095–6127, 2012Linking agricultural crop management
and air quality
E. J. Cooter et al.
Title Page
Abstract Introduction
Conclusions References
Tables Figures
◭ ◮
◭ ◮
Back Close
Full Screen / Esc
Printer-friendly Version Interactive Discussion
Discussion
P
a
per
|
Dis
cussion
P
a
per
|
Discussion
P
a
per
|
Discussio
n
P
a
per
|
the soil NH+4 concentrations for agricultural land use categories, andΓs is updated to
reflect evasion, deposition and nitrification processes. The temporal dynamics of Γs
following fertilization is driven by the evasive and nitrification losses of NH+4 in the soil rather than a decay time constant (Massad et al., 2010) or seasonalΓsfactors (Zhang
et al., 2010).
5
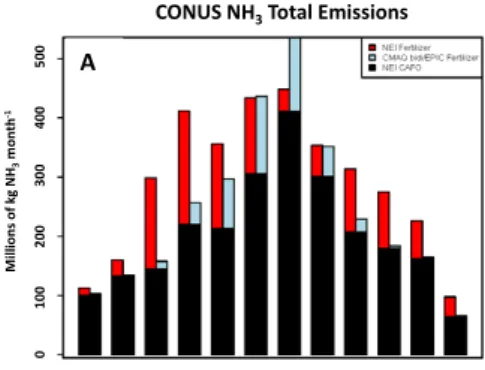
Figure 7a shows estimated annual bi-directional CMAQ 5.0 NH3emissions for 2002 compared to the factor-based USEPA NEI ammonia emissions estimates. Overall, CMAQ annual emissions are approximately one-half of the NEI estimates. The largest spring and fall emission reductions are largely in the Upper Midwest (Corn Belt), where precipitation biases resulted in an overestimation in the NEI NH3 emission estimate
10
(Gilliland et al., 2006). Elsewhere, differences are driven by the timing of spring and fall fertilizer applications and temperature dependence on the compensation point in the bidirectional model. Reductions in the estimates of the PM2.5nitrate (NO−
3) aerosol
concentration biases at urban Chemical Speciation Network (CSN, Fig. 7b) and rural Interagency monitoring of PROtected Environments (IMPROVE, Fig. 7c) sites support
15
these shifts in the continental US NH3emissions. These bidirectional NH3CMAQ diff er-ences reflect the simulation of dynamic, weather-driven spring and fall application rates and dates in EPIC as opposed to fixed application rates and activity windows. In ad-dition, bi-directional exchange in CMAQ is a function of grid cell specific weather and ammonia-ammonium Henry’s Law and solubility equilibria conditions (Nemitz et al.,
20
2000), while factor-based estimates simulate emissions temperature response by im-posing a fixed seasonal distribution and/or seasonal and spatial distributions based on inverse modeling that can incorporate model biases into the emission estimates. Fur-ther regional emission and aerosol estimate improvement is expected when CMAQ is provided with year-specific rather than 5-yr average EPIC inputs.
BGD
9, 6095–6127, 2012Linking agricultural crop management
and air quality
E. J. Cooter et al.
Title Page
Abstract Introduction
Conclusions References
Tables Figures
◭ ◮
◭ ◮
Back Close
Full Screen / Esc
Printer-friendly Version Interactive Discussion
Discussion
P
a
per
|
Dis
cussion
P
a
per
|
Discussion
P
a
per
|
Discussio
n
P
a
per
|
5 Conclusions
A methodology has been described that facilitates assessment of the process-driven regional-to-national response of agricultural soil emissions of NH3 to changing land use, policy and climate under a set of user-defined fertilizer management conditions and nationally consistent, spatially and temporally resolved inputs. A preliminary
eval-5
uation of 5-yr average results suggests that simulated applications associated with, or timed relative to planting date should fall within 10 days of observed dates, and cap-ture regional and national patterns of sales and survey based annual application rates. Use of the temporal and spatial allocation approach such as those reported in Gobes et al. (2003) have supported ammonia emission inventory improvement over previous,
10
static average values. The approach described here builds on this foundation by adding temporal and spatial detail through a flexible, process-based approach that explicitly in-cludes human behavioral response i.e., management to National policy and regional climate change analyses.
Future system improvements will include refinement of planting and harvest dates to
15
support evaluation of system responses to year-specific weather conditions, more de-tailed fertilizer form, soil and management information for Northern Mexico and South-ern Canada, and the addition of missing soil processes such as mineralization to CMAQ. Massad et al. (2010) suggest that this process could be a significant factor controlling temporal patterns ofΓs in some agricultural systems. Inclusion of
miner-20
alization in CMAQ will provide a more complete systems-level characterization of N behavior in the environment. A user-friendly interface, the Fertilizer Emission Scenario Tool for CMAQ (FEST-C) is being developed to facilitate generation IO/API formatted fertilizer application rate information on a daily basis for the Continental US domain and a 12 km×12 km rectangular grid resolution. FEST-C should be released to the air
25
BGD
9, 6095–6127, 2012Linking agricultural crop management
and air quality
E. J. Cooter et al.
Title Page
Abstract Introduction
Conclusions References
Tables Figures
◭ ◮
◭ ◮
Back Close
Full Screen / Esc
Printer-friendly Version Interactive Discussion
Discussion
P
a
per
|
Dis
cussion
P
a
per
|
Discussion
P
a
per
|
Discussio
n
P
a
per
|
generation of this information for any gridded US CMAQ domain and resolution for which consistent hourly weather and landcover information is available.
Appendix A
EPIC biogeochemical treatment of N and C
EPICv0509 splits soil organic C and N into three compartments: microbial biomass,
5
slow humus and passive humus (Williams et al., 2008). Organic residues added to the soil surface or belowground are split into metabolic and structural litter compart-ments as a function of C and N content. Following the CENTURY (Parton et al., 1994) approach, EPIC goes on to include the use of linear partition coefficients and soil wa-ter content to calculate movement as modified by sorption, which are used to move
10
organic materials from surface litter to subsurface layers; temperature and water con-trols affecting transformation rates are calculated internally in EPIC; the surface litter fraction in EPIC has a slow compartment in addition to metabolic and structural litter components; and lignin concentration is modeled as a sigmoidal function of plant age (Izaurralde et al., 2006). EPICv0509 has been modified further such that the upper 15
15
to 45 cm of the soil layer reflects the impact of specific tillage practices on biogeochem-ical process rates.
The N budget includes inputs from fertilizer application (NH3 or NH+4 in solid or liq-uid form), N fixation by legumes and decaying organic matter, and will be modified to accept time series of wet and dry atmospheric deposition of oxidized and reduced N.
20
EPIC simulates the transformation of NH+4 to NO−
3 through nitrification. Nitrate
BGD
9, 6095–6127, 2012Linking agricultural crop management
and air quality
E. J. Cooter et al.
Title Page
Abstract Introduction
Conclusions References
Tables Figures
◭ ◮
◭ ◮
Back Close
Full Screen / Esc
Printer-friendly Version Interactive Discussion
Discussion
P
a
per
|
Dis
cussion
P
a
per
|
Discussion
P
a
per
|
Discussio
n
P
a
per
|
Appendix B
Fertilizer application scenario development
In addition to USDA data bases and fertilizer sales data noted in Goebes et al. (2003), expert knowledge is used to sensibly allocated phosphorus (P) and N. In most cases, the majority of N is applied immediately before or at crop planting. Prior to the
grow-5
ing season, a farmer has limited a priori information regarding future market price and weather and so these decisions tend to be based on previous experience with the goal of maximum production, i.e., climatology. For each crop and US State, Goebes et al. (2003) assign a fixed pre-plant allocation, applied during a fixed window lasting several weeks to 2 months across all simulation years. For the present application,
10
for each 12 km by 12 km grid-cell and crop, the amount of N initially applied is a fixed fraction of an annual EPIC 5-yr climatological average amount, but the date of ap-plication will vary with crop, crop variety, local soil and weather conditions leading to more spatially and temporally resolved application estimates. The N form used dictates the equipment used to apply the fertilizer, the depth of application and application
tim-15
ing, which in turn affects subsequent volatilization and other biogeochemical process rates as well as surface and sub-surface losses. The fraction-of-annual-total for each fertilizer form is distributed to meet crop N demand in a production region based on documented crop management practices and yield value. For example, more costly N forms are assigned to higher-value crops. When crop demand exceeds inorganic
agri-20
cultural N sales (AAPFCO, 2002), national estimates of regional organic (manure) N use by major commercial crop are consulted. Different manure sources exhibit different biogeochemical behaviors. For this application a single, dominant manure source is as-sumed for each production region, e.g., poultry litter in the Southeastern US, dairy ma-nure in the Northeast, etc. The present scenario reflects market conditions for a base
25
BGD
9, 6095–6127, 2012Linking agricultural crop management
and air quality
E. J. Cooter et al.
Title Page
Abstract Introduction
Conclusions References
Tables Figures
◭ ◮
◭ ◮
Back Close
Full Screen / Esc
Printer-friendly Version Interactive Discussion
Discussion
P
a
per
|
Dis
cussion
P
a
per
|
Discussion
P
a
per
|
Discussio
n
P
a
per
|
National policy directives, or alternative sales data could be used to modify these initial scenarios.
Goebes et al. (2003) assume that post-planting applications take place in a window 1 month after planting. In the present EPIC application, post-planting fertilizer applica-tions use the “automatic” option, with each application defined as a region and
crop-5
specific fraction of 5-yr average annual use. If a second application is triggered, the amount applied for a specific grid and crop is a fixed fraction of the annual total, but the timing will vary with crop demand, which is a function of local soil and weather condi-tions. This avoids the simulation of an unrealistic number of small fertilizer applications as well as too large an area receiving an application on the same day. If drought or
10
other extreme conditions exist such that crop N demand is minimal, no second appli-cation will occur. In most cases, appliappli-cations cease once the crop has reached 50 % of maturity. A third application is possible if N losses or crop demands are particularly high.
Fertilizer is applied to hay/pasture areas receiving irrigation to support 3 cuttings per
15
model year, while rainfed production systems are assumed to support one hay cut-ting, followed by livestock grazing. Stocking rates and subsequent manure introduction are determined for each model grid cell as a function of potential evapotranspiration and precipitation. Fescue hay is simulated north of 35◦ latitude or 1500 m elevation. Bermuda hay is simulated elsewhere.
20
Appendix C
An example scenario
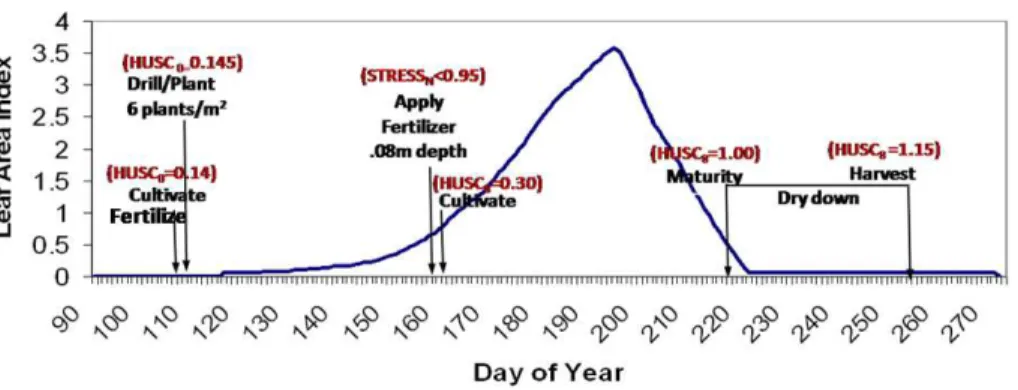
Figure C1 presents an example of an EPIC management scenario for grain corn in a Southeastern Farm Production Area grid cell. Prior to planting, heat units accumu-late using a base temperature of 0◦C. On a climatological basis, there are 5710
an-25
BGD
9, 6095–6127, 2012Linking agricultural crop management
and air quality
E. J. Cooter et al.
Title Page
Abstract Introduction
Conclusions References
Tables Figures
◭ ◮
◭ ◮
Back Close
Full Screen / Esc
Printer-friendly Version Interactive Discussion
Discussion
P
a
per
|
Dis
cussion
P
a
per
|
Discussion
P
a
per
|
Discussio
n
P
a
per
|
variability is simulated by referencing a particular year to climatological conditions. In this production area, corn farmers perform an initial cultivation prior to planting. Cultiva-tion depth is 0.1 m, with 30 % soil mixing efficiency, resulting in a surface roughness of 20 mm. Corn variety selection reflects the climatological growing season length. If soils are sufficiently warm for germination to occur, and are dry enough to support heavy
5
machinery, corn is then planted (drilled) at a density of 6 plants m−2. A 10 % soil mix-ing efficiency produces a surface roughness of 10 mm. After the crop is planted, heat units are accumulated using a crop and variety appropriate heat unit base, in this case 8◦C. Additional operations are “scheduled” by comparing year-specific accumulations against a climatological time-to-maturity total, in this case 1680. By day 162, the model
10
determines that there is less than 95 % of the nitrogen present that is needed for op-timal production and an N application is triggered. A second cultivation is scheduled when 30 % of growing season heat units have accumulated. The crop reaches matu-rity when the crop-specific heat unit sum reaches its climatological value (e.g. 1.0). For corn, an additional in-field dry-down period (1680·1.15) is simulated prior to harvest.
15
Acknowledgements. The authors wish to thank Dr. Jimmy Williams, Senior Research Scientist,
with the Texas AgriLife Blackland Research and Extension Center located at Temple Texas for his continued interest and generous intellectual support of this work. We also wish to thank Joe Slater, Manager Fertilizer/AG Lime Control Services, University of Missouri Agricultural Experiment Station, Columbia, MO for his invaluable insights regarding fertilizer sales and use,
20
BGD
9, 6095–6127, 2012Linking agricultural crop management
and air quality
E. J. Cooter et al.
Title Page
Abstract Introduction
Conclusions References
Tables Figures
◭ ◮
◭ ◮
Back Close
Full Screen / Esc
Printer-friendly Version Interactive Discussion
Discussion
P
a
per
|
Dis
cussion
P
a
per
|
Discussion
P
a
per
|
Discussio
n
P
a
per
|
References
AAPFCO, Commercial Fertilizers 2002, Washington DC, 2002.
Bash, J. O., Cooter, E. J., Dennis, R., Walker, J. T., and Pleim, J. E.: Evaluation of a regional air quality model with bidirectional NH3 exchange coupled to an agro-ecosystem model, Biogeosciences, submitted, 2012.
5
Byun, D. W. and Schere, K. L.: Review of the governing equations, computational algorithms, and other components of the models-3 Community Multiscale Air Quality (CMAQ) modeling system, Appl. Mech. Rev., 59, 51–77, 2006.
Cooter, E. J., Bash, J. O., Walker, J. T., Jones, M. R., and Robarge, W.: Estimation of NH3flux from managed agricultural soils, Atmos. Environ., 44, 2107–2115, 2010.
10
Dennis, R., Mathur, R., Pleim, J. E., and Walker, J. T.: Fate of ammonia emissions at the local to regional scale as simulated by the Community Multiscale Air Quality model, Atmos. Poll. Res., 1, 207–214, 2010.
Galloway, J. N., Townsend, A. R., Erisman, J. W., Bekunda, M., Cai, Z., Freney, J. R., Martinelli, L. A., Seitzinger, S. P., and Sutton, M. A.: Transformation of the
nitro-15
gen cycle: recent trends, questions, and potential solutions, Science, 320, 889–892, doi:10.1126/science.1136674, 2008.
Gilliland, A. B., Appel, K. W., Pinder, R. W., and Dennis, R.: Seasonal NH3 emissions for the continental United States: inverse model estimation and evaluation, Atmos. Environ., 40, 4986–4998, 2006.
20
Goebes, M. D., Strader, R., and Davidson, C.: An ammonia emission inventory for fertilizer application in the United States, Atmos. Environ., 37, 2539–2550, 2003.
Hertel, O., Reis, S., Skjoth, C. A., Bleeker, A., Harrison, R., Cape, J. N., Fowler, D., Skiba, U., Simpson, D., Jickells, R., Baker, A., Kulmala, M., Gyldenkaerne, S. G., Sorensen, L. L., and Erisman, J. W.: Nitrogen processes in the atmosphere, in: The European Nitrogen
Assess-25
ment, edited by: Sutton, M. A., Howard, C. M., Erisman, J. W., Billen, G., Bleeker, A., Grenn-felt, P., van Grinsven, H., and Grizzetti, B., Cambridge University Press, New York, 177–210, 2011.
Homer, C., Dewitz, J., Fry, J., Coan, M., Hossain, N., Larson, C., Herold, N., McKerrow, A., Van Driel, J. N., and Wickham, J.: Completion of the 2001 National Land Cover Database for
30
BGD
9, 6095–6127, 2012Linking agricultural crop management
and air quality
E. J. Cooter et al.
Title Page
Abstract Introduction
Conclusions References
Tables Figures
◭ ◮
◭ ◮
Back Close
Full Screen / Esc
Printer-friendly Version Interactive Discussion
Discussion
P
a
per
|
Dis
cussion
P
a
per
|
Discussion
P
a
per
|
Discussio
n
P
a
per
|
Izaurralde, R. C., Williams, J. R., McGill, W. B., Rosenberg, N. J., and Quiroga-Jakas, M. C.: Simulating soil C dynamics with EPIC: model description and testing against long-term data, Ecol. Model., 192, 362–384, 2006.
Lovett, G. M. and Tear, T. H.: Threats from above: air pollution impacts on ecosystems and biological diversity in the Eastern United States, The Nature Conservancy and the Cary
5
Institute of Ecosystem Studies, available online at: http://ecostudies.org/Threats from Above. pdf, 2008.
Massad, R.-S., Nemitz, E., and Sutton, M. A.: Review and parameterisation of bi-directional am-monia exchange between vegetation and the atmosphere, Atmos. Chem. Phys., 10, 10359– 10386, doi:10.5194/acp-10-10359-2010, 2010.
10
Nemitz, E., Sutton, M. A., Schjorring, J. K., Husted, S., and Wyres, G. P.: Resistance modelling of ammonia exchange above oilseed rape, Agr. Forest Meteorol., 105, 405–425, 2000. Nemitz, E., Milford, C., and Sutton, M. A.: A two-layer canopy compensation point model for
describing bi-directional biosphere-atmosphere exchange of ammonia, Q. J. Roy. Meteor. Soc., 127, 815–833, 2001.
15
Nenes, A., Pilinis, C., and Pandis, S. N.: Continued development and testing of a new ther-modynamic aerosol module for urban and regional air quality models, Atmos. Environ., 33, 1553–1560, 1999.
Parton, W. J., Ojima, D. S., Cole, C. V., and Schimel, D. S.: A general model for soil organic matter dynamics: Sensitivity to litter chemistry, texture and management, in: Quantitative
20
Modeling of Soil Forming Processes, SSSA Spec. Public. No. 39 SSSA, Madison, WI, 147– 167, 1994.
Pleim, J. E., Bash, J. O., Walker, J. T., and Cooter, E. J.: Development and testing of an ammo-nia bi-directional flux model for air quality models, Biogesciences, submitted, 2012.
Pope, C. A. and Dockery, D. W.: Health effects of fine particulate air pollution: lines that connect,
25
JAPCA J. Air Waste Ma., 56, 709–742, 2006.
Potter, S. R., Andrews, S., Atwood, J. D., Kellogg, R. L., Lemunyon, J., Norfleet, L., and Oman, D.: Model Simulation of Soil Loss, Nutrient Loss, and Change in Soil Organic Carbon As-sociated with Crop Production, Natural Resources Conservation Service, U.S. Department Agriculture, Conservation Effects Assessment Project (CEAP), Government Printing Office,
30
BGD
9, 6095–6127, 2012Linking agricultural crop management
and air quality
E. J. Cooter et al.
Title Page
Abstract Introduction
Conclusions References
Tables Figures
◭ ◮
◭ ◮
Back Close
Full Screen / Esc
Printer-friendly Version Interactive Discussion
Discussion
P
a
per
|
Dis
cussion
P
a
per
|
Discussion
P
a
per
|
Discussio
n
P
a
per
|
Ruddy, B. C., Lorenz, D. L., and Mueller, D. K.: County-level estimates of nutrient inputs to the land surface of the conterminous United States, 1982–2001, US Geological Survey, Reston, VA, 2006.
Sabota, D., Compton, J., and Harrison, J.: Reactive nitrogen in the United States: how certain are we about sources and fluxes, Front. Ecol. Envrion., accepted, 2012.
5
Skamarock, W. C., Klemp, J. B., Dudhia, J., Gill, D. O., Barker, D. M., Duda, M. G., Huang, X.-Y., Wang, W., and Powers, J. G.: A description of the advanced research WRF Version 3, National Center for Atmospheric Research Boulder, 113, WRF Version3., NCAR Tech Note NCAR/TN 475 STR, 125 pp, available from UCAR Communications, P.O. Box 3000, Boulder, CO 80307, 2008.
10
Sutton, M. A., Schjorring, J. K., and Wyers, G. P.: Plant-atmosphere exchange of ammonia, Philos. T. R. Soc. A, 351, 261–278, 1995.
Vitousek, P. M., Turner, D. R., Parton, W. J., and Sanford, R. L.: Litter decomposition on the Mauna Loa environmental matrix, Hawaii: patterns, mechanisms, and models, Ecology, 75, 418–429, 1994.
15
Walker, J. T., Robarge, W., Wu, Y., and Meyers, T. P.: Measurement of bi-directional ammonia fluxes over soybean using the modified Bowen-ratio technique, Agr. Forest Meteorol., 138, 54–68, 2006.
Wickham, J. D., Stehman, S. V., Fry, J. A., Smith, J. H., and Homer, C.: Thematic accuracy of the NLCD 2001 land cover for the conterminous United States, Remote Sens. Environ., 114,
20
1286–1296, 2010.
Williams, J. R., Jones, C. A., and Dyke, P. T.: A modeling approach to determining the relation-ship between erosion and soil productivity., Trans. ASAE, 27, 129–144, 1984.
Williams, J. R., Izaurralde, R. C., and Steglich, E. M.: Agricultural Policy/Environmental eXten-der Model: Theoretical Documentation Version 0604, Texas AgriLIFE Research, Texas A&M
25
University, Temple, Texas, 2008.
Zhang, L., Wright, L. P., and Asman, W. A. H.: Bi-directional air-surface exchange of at-mospheric ammonia: a review of measurements and a development of a big-leaf model for applications in regional-scale air-quality models, J. Geophys. Res., 115, D20310, doi:10.1029/2009JD013589, 2010.
BGD
9, 6095–6127, 2012Linking agricultural crop management
and air quality
E. J. Cooter et al.
Title Page
Abstract Introduction
Conclusions References
Tables Figures
◭ ◮
◭ ◮
Back Close
Full Screen / Esc
Printer-friendly Version Interactive Discussion
Discussion
P
a
per
|
Dis
cussion
P
a
per
|
Discussion
P
a
per
|
Discussio
n
P
a
per
|
Table 1.Example of regional grain corn fertilizer amount, timing, form and distribution. Values are in percent of annual N needs met. LK=Lake States, CB=Corn Belt, NP=Northern Plains, SP=Southern Plains, DS=Delta States, SE=Southeast, AP=Appalachia, NE=northeast, MN=Mountain, PA=Pacific (see Fig. 1).
Time Form Region
LK CB NP SP DS SE AP NE MN PA
Fall Anhydrous Ammonia 15 20 25 20 30 30
Ammonium nitrate
28 % solution 5
30 % solution
other phosphate (DAP) 3 3 3 3
Urea 15 10
*By Grade 5 5 5
Spring Anhydrous Ammonia 15 45 40 45 10 50 30 30
Ammonium nitrate 28 % solution
30 % solution 50
other phosphate (DAP) 3 5 2 5 2 4
*By grade 30 35
Urea 40
After Plant Anhydrous Ammonia 10 30
Ammonium nitrate
28 % solution 10 20 10
30 % solution 30 30
32 % solution 21 25 10 30 10 10
Urea 5
other phosphate (DAP) 1 3 3
manure 29 7 9 4 3 6 7 25 7
BGD
9, 6095–6127, 2012Linking agricultural crop management
and air quality
E. J. Cooter et al.
Title Page
Abstract Introduction
Conclusions References
Tables Figures
◭ ◮
◭ ◮
Back Close
Full Screen / Esc
Printer-friendly Version Interactive Discussion
Discussion
P
a
per
|
Dis
cussion
P
a
per
|
Discussion
P
a
per
|
Discussio
n
P
a
per
|
Table 2.Crops modeled within the Agricultural Fertilizer Modeling System (AFMS).
Grass Hay Peanuts
Alfalfa Hay Potatoes
Other grazed cropland and pasture Rice
Barley Rye
Canola Sorghum for Grain
Edible Dry Beans Sorghum for Silage
Edible Dry Peas Soybeans
Corn for Grain Winter wheat
Corn for Silage Spring Wheat
Cotton Other crops
BGD
9, 6095–6127, 2012Linking agricultural crop management
and air quality
E. J. Cooter et al.
Title Page
Abstract Introduction
Conclusions References
Tables Figures
◭ ◮
◭ ◮
Back Close
Full Screen / Esc
Printer-friendly Version Interactive Discussion
Discussion
P
a
per
|
Dis
cussion
P
a
per
|
Discussion
P
a
per
|
Discussio
n
P
a
per
|
BGD
9, 6095–6127, 2012Linking agricultural crop management
and air quality
E. J. Cooter et al.
Title Page Abstract Introduction Conclusions References Tables Figures ◭ ◮ ◭ ◮ Back Close
Full Screen / Esc
Printer-friendly Version Interactive Discussion Discussion P a per | Dis cussion P a per | Discussion P a per | Discussio n P a per | F ra c t io n o f Ar e a P la n te d F ra c t io n o f Ar e a P la n te d
A
F rac t io n o f A r e a H ar v e s te d F rac t io n o f A r e a H ar v e s te dB
BGD
9, 6095–6127, 2012Linking agricultural crop management
and air quality
E. J. Cooter et al.
Title Page
Abstract Introduction
Conclusions References
Tables Figures
◭ ◮
◭ ◮
Back Close
Full Screen / Esc
Printer-friendly Version Interactive Discussion
Discussion
P
a
per
|
Dis
cussion
P
a
per
|
Discussion
P
a
per
|
Discussio
n
P
a
per
|
A
BGD
9, 6095–6127, 2012Linking agricultural crop management
and air quality
E. J. Cooter et al.
Title Page
Abstract Introduction
Conclusions References
Tables Figures
◭ ◮
◭ ◮
Back Close
Full Screen / Esc
Printer-friendly Version Interactive Discussion
Discussion
P
a
per
|
Dis
cussion
P
a
per
|
Discussion
P
a
per
|
Discussio
n
P
a
per
|
BGD
9, 6095–6127, 2012Linking agricultural crop management
and air quality
E. J. Cooter et al.
Title Page Abstract Introduction Conclusions References Tables Figures ◭ ◮ ◭ ◮ Back Close
Full Screen / Esc
Printer-friendly Version Interactive Discussion Discussion P a per | Dis cussion P a per | Discussion P a per | Discussio n P a per | B
Jan Feb Mar Apr May Jun Jul Aug Sep Oct Nov Dec
CSN: Mod-Obs
NO 3 μ gm -3 -4 -2 0 2 4 C
Jan Feb Mar Apr May Jun Jul Aug Sep Oct Nov Dec
IMPROVE: Mod-Obs NO 3 μ gm -3 -4 -2 0 2 4 A
Jan Feb Mar Apr May Jun Jul Aug Sep Oct Nov Dec
CONUS NH3Total Emissions
M illio n s o f k g N H3 m o n th -1 0 1 0 0 2 0 0 3 0 0 4 0 0 5 0 0
Fig. 7. (A)Monthly total NH3 emissions (CAFO, industrial and inorganic fertilizer) reported in the 2005 U.S. EPA NEI and estimated by the bidirectional CMAQ with EPIC fertilizer, (B) Monthly model ambient NO−
3 biases at urban STN observation sites, and(C)rural IMPROVE
BGD
9, 6095–6127, 2012Linking agricultural crop management
and air quality
E. J. Cooter et al.
Title Page
Abstract Introduction
Conclusions References
Tables Figures
◭ ◮
◭ ◮
Back Close
Full Screen / Esc
Printer-friendly Version Interactive Discussion
Discussion
P
a
per
|
Dis
cussion
P
a
per
|
Discussion
P
a
per
|
Discussio
n
P
a
per
|