www.atmos-chem-phys.net/9/4467/2009/ © Author(s) 2009. This work is distributed under the Creative Commons Attribution 3.0 License.
Chemistry
and Physics
Exploring atmospheric boundary layer characteristics in a severe
SO
2
episode in the north-eastern Adriatic
M. T. Prtenjak1, A. Jeri˘cevi´c2, L. Kraljevi´c2, I. H. Buli´c1, T. Nitis3, and Z. B. Klai´c1
1Andrija Mohorovi˘ci´c Geophysical Institute, Department of Geophysics, Faculty of Science, University of Zagreb, Croatia 2Meteorological and Hydrological Service of Croatia, Zagreb, Croatia
3Laboratory of Geoinformatics and Environmental Application, Department of Marine Sciences, University of the Aegean, 81100 Mytilene, Greece
Received: 23 December 2008 – Published in Atmos. Chem. Phys. Discuss.: 9 March 2009 Revised: 1 July 2009 – Accepted: 6 July 2009 – Published: 13 July 2009
Abstract. Stable atmospheric conditions are often
con-nected with the occurrence of high pollution episodes es-pecially in urban or industrial areas. In this work we in-vestigate a severe SO2 episode observed on 3–5 February 2002 in a coastal industrial town of Rijeka, Croatia, where very high daily mean concentrations (up to 353.5µg m−3) were measured. The episode occurred under high air pres-sure conditions, which were accompanied with a fog and low wind speeds. Three air quality models (50-km EMEP model, 10-km EMEP4HR model and 1-km CAMx model) were used to simulate SO2concentrations fields and to eval-uate the relative contribution of distant and local pollution sources to observed concentrations. Results suggest that the episode was caused predominately by local sources. Fur-thermore, using three-dimensional, higher-order turbulence closure mesoscale meteorological model (WRF), the wind regimes and thermo-dynamical structure of the lower tropo-sphere above the greater Rijeka area (GRA) were examined in detail. Modelled atmospheric fields suggest several factors whose simultaneous acting was responsible for elevated SO2 concentrations. Established small scale wind directions sup-ported the transport of air from nearby industrial areas with major pollution sources towards Rijeka. This transport was associated with strong, ground-based temperature inversion and correspondingly, very low mixing layer (at most up to about 140 m). Additionally, the surface winds in Rijeka were light or almost calm thus, preventing ventilation of polluted
Correspondence to:M. T. Prtenjak ([email protected])
air. Finally, a vertical circulation cell formed between the mainland and a nearby island, supported the air subsidence and the increase of static stability.
1 Introduction
Facing the Adriatic Sea and surrounded by mountains (Fig. 1), Rijeka is a coastal industrial town situated in a re-gion of very complex wind regimes (e.g. Klai´c et al., 2003; Nitis et al., 2005; Prtenjak et al., 2006, 2008; Prtenjak and Grisogono, 2007; Klai´c et al., 2009). In the Greater Rijeka Area (GRA), southeast of the Rijeka town, some of the ma-jor individual sources of SO2in Croatia are found, such as an oil refinery and a thermal power plant. According to esti-mates from the Ministry of Environmental Protection, Phys-ical Planning and Construction of the Republic of Croatia (http://www.mzopu.hr, data for 2002) the two sources emit about 20% of the total national emissions of SO2, where 8933 and 4909 tones of SO2 correspond to the oil refinery and thermo-power plant, respectively. In addition, compared to other regions along the eastern Adriatic coast, the GRA – together with the Istria peninsula – is more exposed to the long-range transport of pollutants from western Europe (e.g. Klai´c, 1990, 1996; Klai´c and Beˇsirevi´c, 1998; Klai´c, 2003).
Fig. 1. (a)Configuration of nested WRF domains at the north-eastern Adriatic coast. Frames indicate the coarse (A), medium (B) and the fine (C) WRF model domain, respectively.(b)Anaglyph for the fine-grid domain. Positions of routine measuring sites are shown by filled black circles (see text for details). Lines C1C2 and D1D2 show bases of vertical cross-sections investigated in the Sect. 5. (c)Major industrial areas in the Greater Rijeka Area (GRA) are shown by filled blue circles: 1 – industrial zone of Rijeka with, among others, an oil refinery and thermo-power plant, 2 – Petrochemical plant and the oil terminal (Omiˇsalj, Krk island). The town of Rijeka is hatched in black and the position of the two measuring sites in Rijeka (3A and 3B) is presented by circles filled in red.
et al., 2005). Pollution episodes can occur due to various causes, such as, increased pollutant emissions, topographical (e.g. Brulfert et al., 2005) and/or thermal forcing (e.g. Robin-sohn et al., 1992; Evtyugina et al., 2006; Drobinski et al., 2007; Levy et al., 2008), favourable weather conditions and season or chemical characteristics of the atmosphere. Re-sults of many studies (e.g. Robinsohn et al., 1992; Soler et al., 2004; Pohjola et al., 2004; Fisher et al., 2005; Tayanc and Bercin, 2007) showed that severe air pollution episodes around the world are very often associated with high pressure conditions, weak winds and/or strong low-level temperature inversion and poor vertical mixing (e.g. Natale et al., 1999). In some cases occurrence of high level SO2 episodes have been caused by long range transport (e.g., Steenkist, 1988; De Leeuw and Leyssius, 1989).
A human health risk event occurred in Rijeka during 3 to 5 February 2002, where a daily mean concentration of SO2 reached the value of 353.5µg m−3, which is about 10 times the average daily value in February and more than twice of a limit value of 125µg m−3 prescribed by a law (http: //www.zzjzpgz.hr/zrak/index.php). Therefore, on 4 Febru-ary, the local authorities warned Rijeka inhabitants to remain indoors. Managements of the oil refinery and thermal power plant claimed that during the episode their emissions were at normal levels.
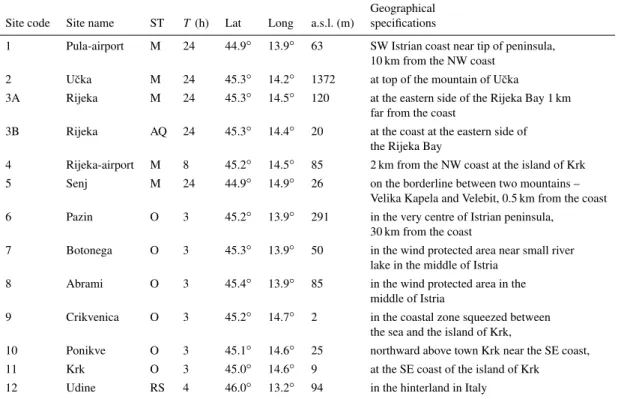
Table 1.Measuring sites in the north-eastern Adriatic (see also Fig. 1). A station type (ST) is given by abbreviations: M, O, AQ and RS for the main meteorological station, ordinary meteorological station, air quality monitoring and radio-sounding station, respectively. Temporal resolution (T) of the ordinary meteorological station corresponds to the three following terms: 06:00 UTC, 13:00 UTC and 20:00 UTC.
Geographical
Site code Site name ST T(h) Lat Long a.s.l. (m) specifications
1 Pula-airport M 24 44.9◦ 13.9◦ 63 SW Istrian coast near tip of peninsula,
10 km from the NW coast
2 U˘cka M 24 45.3◦ 14.2◦ 1372 at top of the mountain of U˘cka
3A Rijeka M 24 45.3◦ 14.5◦ 120 at the eastern side of the Rijeka Bay 1 km
far from the coast
3B Rijeka AQ 24 45.3◦ 14.4◦ 20 at the coast at the eastern side of
the Rijeka Bay
4 Rijeka-airport M 8 45.2◦ 14.5◦ 85 2 km from the NW coast at the island of Krk
5 Senj M 24 44.9◦ 14.9◦ 26 on the borderline between two mountains –
Velika Kapela and Velebit, 0.5 km from the coast
6 Pazin O 3 45.2◦ 13.9◦ 291 in the very centre of Istrian peninsula,
30 km from the coast
7 Botonega O 3 45.3◦ 13.9◦ 50 in the wind protected area near small river
lake in the middle of Istria
8 Abrami O 3 45.4◦ 13.9◦ 85 in the wind protected area in the
middle of Istria
9 Crikvenica O 3 45.2◦ 14.7◦ 2 in the coastal zone squeezed between
the sea and the island of Krk,
10 Ponikve O 3 45.1◦ 14.6◦ 25 northward above town Krk near the SE coast,
11 Krk O 3 45.0◦ 14.6◦ 9 at the SE coast of the island of Krk
12 Udine RS 4 46.0◦ 13.2◦ 94 in the hinterland in Italy
InterNational) (Geleyn et al., 1992) at horizontal resolution of 8 km, and accordingly smoothed terrain topography. Thus, it did not offer a detailed insight in the fine-scale (∼1 km) lower-tropospheric conditions responsible for this particular pollution event, which, we believe, we have succeeded in do-ing in the present study.
Another novelty of this study, compared to the investiga-tion of Jeri˘cevi´c et al. (2004), is an assessment of the relative contribution of distant pollution sources in the occurrence of the observed elevated SO2concentrations. For this purpose, we applied the Unified European Monitoring and Evaluation Programme (EMEP) model (www.emep.int) that simulates atmospheric transport and deposition of pollutants at regional and synoptic scale. Apart from the EMEP modelled fields at 50×50 km2, thanks to the ongoing EMEP4HR project (Jeri˘cevi´c et al., 2007), we utilized preliminary EMEP4HR model results at 10×10 km2 resolution. In addition, we investigated the fine scale (1×1 km2) results obtained by widely used (e.g. de Foy et al., 2007) small scale Compre-hensive Air quality Model with extensions (CAMx) (http: //www.camx.com/).
2 Study area and data
The GRA is located in the western part of Croatia (Fig. 1a) and it is characterized by a complex topography. It is a mountainous area open to the sea towards the south, where several islands are located, with Cres and Krk being the largest (Fig. 1b). The Rijeka urban area faces the Kvarner Bay. The Kvarner Bay is surrounded with rather high moun-tains with steep slopes: Risnjak (more than 1250 m high), Velika Kapela (1534 m) and Velebit (1758 m). Westward from Rijeka, the terrain rises very abruptly along the coast-line (U˘cka and ´Ci´carija mountains, 1401 m, and 1272 m, re-spectively), forming a physical boundary between the Istria peninsula and the Kvarner Bay. A more gradual rise of the terrain is found north-west of the Rijeka urban area, with an elevation of less than 500 m a.s.l., where a roughly triangular valley extends towards the Gulf of Trieste (GT in Fig. 1b), which is near the north-western boundary of the study area.
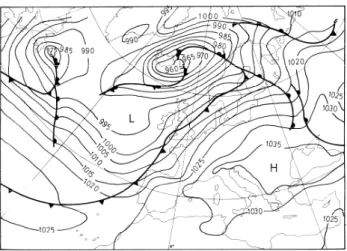
Fig. 2. Surface diagnostic chart for Europe at 00:00 UTC on 3 February 2002 (source: European Meteorological Bulletin).
Meteorological charts over Europe for the period of study show a high pressure field over the central and south-eastern part of Europe. Here we show only one snapshot of the sur-face conditions over Europe (Fig. 2). Over the north-eastern Adriatic coast these were accompanied by weak pressure gradients and consequently, weak surface winds, and stag-nant conditions with fog and low stratified cloudiness. On 5 February, the high pressure field started to weaken, indi-cating the change of synoptic forcing due to the Genoa Cy-clone that approached the Kvarner Bay (not shown). Addi-tionally, the radio-sounding performed in Udine (coarse do-main; Fig. 1a) revealed a high static stability ranging from 5.6 K km−1on 2 February to 5.2 K km−1on 5 February. Dur-ing the entire period under study, the winds in the lowermost 2 km in Udine were mostly less than 4 m s−1, and varied from south-westerly to westerly.
In the studied area, a few episodes with the high levels of SO2(daily means between 130–143µg m−3)usually occur during the wintertime (e.g. 15 December 2006, 6 January 2007, 20 January 2008; http://zrak.mzopu.hr/default.aspx? id=22). Nevertheless, the episode investigated here is char-acterized by unusually high SO2concentrations (Fig. 3), and thus, it could not be considered as typical. As of 3 February 08:00 UTC, the SO2concentration started to increase. After continuous growth, on 5 February at 09:00 UTC it reached the hourly maximum of about 600µg m−3. As of 5 Febru-ary 11:00 UTC concentrations started to decrease. Thus, after 12:00 UTC they were below 150µg m−3. This pol-lutant concentration decrease coincided with the change of the large-scale, synoptic conditions. The highest daily mean concentration occurred on 4 February. It reached a value of 353.5µg m−3, which is about 10 times higher than the aver-age.
0 100 200 300 400 500 600
1 12 24 12 24 12 24 12 24 12 24
UTC (h)
2 Feb 3 Feb 4 Feb 5 Feb 6 Feb
SO
2
c
onc
e
nt
a
tt
ions
(μ
g/
m
3)
SO2 (μg m-3)_50 SO2 (μg m-3)_10 SO2 (μg m-3)_1 SO2 (μg m-3)_M
Fig. 3.Hourly SO2concentrations for Rijeka from 2 to 6 February
2002: EMEP at 50-km resolution (pink solid line), EMEP4HR at 10-km resolution (blue line with circles), CAMx at 1-km resolution (green line with triangles), and, measured at the site 3B in Table 1 and Fig. 1b (grey line with crosses) (source: Teaching Institute for Public Health, Rijeka).
3 Air quality models
3.1 The standard EMEP model
3.2 The EMEP4HR model
Currently, considerable scientific effort is being invested in the further development of the EMEP modelling system in order to make it applicable at finer resolutions (i.e. national scales and finer time scales). At the moment, there are two such ongoing joint projects: one for the UK domain (EMEP4UK, Vieno et al., 2008, 2009), and the other for Croatia (EMEP4HR, Jeri˘cevi´c et al., 2007). Here, we have applied the Unified EMEP model version for the smaller do-main, a setup called EMEP4HR. This is continuing effort, and results of the EMEP4HR model setup are still considered preliminary. The model was run at 10-km horizontal resolu-tion for the domain that is relevant for Croatia. A hydrostatic NWP model ALADIN (Geleyn et al., 1992), which is run op-erationally at the Croatian Meteorological and Hydrological Service at a horizontal resolution of 8 km, was used as a me-teorological driver. Meme-teorological fields are updated every 3 h. The EMEP model was run with the same resolution and projection (tangent version of Lambert conformal projection) as the meteorological driver. Thus, no horizontal interpola-tion of the meteorological fields was done during the pre-processing of meteorological fields. In vertical, meteorologi-cal fields were interpolated to the EMEP model levels which are the same as in the standard Unified EMEP model setup. The EMEP4HR setup is nested in the standard EMEP do-main; 1-way nesting was used, with the coupling frequency of 1 h. For the purpose of EMEP4HR project (Jeri˘cevi´c et al., 2007), the new, high resolution (10-km grid) emission in-ventory for Croatia was performed. Outside of Croatia, the EMEP emissions at 50-km resolution are interpolated to 10-km grid. Thus, local Croatian sources are resolved much better than the local sources in other countries within the in-vestigated domain.
3.3 The CAMx model
To obtain the high-resolution hourly SO2concentrations in this very complex zone (topography, land/sea interface, land use), Comprehensive Air Quality Model with extensions (CAMx, version 4.51) was employed (e.g. de Foy et al., 2007; ENVIRON, 2008). It is widely used Eulerian photo-chemical dispersion model. Simulations were made with the Carbon Bond IV mechanism (Gery et al., 1989), Piecewise Parabolic Method (PPM) horizontal advection solver and Chemical Mechanism Compiler (CMC) chemistry solver. The meteorological input was obtained from nonhydrostatic WRF model (see Sect. 4) for every hour. The CAMx was run on a domain identical to the finest WRF domain (frame C in Fig. 1a) at 1 km horizontal resolution with the first 15 of the 65 vertical levels used in WRF model setup. These corre-spond to approximately 3700 m deep layer above the surface. Emission fields were taken from 10-km resolution emission inventory for Croatia (i.e. EMEP4HR emissions, Sect. 3.2), and they were linearly interpolated to 1-km resolution.
4 Mesoscale meteorological model
Small-scale meteorological conditions were simulated by the mesoscale Weather Research and Forecasting model (ver-sion 2.2) (WRF, http://www.wrf-model.org/index.php; Ska-marock et al., 2007). The WRF model is used in a variety of areas (Michalakes et al., 2004) including storm prediction and research (e.g. Kain et al., 2006), air-quality modelling (e.g. Jimenez-Guerrero et al., 2008), wildfire, hurricane (e.g. Trenberth et al., 2007), tropical storm prediction and regional climate and weather prediction (e.g. Skamarock and Klemp, 2008). The WRF model consists of fully compressible non-hydrostatic equations on a staggered Arakawa C grid. Thus, the wind components u, v, and w are recorded at the re-spective cell interfaces and all other variables, as volumetric cells, carry averages at the cell centre. Its vertical coordinate is a terrain-following hydrostatic pressure coordinate. Here, the model uses the Runge-Kutta 3rd order time integration scheme and 5th order advection schemes in horizontal direc-tion and the 3rd order in vertical ones. A time-split small step for acoustic and gravity-wave modes is utilized. The dynamics conserve scalar variables.
-20 -15 -10 -5 0 5 10 15 20 25 30 35 40 45 50 55 60 20 25 30 35 40 45 50 55 60 65 70 75 Europa-Zavižan.srf skala: 24:20 sektor 1 (N)
sektor 2 (NE)
sektor 3 (E)
sektor 4 (SE)
sektor 5 (S) sektor 6 (SW)
sektor 7 (W)
sektor 8 (NW) 04.02.2002.
Fig. 4. 4-day backward 925 hPa trajectories arriving at the EMEP site closest to Rijeka (Zaviˇzan, see Fig. 1b) on 4 February 2002, at 00:00 UTC (black), 06:00 UTC (blue), 12:00 UTC (green) and 18:00 UTC (red). Parcel positions are given for every second hour.
in the inner domains. Initialization and boundary condi-tions were taken from the European Centre for Medium-Range Weather Forecasts (ECMWF) Reanalysis fields. The ECMWF data were available at a 0.25-degree resolution (∼25 km resolution) at the standard pressure levels every 6 h. Simulation was performed from 12:00 UTC of 31 January to the 00:00 UTC of 6 February. During the studied period, the observed sea surface temperatures were almost constant in time and space (∼9.5◦C). Therefore, the WRF version with
the time-constant sea surface temperature was employed.
5 Results and discussion
5.1 Air quality
According to Fig. 3, the observed daily concentration of SO2 started to increase considerably on 3 February 2002.The first step was to evaluate a possible contribution of the long-range SO2transport which is provided by the 50-km EMEP model. The EMEP modelled concentrations show a very small in-crease during the episode (e.g. at the beginning of the episode on 3 February, Fig. 3). In addition, air trajectories for se-lected EMEP sites are operationally calculated by tracking an air parcel every 2 h for 96 h backwards in time for 4 dif-ferent starting times, i.e. 00:00 UTC, 06:00 UTC, 12:00 UTC and 18:00 UTC. For each single term, two-dimensional tra-jectories are defined by a total of 49 position points (includ-ing the arrival point). Trajectory calculations are based on modelled wind fields at mean sigma level of 0.925 obtained from the model PARLAMPS in the EMEP grid developed at the MET. NO. Trajectories (Fig. 4) show that approximately 2 days before the occurrence of the episode, the air parcels were passing above the known main regional SO2emission
areas in Hungary, Bulgaria and central Bosnia, as well as central Italy. Consecutive parcel positions are very close, es-pecially for the last 24 h. This suggests the low modelled wind speeds (<5 m s−1) and stagnant conditions over the wider region, which is in accordance with the high pressure system (Fig. 2). Different starting times of trajectories re-vealed westward shift. However, the 50-km EMEP modelled values comprised only up to about of 2% of the observed concentrations, suggesting that the majority of the observed high SO2 concentrations arise from local emission sources. The same is further corroborated with EMEP4HR results, al-though the contribution of non-local pollution sources to pol-lutant concentrations is somewhat larger (up to about 10%). Furthermore, CAMx modelled concentrations, which are due to pollution sources within the domain shown in Fig. 1b (i.e., mainly sources within the GRA) agree reasonably well with measured values.
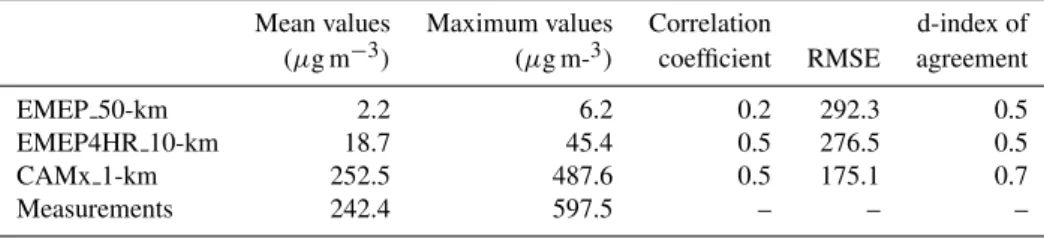
Table 2 shows statistics for the employed models namely, mean diurnal value, maximum value, root mean square error (RMSE), correlation coefficient and index of agreement,d, (e.g. Willmott, 1982), while Fig. 5 illustrates a snapshot of horizontal distribution of hourly SO2fields for the three air quality models. Thed-index determines the degree to which the observed value is accurately estimated by the simulated value, and is a measure of the degree to which a model’s pre-dictions are error free. Values ofd-index are in the range of 0.0, when there is no agreement between the observed and the predicted values, and 1.0 which represents perfect agreement between observed and predicted values. Similar to Fig. 3, both Table 2 and Fig. 5 also show that: 1) the agree-ment between modelled and measured values, as expected, increase with the model resolution. (Namely, apart from the more realistic representation of emission fields, the increased model resolution also generally implies better incorporation of input data, such as, topography, land-use etc.; and, conse-quent meteorological files); and 2) the local emission sources played the major role in the establishment of the investigated episode. (For Rijeka, the mean CAMx modelled concentra-tion (i.e. caused by sources within the GRA) over the en-tire period was 252.5µg m−3, while corresponding measured value is 242.4µg m−3. Simultaneously, mean concentrations in Rijeka, caused by the central European sources and entire Europe were, 18.7 and 22.2µg m−3, respectively.)
5.2 Meteorological conditions
5.2.1 Measured vs. modelled data
Table 2.Statistic indices for modelled and measured SO2concentrations.
Mean values Maximum values Correlation d-index of (µg m−3) (µg m-3) coefficient RMSE agreement
EMEP 50-km 2.2 6.2 0.2 292.3 0.5
EMEP4HR 10-km 18.7 45.4 0.5 276.5 0.5
CAMx 1-km 252.5 487.6 0.5 175.1 0.7
Measurements 242.4 597.5 – – –
Table 3.Index of agreement for the wind speed, wind direction and 2-m air temperature, respectively, modelled by WRF model during period 2–5 February 2002. This statistic index reflects the degree to which measurements are accurately estimated by the model.
Site Site Wind Wind
code name speed dir Temp
1 Pula-airport 0.7 0.9 0.5
2 U˘cka 0.5 0.9 –
3A Rijeka 0.3 0.8 0.6
5 Senj 0.5 0.9 0.8
the model. The calculations were made for wind speed, wind direction and temperature at four stations with 24 h measure-ments. During 2–5 February, thed-index, for all the afore-mentioned variables showed reasonable model performance, although somewhat poorer agreement was obtained for the wind speed in the 3A (Rijeka) site (Table 3 and Fig. 6a). At this site, Fig. 6b, wind direction is reproduced reasonably well. Due to low wind speeds, the measured wind direc-tions are highly variable, while the modelled ones are more organized into local flows. Such recorded low wind speeds (<2 m s−1)are generally difficult to model (e.g. Mahrt and Vickers, 2006; Mahrt, 2007). The smoothing of the model terrain at the 1-km resolution, and the parameterization of turbulent fluxes during the night in the stable boundary layer according to the Monin-Obukhov theory (e.g. Grisogono et al., 2007; Baklanov and Grisogono, 2007) are the most prob-able causes. The air temperature at 2 m in Rijeka is gener-ally overestimated (Fig. 6c). Still the agreement is accept-able (Taccept-able 3) especially in respect to the local observed fog formation, weak winds and almost equal sea and air surface temperatures during the studied period. Finally, knowing the overwhelmingly complex terrain, finite resolution of the model and its parameterizations, the overall correspondence between measurements and the WRF model is satisfactory.
5.2.2 Horizontal fields
On 2 February sunny conditions were observed in the GRA and the maximum air temperature there was higher than the sea surface temperature by 10◦C. Thus, a growth of the
mixed layer is expected, which is potentially accompanied by the mixing down of elevated pollutants present in the residual layer from the previous day (Stull, 1988). Jeri˘cevi´c et al. (2004) assumed that the observed SO2 concentration growth on 3 February was due to pollutant entrainment into the boundary layer from the residual layer of previous day. Still, their model results did not allow final conclusion. Since the maximum concentration occurred on the 4 February, we mostly focus on the lower-tropospheric conditions during the pollution episode, from 2 to 4 February 2002. Figure 7 shows the simulated 10-m wind field on 2 February 2002 at 13:00 UTC. Both measurements and simulation results show prevailing north-westerly winds over the western part of the Istria peninsula (Fig. 7a). The simulated wind field suggests an advection of the marine moist air towards land, which ex-plains the observed fog above the western Istrian coast.
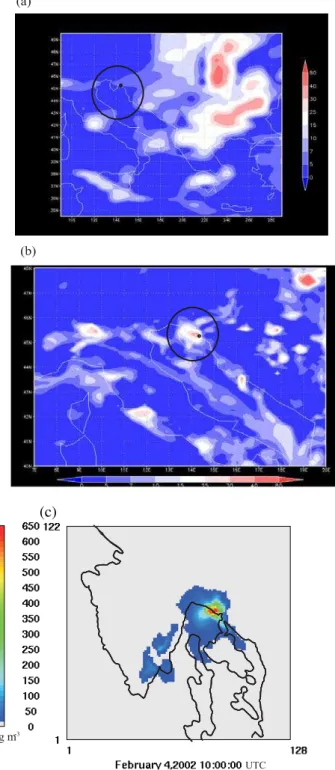
is-(c)
Fig. 5. The horizontal distribution of hourly surface SO2
concen-trations (µg m−3) for 4 February 2002 at 10:00 UTC(a)50-km
EMEP model;(b)10-km EMEP4HR model; and,(c)1-km CAMx model. The black circles and black dots at two upper panels display the studied area (north-eastern Adriatic) and the position of Rijeka town, respectively.
(a) 0 1 2 3 4 5
24 12 24 12 24 12 24 12 24
t(h)
2 Feb 3 Feb 4 Feb 5 Feb
w
ind s
pe
e
d (
m
s
-1)
measured in 3A modeled in 3A
(b)
0 90 180 270 360 450
24 12 24 12 24 12 24 12 24
t(h)
2 Feb 3 Feb 4 Feb 5 Feb
w
ind di
re
c
ti
o
n (
°)
measured in 3A modeled in 3A
(c) 0 2 4 6 8 10 12 14 16 18
24 12 24 12 24 12 24 12 24
t(h)
2 Feb 3 Feb 4 Feb 5 Feb
2
-m t
e
mp
a
n
d
S
S
T
(°
C
)
measured 2-m T WRF 2-m T
measured SST WRF_SST
Fig. 6. The wind speed(a), wind direction(b), air temperature at 2 m height(c)from measurements (red line with circles) and WRF model simulations (black) in 3A (Rijeka) station from 2 February 2002, till 6 February 2002. At (c) panel blue triangles and grey cir-cles correspond to the measured and WRF sea surface temperature (SST), respectively.
lands of Krk and Cres, as well as inside the Velebit channel (VC in Fig. 1), the northerly channelled flows were estab-lished.
Fig. 7. (a)The measured (red arrows) 10-m wind (m s−1)from
main and ordinary meteorological stations in Table 1 and modelled WRF wind field (black arrows) as well as(b)WRF surface air tem-perature in◦C on 2 February 2002 at 13:00 UTC. Note that the
me-teorological fields are shown in the enlarged finest WRF domain in order to show better the GRA area.
(not shown here) the anti-clockwise mesoscale eddy, associ-ated with katabatic winds channelled within the pass between Risnjak and Velika Kapela, extends over the greater Rijeka area. A similar wind pattern, which is due to topography, has already been suggested by Prtenjak et al. (2006) for the night time stable conditions during summer. Above the island of Krk, especially over its eastern part (Fig. 8), south-easterly winds blow. Thus, they transport the air from the northern Krk, where the petrochemical plant and the oil terminal are located (point 2, Fig. 1c) towards the Rijeka town. Further, the established mesoscale vortex transports the air from the industrial zone of Rijeka (point 1, Fig. 1c) towards the town (Fig. 8). The transport of air above the areas with major
pol-Fig. 8. The measured (red arrows) 10-m wind (m s−1)from main
and ordinary meteorological stations in Table 1 and modelled WRF wind field (black arrows) on 2 February 2002 at 20:00 UTC.
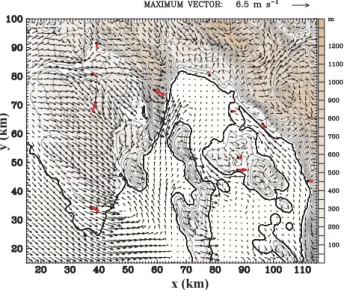
Fig. 9.Same as Fig. 7 except on 3 February 2002 at 13:00 UTC.
lution sources is accompanied by a gradual increase of atmo-spheric stability due to the nighttime cooling (not shown).
(a)
(b)
(c)
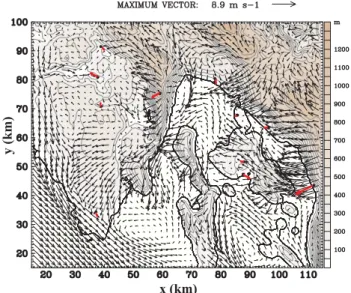
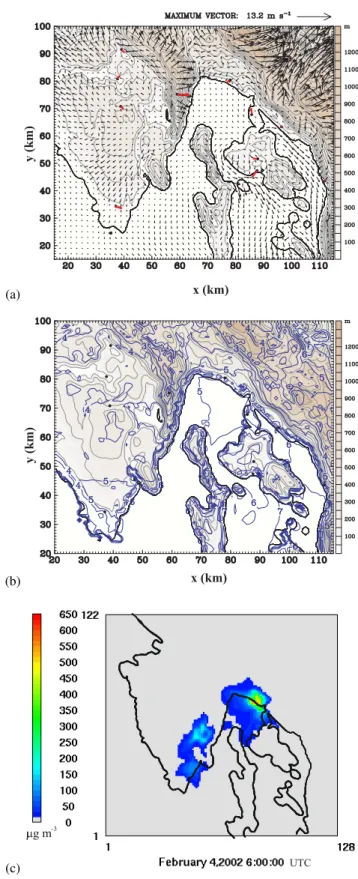
Fig. 10. (a)The measured (red arrows) 10-m wind (m s−1)from
main and ordinary meteorological stations in Table 1 and modelled WRF wind field (black arrows) as well as(b)WRF surface air tem-perature in◦C on 4 February 2002 at 06:00 UTC.(c)Horizontal
cross section at 55 m a.g.l. at 06:00 UTC for the SO2concentration
in g m−3(colour scale) simulated by 1-km air quality model.
almost continuously present above the Rijeka Bay (Fig. 9). Bearing in mind the low wind speeds, the agreement between the measured and simulated wind vectors is satisfactory, with discrepancies at the southern tip of Istria being somewhat larger. According to the modelled wind fields, over the west-ern coast of Istria, the westerly flow continues bringing the moist marine air over land. This further supports the per-sistence of fog, which according to measurements was re-ported for all coastal sites. Similarly, the previous evening, the modelled wind field exhibits a south-easterly flow which transports the air from local emission sources towards Rijeka town (Fig. 9). It is important to note that the airflow pattern over the greater Rijeka Bay area, in Fig. 9, is almost sta-tionary throughout the 3 February. On the other hand, in the mountain pass between ´Ci´carija and Risnjak, the airflow con-ditions change and winds turn to south-easterly ones. Mod-elled temperatures are generally higher than measured ones (not shown). Further, the modelled temperature field pattern is similar to the pattern of the previous day, although the val-ues are somewhat lower. In time, the atmosphere becomes more stable due to continuous nighttime radiative cooling of the land. The stable stratification suppresses the vertical mix-ing inside the boundary layer, which results in very weak nighttime winds especially above the Kvarner Bay. Over the major part of the Istrian peninsula, the modelled airflow is eastern, which agrees well with the measurements. The synoptic forcing is weak. Hence, both the complex topogra-phy and the stable stratification strongly influence the local winds.
Fig. 11.Same as Fig. 7 except on 4 February 2002 at 13:00 UTC.
Thus, a very weak clockwise eddy forms, which transported air towards the island of Krk, and cancelled any earlier anti-clockwise vortex inside the Rijeka Bay. The same is con-firmed by measurements (Fig. 11). Generally, wind speeds remained lower than 5 m s−1 until the 20:00 UTC. The air-flow strengthened afterwards, especially over the southern tip of the Istria peninsula.
The afternoon wind distribution of the previous day mostly retains until 07:00 UTC of 5 February (not shown). Around noon, the CW eddy within the Rijeka Bay starts to diminish and south-easterly winds form through the Velebit channel. In the afternoon prevailing southerly winds dominate in the whole studied area (Fig. 12) changing the atmospheric con-ditions. In the GRA, winds fortify until the end of the day. This is in agreement with the decrease in SO2concentrations on 5 February (Fig. 3).
5.2.3 Vertical cross-sections
Modelled vertical cross-sections of potential temperature and wind vectors at 08:00 UTC and 17:00 UTC on 3 February are presented in Fig. 13. Here, the analysis is concentrated on the GRA regarding static stability and wind field. At 08:00 UTC (Fig. 13a) a different boundary layer development can be noted above the coast compared to adjacent foothills. The coastal shallow (≈200 m deep) stable layer is under the in-fluence of the incoming south-easterly flow (Fig. 13b). A somewhat less stable layer is formed north-eastward (region above 27 km<×<34 km in Fig. 13a) which is characterized by local mixing, with a subsidence above the sea and an up-slope flow along the foothill above Rijeka. During the day, the difference between the ground-based layers above the Ri-jeka and adjacent foothills disappears and static stability in-creases (Figs. 13c, d). Under such circumstances, air
ventila-Fig. 12.Same as Fig. 7 except on 5 February 2002 at 13:00 UTC.
tion is poor and winds are week. However, the southern air-flow component persists further supporting the transport of air from industrial regions towards Rijeka. Further, it is in-teresting to notice the circulation cell, approximately 350 m deep, which is found between the mainland and the island of Cres above the lowermost approximately 100 m (bottom panel, right). This circulation cell in the vertical plain acts as a lid, which prevents the pollutants in the lowermost ground-based layer to dilute. During the night time, due to persistent subsidence and radiative cooling, the static stability increases (not shown), which further favours the pollutant accumula-tion in the lowermost atmospheric layers. Such polluaccumula-tion episodes, due to temperature inversions resulting in the stag-nant air, have already been observed elsewhere (e.g. Fisher et al., 2005).
Fig. 13. Vertical cross-sections of the WRF modelled wind (m s−1)and potential temperature (K) above Rijeka on 3 February 2002 at
08:00 UTC(a, b)and 17:00 UTC(c, d). Left and right panels correspond to the cross-sections perpendicular (C1C2) and parallel (D1D2) to the coastline. Bases of the cross-sections are shown in Fig. 1b.
lowermost layer). In addition, winds in the lowermost layer remain weak. Accordingly, the SO2concentrations (Fig. 3) remain high until midday of 5 February. The vertical fields on 5 February show once more the daytime south-easterly winds above the major portion of the GRA (Fig. 15). The transport of air from both, the northern part of the island of Krk and the industrial zone southeast of the town is estab-lished again. However, the winds become stronger and static stability decreases over Rijeka (especially during the evening hours) which agrees with the decreasing in of the SO2 con-centrations (Fig. 3).
5.2.4 Potential temperature profiles and boundary layer
heights
The evolution of vertical profiles of potential temperature from 2 to 5 February above Rijeka is shown in Fig. 16. The ground-based temperature inversion, which is present
on 3 February at 08:00 UTC in the first 200 m, strengthens in time. Above the lowermost layer, the most stable one, another stable layer of somewhat weaker static stability ex-ists. In time, its stability also increases up to the 4 February reaching the maximum stability. Conditions on 5 February are characterised by a decrease of SO2concentrations, lower static stability in the morning and relatively high mixing in the evening.
Fig. 14.Same as Fig. 13 except on 4 February 2002 at 07:00 UTC(a, b)and 18:00 UTC(e, f). A close-up of the vertical distribution of the SO2concentrations (µg m−3)simulated by the chemical model at 1-km resolution at 07:00 UTC along(c)C1C2 and(d)D1D2 cross-sections
around Rijeka area.
turbulence (http://www.wrf-model.org/index.php). Accord-ing to the modelled PBL height of Rijeka, the daily max-imum on 2 February were around 900 m. Higher air tem-peratures above Rijeka are connected to the higher boundary layer. According to Jeri˘cevi´c et al. (2004), this can result in the pollutant entrainment into the boundary layer from a residual layer from the previous day. However, tracking of modelled pollutant concentrations at elevated levels, we did not find the confirmation of this hypothesis. The
Fig. 15. Vertical cross-sections of the WRF modelled wind (m s−1)and potential temperature (K) above Rijeka on 5 February 2002 at
07:00 UTC(a)and 18:00 UTC(b)along parallel cross-section (A1) to the coastline. Base of the D1D2 cross-section is shown in Fig. 1b.
(a)
0 200 400 600 800 1000 1200 1400 1600
275 277 279 281 283 285 287 289 291 293
Θ (K)
z (
m
)
02.02._07 UTC 02.02._18 UTC 03.02._08 UTC 03.02._17 UTC
(b)
0 200 400 600 800 1000 1200 1400 1600
275 277 279 281 283 285 287 289 291 293
Θ (K)
z (
m
)
04.02._07 UTC 04.02._18 UTC 05.02._07 UTC 05.02._18 UTC
Fig. 16. Modelled WRF vertical profiles of potential temperature (K) from 2 to 5 February 2002 above Rijeka. Times correspond to the times of cross-sections shown in Figs. 13–15.
0 100 200 300 400 500 600 700 800 900
24 12 24 12 24 12 24 12 24
2 Feb 3 Feb 4 Feb 5 Feb
P
B
L he
ight
(
m
)
S
O
2 co
n
cen
tr
ati
o
n
s
(μ
g m
-3 )
PBL height SO2 concentrations
Fig. 17.The daily course of the modelled WRF planetary boundary layer height (m) (black) obtained for Rijeka as well as measured SO2concentrations for Rijeka (red circles) (site 3B in Table 1 and Fig. 1b) from 2 to 6 February 2002 (source for SO2measurements:
Teaching Institute for Public Health, Rijeka).
fog, giving mixing height maxima around 400 m. The hourly modelled SO2 concentrations explicitly follow PBL height and associated meteorological conditions (especially com-pare CAMx results in Fig. 3 and Fig. 17). The increase in measured concentrations goes along with the modelled PBL height decrease (Fig. 17). Likewise, on 5 February, the in-crease of the PBL height and the dein-crease of the static sta-bility (Fig. 16) results in the hourly SO2concentrations de-crease after 10:00 UTC (Fig. 17).
6 Conclusions
mostly lower than the sea surface temperatures, and the diur-nal air temperature amplitude was low (around 3◦C). Under
such circumstances fog developed along the coast and wind speeds were very low.
Results of three air quality models at horizontal resolutions of 50, 10 and 1 km, for the EMEP, EMEP4HR and CAMx, respectively, suggested the major role of the local pollution sources in the establishment of pollution episode, while con-tribution from distant sources in Bulgaria, Bosnia and Italy to the overall recorded SO2concentration was relatively small (up to about 10%).
The episode was caused by specific, local-scale meteoro-logical conditions, which could not be captured by 50-km and 10-km resolution meteorological drivers of EMEP and EMEP4HR, respectively. However, both fine-scale (at reso-lution of 1 km) meteorological (WRF) and air quality model (CAMx) results demonstrated a successful multi-day simula-tion in the GRA and reasonable agreement with the available observations.
The WRF model results suggest several factors responsi-ble for the occurrence of the severe pollution episode. These are as follows.
– Transport of air from nearby pollution sources within the GRA towards Rijeka by south-easterly winds. These surface winds are often connected to the anti-clockwise eddy inside the Rijeka Bay, which maintains the trans-port of polluted air from the Rijeka industrial zone (oil refinery and thermo-power plant) and the island of Krk especially over its northern part, where the, petrochem-ical plant and the oil terminal are located.
– The abovementioned transport of air from the areas with major pollution sources was accompanied by a grad-ual increase of atmospheric stability during the episode. The maximum static stability occurred on 4 February limiting the dispersion of pollutants in the very low (within 140 m) mixing layer. The mixing layers were associated by the formation of a strong ground-based radiation inversion in the GRA.
– The surface wind field shows the stagnation region of airflow upstream of Rijeka which is favourable of pol-lutant accumulation (especially during 4 February, see Fig. 14e).
– The air subsidence in the lowermost layer south of Ri-jeka, further facilitates pollutant accumulation. The subsidence is a result of the circulation cell, approxi-mately 500 m deep, which is found between the main-land and the ismain-land of Cres above the lowermost approx-imately 100 m (on 3 February). This circulation cell in the vertical plain acts as a lid, which prevents the pol-lutants in the ground-based layer to dilute. During the next day, the drainage flow occurred above the circula-tion cell that existed in the first 200 m where the wind
profile exhibited calm or lower wind less than 1 m s−1. The drainage flow was related to the increase of wind speed enhancing static stability above Rijeka.
Weak winds and calms are frequent in Rijeka (e.g. Prtenjak and Grisogono, 2007), and they are not always accompanied by elevated pollutant concentrations. However, this episode was characterized by extremely low winds (wind speeds were mostly below 1 m s−1with the maximum of 1.3 m s−1) ac-companied with high static stability and prominent subsi-dence. Thus, simultaneous occurrence of all these phenom-ena, together with the airflow from industrial zones toward Rijeka town were responsible for the episode severity. Fi-nally, it can be summarized that that local meteorological conditions were extremenly favourable for the formation of this severe pollution episode.
Acknowledgements. Three anonymous referees are acknowledged for their useful suggestions. We are grateful to Teaching Institute for Public Health, Rijeka for SO2 data and Ana Alebi´c-Jureti´c
(from the same Institute) for available comments. Also, we are indebted to the Meteorological and Hydrological Service of the Republic of Croatia and the Meteorological Department of the Croatian Air Traffic Control at Zagreb Airport for providing the meteorological data. This work has been supported by the Ministry of Science, Educational and Sport (grants No. 119-1193086-1323, No. 119-1193086-1311 and No. 004-1193086-3036) and EMEP4HR project number 175183/S30 provided by the Research Council of Norway.
Edited by: D. Simpson
References
Baklanov, A. and Grisogono, B.: Amospheric boundary layers: na-ture, theory and applications to environmental modeling and se-curity, Springer, 241 pp., 2007.
Bott, A.: A positive definite advection scheme obtained by non-linear renoramlization of the advection fluxes, Mon. Weather Rev., 117, 1006–1015, 1989a.
Bott, A.: A positive definite advection scheme obtained by nonlin-ear renormalization of the advective fluxes – reply, Mon. Weather Rev., 117, 2633–2636, 1989b.
Brulfert, G., Chemel, C., Chaxel, E., and Chollet, J. P.: Modelling photochemistry in alpine valleys, Atmos. Chem. Phys., 5, 2341– 2355, 2005,
http://www.atmos-chem-phys.net/5/2341/2005/.
de Foy, B., Lei, W., Zavala, M., Volkamer, R., Samuelsson, J., Mel-lqvist, J., Galle, B., Mart´ınez, A.-P., Grutter, M., Retama, A., and Molina, L. T.: Modelling constraints on the emission inventory and on vertical dispersion for CO and SO2in the Mexico City
Metropolitan Area using Solar FTIR and zenith sky UV spec-troscopy, Atmos. Chem. Phys., 7, 781–801, 2007,
http://www.atmos-chem-phys.net/7/781/2007/.
Drobinski, P., Said, F., Arteta, J., Augustin, P., Bastin, S., Brut, A., Caccia, J. L., Campistron, B., Cautenet, S., Colette, A., Coll, I., Corsmeier, U., Cros, B., Dabas, A., Delbarre, H., Dufour, A., Durand, P., Guenard, V., Hasel, M., Kalthoff, N., Kottmeier, C., Lasry, F., Lemonsu, A., Lohou, F., Masson, V., Menut, L., Mop-pert, C., Peuch, V. H., Puygrenier, V., Reitebuch, O., and Vau-tard, R.: Regional transport and dilution during high-pollution episodes in southern France: Summary of findings from the Field Experiment to Constraint Models of Atmospheric Pollution and Emissions Transport (ESCOMPTE), J. Geophys. Res.-Atmos. 112, D13105, doi:10.1029/2006JD007494, 2007.
ENVIRON: User’s guide: CAMx comprehensive Air Quality model with Exstensions, Version 4.50. ENVIRON International Corpo-ration, Novato, CA, 2008.
Evtyugina, M. G., Nunes, T., Pio, C., and Costa, C. S.: Photochem-ical pollution under sea breeze conditions, during summer, at the Portuguese West Coast, Atmos. Environ., 40, 6277–6293, 2006. Fagerli, H., Simpson, D., and Tsyro, S. Unified EMEP model: Updates Transboundary acidification, eutrophication and ground level ozone in Europe. EMEP Status Report 1/2004, The Norwe-gian Meteorological Institute, Oslo, Norway, 11–18, 2004. Fisher, B., Joffre, S., Kukkonen, J., Piringer, M., Rotach, M. W.,
and Schatzmann, M. (Eds.): Meteorology applied to Urban Air Pollution Problems, Final Report COST Action 715, Demetra Ltd. Publishers, Bulgaria, 2005.
Geleyn, J. F., Banciu, D., Bubnova, R., Ihasz, I., Ivanovici, V., LeMoigne P., and Radnoti, G.: The International Project AL-ADIN: Summary of Events October 1992–October 1993, LAM Newsletter 23, 1992.
Gery, M. W., Whitten, G. Z., Killus, J. P., and Dodge, M. C.: A photochemical kinetics mechanism for urban and regional scale computer modelling, J. Geophys. Res., 94, 925–956, 1989. Grisogono, B., Kraljevi´c, L., and Jeri˘cevi´c, A.: The low-level
kata-batic jet height versus Monin-Obukhov height, Q. J. Roy. Mete-orol. Soc., 133, 2133–2136, 2007.
Jeri˘cevi´c, A., ˇSpoler ˘Cani´c K., and Vidi˘c, S.: Prediction of stability and mixing height in the complex orography, Cro. Meteorol. J., 39, 3–14, 2004.
Jeri˘cevi´c, A., Kraljevi´c, L., Vidi˘c, S., and Tarrason, L.: Project de-scription: High resolution environmental modelling and evalu-ation programme for Croatia (EMEP4HR), Geofizika, 24, 137– 143, online available at: http://geofizika-journal.gfz.hr/abs24 2. htm#25, 2007.
Jimenez-Guerrero, P., Jorba, O., Baidasanoa, J. M., and Gasso, S.: The use of a modelling system as a tool for air quality manage-ment: Annual high-resolution simulations and evaluation, Sci-ence Total Environ., 390, 323–340, 2008.
Kain, J. S., Weiss, S. J., Levit, J. J., Baldwin, M. E., and Bright, D. R.: Examination of convection-allowing configurations of the WRF model for the prediction of severe convective weather: The SPC/NSSL Spring Program 2004, Weather Forecast., 21, 167– 181, 2006.
Klai´c, Z.: A Lagrangian one-layer model of long-range transport of SO2, Atmos. Envrion., 24A, 1861–1867, 1990.
Klai´c, Z.: A Lagrangian model of long-range transport of sulphur with the diurnal variations of some model parameters, J. Appl. Meteorol., 35, 574–585, 1996.
Klai´c, Z. B.: Assesment of wintertime atmospheric input of Euro-pean sulfur to the eastern Adriatic, Nuovo Cimento, 26C, 1–6,
2003.
Klai´c, Z. B and Beˇsirevi´c, S.: Modelled sulphur depositions over Croatia, Meteorol. Atmos. Phys., 65, 133–138, 1998.
Klai´c, Z. B., Beluˇsi´c, D., Grubiˇsi´c, V., Gabela, L., and ´Coso, L.: Mesoscale airflow structure over the northern Croatian coast dur-ing MAP IOP 15 – a major bora event, Geofizika, 20, 23–61, 2003.
Klai´c, Z. B., Pasari´c, Z., and Tudor, M.: On the interplay between sea-land breezes and Etesian winds over the Adriatic, J. Marine Syst., in press, doi:10.1016/j.jmarsys.2009.01.016, 2009. Levy, I., Dayan, U., and Mahrer, Y.: A five-year study of
coastal recirculation and its effect on air pollutants over the East Mediterranean region, J. Geophys. Res.-Atmos, 113, D16121, doi:10.1029/2007JD009529, 2008.
Mahrt, L. and Vickers, D.: Extremely weak mixing in stable condi-tions, Bound.-Lay. Meteorol., 119, 19–39, 2006.
Mahrt, L.: The influence of nonstationarity on the turbulent flux-gradient relationship for stable stratification, Bound.-Lay. Mete-orol., 125, 245–264, 2007.
Michalakes, J., Dudhia, J., Gill, D., Henderson, T., Klemp, J., Ska-marock, W., and Wang, W.: The Weather Research and Fore-casting Model: software architecture and performance, in: 11th ECMWF Workshop on the use of High Performance Computing in Meteorology, edited by: Mozdzynski, G., Reading, UK, 2004. Natale, P., Anfossi, D., and Cassardo, C.: Analysis of an anomalous case of high air pollution concentration in Turin after a foehn event, Int. J. Environ. Pollut., 11, 147–164, 1999.
Nitis, T., Kitsiou, D., Klai´c, Z .B., Prtenjak, M. T., and Moussiopou-los, N.: The effects of basic flow and topography on the develop-ment of the sea breeze over a complex coastal environdevelop-ment, Q. J. Roy. Meteorol. Soc., 131, 305–328, 2005.
O’Brien, J. J.: A Note on the Vertical Structure of the Eddy Ex-change Coefficient in the Planetary Boundary Layer, J. Atmos. Sci., 27, 1213–1215, 1970.
Pohjola, M. A., Rantamaki, M., Kukkonen, J., Karppinen, A., and Berge, E.: Meteorological evaluation of a severe air pollution episode in Helsinki on 27–29 December 1995, Boreal Env. Res., 9, 75–87, 2004.
Prtenjak, M. T., Grisogono, B., and Nitis, T.: Shallow mesoscale flows at the north-eastern Adriatic coast, Q. J. Roy. Meteorol. Soc., 132, 2191–2215, 2006.
Prtenjak, M. T. and Grisogono, B.: Sea/land breezes climatologi-cal characteristics along the northeastern Adriatic coast, Theor. Appl. Climatol., 90, 201–215, doi:10.1007/s00704-006-0286-9, 2007.
Prtenjak, M. T., Pasari´c, Z., Orli´c, M., and Grisogono, B.: Rotation of sea/land breezes along the northeastern Adriatic coast, Ann. Geophys., 26, 1711–1724, 2008,
http://www.ann-geophys.net/26/1711/2008/.
Robinsohn, J., Mahrer, Y., and Wakshal, E.: The effects of mesoscale circulation on the dispersion of pollutants (SO2)in the eastern Mediterranean, southern coastal-plain of Israel, At-mos. Environ., 26, 271–277, 1992.
Skamarock, W. C., Klemp, J. B., Dudhia, J., Gill, D. O., Barker, D. M., Wang, W., and Powers, J. G.: A description of the Advanced Research WRF Version 2, NCAR/TN-468+STR, NCAR TECH-NICAL NOTE, 88 pp., online available at: http://www.mmm. ucar.edu/wrf/users/docs/arw v2.pdf, January 2007.
atmospheric model for weather research and forecasting applica-tions, J. Comput. Phys, 227, 3465–3485, 2008.
Skouloudis, A. N., Kassomenos, P., and Nitis, T.: Science and policy challenges of atmospheric modelling in consideration of health effects, Int. J. Environ. Pollut., accepted, 2009.
Soler, M. R., Hinojosa, J., Bravo, M., Pino, D., and de Arellano, J. V. G.: Analyzing the basic features of different complex terrain flows by means of a Doppler Sodar and a numerical model: Some implications for air pollution problems, Meteorol. Atmos. Phys., 85, 141–154, 2004.
Steenkist, R.: Episodes of high SO2concentration in The
Nether-lands, Atmos. Environ., 22, 1475–1480, 1988.
Stull, R. B.: An introduction to boundary layer meteorology, Kluwer, Dordrecht, 1988.
Tayanc, M. and Bercin, A.: SO2modeling in Izmit Gulf, Turkey
during the winter of 1997: 3 cases, Environ. Model. Assess., 12, 119–129, 2007.
Trenberth, K. E., Davis, C. A., and Fasullo, J.: Water and energy budgets of hurricanes: Case studies of Ivan and Katrina, J. Geo-phys. Res.-Atmos., 112, D23106, doi:10.1029/2006JD008303, 2007.
Vieno, M., Dore, A. J., Wind, P., Di Marco, C., Nemitz, E., Phillips, G., Tarrason, L., and Sutton, M. A.: Application of the EMEP Unified Model to the UK with a horizontal resolu-tion of 5×5 km2, in: Atmospheric Ammonia: Detecting emis-sion changes and environmental impacts, edited by: Sutton, M. A., Baker, S., and Reis, S., Springer, 464 pp., 2009.
Vieno, M., Dore, A. J., Stevenson, D. S., Doherty, R., Heal, M., Reis, S., Hallsworth, S., Tarras´on, L., Wind, P., and Sutton, M. A.: ’MODELLING SURFACE OZONE DURING THE 2003 HEAT WAVE IN THE UK, ’Croatian Meteorological Journal 43, The 12th International Conference on Harmonizaton within Atmospheric Dispersion Modelling for Regulatory Purposes, HARMO 12, Djuri˘ci´c, V., Zagreb, Croatian Meteorological So-ciety, 83–87, 2008.
Willmott, C. J.: Some comments on the evaluation of model perfor-mance, B. Am. Meteorol. Soc., 63, 1309–1313, 1982.