AMTD
8, 6993–7056, 2015Overview of the O3M SAF GOME-2
operational atmospheric composition
S. Hassinen et al.
Title Page
Abstract Introduction
Conclusions References
Tables Figures
◭ ◮
◭ ◮
Back Close
Full Screen / Esc
Printer-friendly Version Interactive Discussion
Discussion
P
a
per
|
Discussion
P
a
per
|
Discussion
P
a
per
|
Discussion
P
a
per
|
Atmos. Meas. Tech. Discuss., 8, 6993–7056, 2015 www.atmos-meas-tech-discuss.net/8/6993/2015/ doi:10.5194/amtd-8-6993-2015
© Author(s) 2015. CC Attribution 3.0 License.
This discussion paper is/has been under review for the journal Atmospheric Measurement Techniques (AMT). Please refer to the corresponding final paper in AMT if available.
Overview of the O3M SAF GOME-2
operational atmospheric composition and
UV radiation data products and data
availability
S. Hassinen1, D. Balis2, H. Bauer3, M. Begoin3, A. Delcloo4, K. Eleftheratos5, S. Gimeno Garcia3, J. Granville6, M. Grossi3, N. Hao3, P. Hedelt3, F. Hendrick6, M. Hess7, K.-P. Heue3, J. Hovila1, H. Jønch-Sørensen8, N. Kalakoski1, S. Kiemle3, L. Kins7, M. E. Koukouli2, J. Kujanpää1, J.-C. Lambert6, C. Lerot6, D. Loyola3, A. Määttä1, M. Pedergnana3, G. Pinardi6, F. Romahn3, M. van Roozendael6, R. Lutz3, I. De Smedt6, P. Stammes9, W. Steinbrecht7, J. Tamminen1, N. Theys6, L. G. Tilstra9, O. N. E. Tuinder9, P. Valks3, C. Zerefos5, W. Zimmer3, and
I. Zyrichidou2
1
Finnish Meteorological Institute, Helsinki, Finland
2
Aristotle University of Thessaloniki, Thessaloniki, Greece
3
Deutsches Zentrum für Luft- und Raumfahrt, DLR, Oberpfaffenhofen, Germany
4
Royal Meteorological Institute, Brüssel, Belgium
5
AMTD
8, 6993–7056, 2015Overview of the O3M SAF GOME-2
operational atmospheric composition
S. Hassinen et al.
Title Page
Abstract Introduction
Conclusions References
Tables Figures
◭ ◮
◭ ◮
Back Close
Full Screen / Esc
Printer-friendly Version Interactive Discussion
Discussion
P
a
per
|
Discussion
P
a
per
|
Discussion
P
a
per
|
Discussion
P
a
per
|
6
Belgian Institute for Space Aeronomy, BIRA-IASB, Brussels, Belgium
7
German Weather Service, Offenbach, Germany
8
Danish Meteorological Institute, Copenhagen, Danmark
9
Royal Netherlands Meteorological Institute, De Bilt, the Netherlands
Received: 29 April 2015 – Accepted: 10 June 2015 – Published: 09 July 2015 Correspondence to: S. Hassinen ([email protected])
AMTD
8, 6993–7056, 2015Overview of the O3M SAF GOME-2
operational atmospheric composition
S. Hassinen et al.
Title Page
Abstract Introduction
Conclusions References
Tables Figures
◭ ◮
◭ ◮
Back Close
Full Screen / Esc
Printer-friendly Version Interactive Discussion
Discussion
P
a
per
|
Discussion
P
a
per
|
Discussion
P
a
per
|
Discussion
P
a
per
|
Abstract
The three GOME-2 instruments will provide unique and long data sets for atmospheric research and applications. The complete time period will be 2007–2022, including the period of ozone depletion as well as the beginning of ozone layer recovery. Besides ozone chemistry, the GOME-2 products are important e.g. for air quality studies,
cli-5
mate modeling, policy monitoring and hazard warnings. The heritage for GOME-2 is in the ERS/GOME and Envisat/SCIAMACHY instruments. The current Level 2 (L2) data cover a wide range of products such as trace gas columns (NO2, BrO, H2CO, H2O, SO2), tropospheric columns of NO2, total ozone columns and vertical ozone profiles in high and low spatial resolution, absorbing aerosol indices from the main science
chan-10
nels as well as from the polarization channels (AAI, AAI-PMD), Lambertian-equivalent reflectivity database, clear-sky and cloud-corrected UV indices and surface UV fields with different weightings and photolysis rates. The Ozone Monitoring and Atmospheric Composition Satellite Application Facility (O3M SAF) processing and data dissemina-tion is operadissemina-tional and running 24/7. Data quality is quarantined by the detailed review
15
processes for the algorithms, validation of the products as well as by a continuous quality monitoring of the products and processing. This is an overview paper provid-ing the O3M SAF project background, current status and future plans to utilization of the GOME-2 data. An important focus is the provision of summaries of the GOME-2 products including product principles and validation examples together with the product
20
sample images. Furthermore, this paper collects the references to the detailed product algorithm and validation papers.
1 Introduction
The anthropogenic changes in atmospheric composition and chemistry cause climate warming, pollution and changes in the oxidizing efficiency of atmosphere. All these
25
AMTD
8, 6993–7056, 2015Overview of the O3M SAF GOME-2
operational atmospheric composition
S. Hassinen et al.
Title Page
Abstract Introduction
Conclusions References
Tables Figures
◭ ◮
◭ ◮
Back Close
Full Screen / Esc
Printer-friendly Version Interactive Discussion
Discussion
P
a
per
|
Discussion
P
a
per
|
Discussion
P
a
per
|
Discussion
P
a
per
|
of the atmospheric composition as well as the coupling between climate and chemistry is a challenge which requires an efficient global monitoring system of ozone and other trace gases, ultraviolet radiation, primary pollutants and pre-cursors, together with the distribution and properties of aerosols. With the recent volcanic eruptions posing haz-ards and economic losses to the European aviation business, detection of volcanic
5
sulfur dioxide and aerosols from satellites has become an important part of the remote sensing of the atmosphere. Satellite-based observations form an important part of this global observing system as they can provide global, three-dimensional coverage with a regular repeat cycle.
The Global Ozone Monitoring Experiment-2 (GOME-2) instrument is targeted to
ful-10
fill these expectations. It is one of the new-generation European instruments carried on Metop platforms which are part of the EUMETSAT Polar System (EPS). The GOME-2 instruments will continue the long-term monitoring of atmospheric constituents started by GOME on ERS-2 (Callies et al., 2000; Munro et al., 2006) and SCIAMACHY on En-visat (Bovensmann et al., 1999). As an operational mission, continuity of observations
15
is ensured by three identical instruments onboard three Metop platforms: A, B and C: the first was launched in 2006, the second in 2012 and the last one will be launched in 2017. The GOME-2 instruments will provide unique long term data sets of 15 years related to atmospheric composition and surface ultra violet (UV) radiation using sta-ble retrieval techniques. The GOME-2 is set to make a significant contribution towards
20
climate and atmospheric research, whilst providing near real-time data for use in air quality forecasting.
The provision of an operational 24/7 service is also an important response to the expectations outlined above. Thus, the Level 2 (L2) GOME-2 product development, processing, dissemination and user services are the responsibility of the Satellite
Ap-25
AMTD
8, 6993–7056, 2015Overview of the O3M SAF GOME-2
operational atmospheric composition
S. Hassinen et al.
Title Page
Abstract Introduction
Conclusions References
Tables Figures
◭ ◮
◭ ◮
Back Close
Full Screen / Esc
Printer-friendly Version Interactive Discussion
Discussion
P
a
per
|
Discussion
P
a
per
|
Discussion
P
a
per
|
Discussion
P
a
per
|
ground segment processing chains have been reviewed keeping in mind the 24/7 requirement for processing and dissemination. The production includes continuous quality control for the processing and products. These requirements for production ful-fills the expectations of the key users, like CAMS (Copernicus Atmosphere Monitoring Service), ECMWF (The European Centre for Medium-Range Weather Forecasts) and
5
VAACs (Volcanic Ash Advisory Centres). The other areas where the GOME-2 prod-ucts are used, cover a wide range of applications from monitoring of volcanic emis-sions to atmospheric research and from the air quality assessments to UV radiation warnings. Other users of the GOME-2 data include SACS (Support to Aviation Control Service), WMO (World Meteorological Organization) programs and research institutes
10
and health organizations. GOME-2 products from the O3M SAF project are the only European operational products of this class with a long period of data availability and quality control.
The current L2 data cover a wide range of products, such as ozone and trace gas columns (total and tropospheric NO2, total BrO, HCHO, H2O, SO2), vertical ozone
15
profiles in high and low spatial resolution, absorbing aerosol indices from the main sci-ence channels as well as from the polarization channels (AAI, AAI-PMD), Lambertian-equivalent reflectivity database, clear-sky and cloud-corrected UV indices and surface UV fields with different weightings and NO2 and O3 photolysis rates. In future, the products will include tropospheric columns of O3 and BrO as well as special climatic
20
data sets of H2O and NO2. The products are disseminated in the Near Real Time (NRT) streams via EUMETCast, which is a multi-service dissemination system based on standard Digital Video Broadcast (DVB) technology and uses commercial telecom-munication geostationary satellites to multi-cast files (data and products) to a wide user community. Furthermore, the NRT products are available via WMO GTS (Global
25
Telecommunication System) whereas data-records and offline products are available via the O3M SAF data services and EUMETSAT Data Center.
AMTD
8, 6993–7056, 2015Overview of the O3M SAF GOME-2
operational atmospheric composition
S. Hassinen et al.
Title Page
Abstract Introduction
Conclusions References
Tables Figures
◭ ◮
◭ ◮
Back Close
Full Screen / Esc
Printer-friendly Version Interactive Discussion
Discussion
P
a
per
|
Discussion
P
a
per
|
Discussion
P
a
per
|
Discussion
P
a
per
|
2 (CDOP-2) started in 2012 and the third will start in 2017. Besides GOME-2 prod-ucts, the project, together with the EUMETSAT Central Facilities, will also provide also some new IASI products developed by LATMOS (Laboratoire Atmosphères, Milieux, Observations Spatiales) and ULB (Université libre de Bruxelles). The first IASI prod-uct, carbon monoxide, will be released in fall 2015. The project description as well as
5
product information, documentation, Helpdesk, user services and the dissemination services are available from the project web site (http://o3msaf.fmi.fi).
The purpose of this paper is to give an overall description of the GOME-2 activities and products provided by the O3M SAF project. The paper is organized as follows: the instrument and ground segment, retrieved parameters with key validation summary,
10
emerging products and dissemination and user services.
2 The GOME-2 instrument
The GOME-2 (The Global Ozone Monitoring Experiment-2) instruments onboard the Metop satellite platforms are direct successors to GOME instrument that was flying onboard the ERS-2 platforms and thus, the basic concept is the same. However, quite
15
a number of changes to the GOME instrument design have been imposed by the fact that Metop is a very different satellite from ERS-2, designed for a different orbit. For example, the new orbit imposes a different viewing angle to the Sun, for in-orbit cal-ibration purposes, and some moderate changes in the instrument’s thermal environ-ment (Callies et al., 2000). The scientific objectives have a direct heritage from the
20
GOME mission. The GOME general objectives, as listed in Burrows et al. (1993), were: (a) to improve understanding of the processes controlling global bio-geochemical cy-cles in the troposphere and stratosphere and (b) to monitor natural and anthropogenic changes in the composition of the atmosphere. The more detailed scientific objectives for GOME and thus also for GOME-2 and based on Burrows et al. (1993) are:
mea-25
AMTD
8, 6993–7056, 2015Overview of the O3M SAF GOME-2
operational atmospheric composition
S. Hassinen et al.
Title Page
Abstract Introduction
Conclusions References
Tables Figures
◭ ◮
◭ ◮
Back Close
Full Screen / Esc
Printer-friendly Version Interactive Discussion
Discussion
P
a
per
|
Discussion
P
a
per
|
Discussion
P
a
per
|
Discussion
P
a
per
|
BrO), measurement of column amounts of H2O, measurements of pollutants such as SO2 and H2CO and measurements of atmospheric aerosols and spectral reflectance. The GOME-2 instrument was designed and build at the time of the strongest ozone de-pletion and thus, one of it’s main objectives is to monitor ozone, ozone chemistry and the development of the ozone depletion. The ozone layer is on track to recovery, states
5
the WMO Assessment for Decision-Makers: Scientific Assessment of Ozone Deple-tion: 2014 (World Meteorological Organization 2014). Thus, the scientific value of the GOME-2 instrument measurements will also continue in the future.
The GOME-2 instrument is a nadir looking scanning UV-VIS spectrometer that mea-sures backscattered solar light. GOME-2 comprises four main optical channels of
10
1024 pixels giving in total 4096 spectral channels for a range of 240–790 nm and a spectral resolution of 0.26–0.51 nm. Furthermore, the two Polarization Measurement Devices (PMDs) containing the same type of arrays for measurement of linearly polar-ized intensity in two perpendicular directions provide 30 broad-band polarization chan-nels.
15
The Metop satellites are flying on a sun-synchronous orbit with an equator crossing time of about 09:30 LT (descending node) and a repeat cycle of 29 days. The default swath width of the GOME-2 scan is 1920 km, which gives a nadir pixel size of 80 km×
40 km (across-track×along-track) and enables global coverage in about 1.5 days. The
current primary GOME-2 onboard Metop-B platform (GOME-2B) is operated in this
20
mode whereas the older, GOME-2 onboard Metop-A platform (GOME-2A) is operated in a reduced swath width mode with a swath width of 960 km and nadir ground pixel size of 40 km×40 km. The GOME-2A is expected to be operational until the launch of
the Metop-C platform in 2017.
More details with the GOME-2 fact-sheet may be found from http://www.eumetsat.
25
AMTD
8, 6993–7056, 2015Overview of the O3M SAF GOME-2
operational atmospheric composition
S. Hassinen et al.
Title Page
Abstract Introduction
Conclusions References
Tables Figures
◭ ◮
◭ ◮
Back Close
Full Screen / Esc
Printer-friendly Version Interactive Discussion
Discussion
P
a
per
|
Discussion
P
a
per
|
Discussion
P
a
per
|
Discussion
P
a
per
|
3 L0 and L1 processing
The EUMETSAT central processing facility, located in Darmstadt, is responsible for the processing of all GOME-2 data up to Level 1b. This processing is carried out within the Core Ground Segment (CGS) by the GOME-2 Product Processing Facility (PPF) which converts raw instrument data (Level 0 data stream) into time-stamped, geolocated, and
5
fully spectrally and radiometrically calibrated radiances or irradiances (Level 1b data stream). The Level 1b data is delivered to the L2 processing centers in Near Real Time via EUMETCast. The details of GOME-2 instrument design, calibration and L1 processing will be available from Munro et al. (2015).
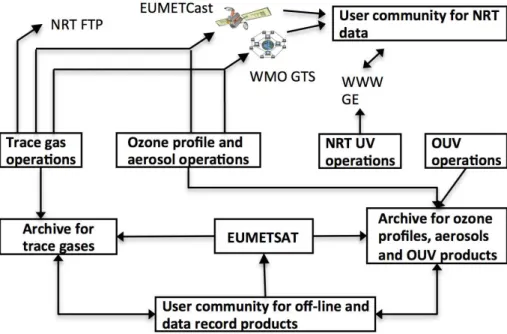
4 L2 processing and archiving services
10
The O3M SAF GOME-2 L2 products are developed and processed in a distributed EUMETSAT ground segment with four processing centers and two archives (Fig. 1). The Leading Entity, FMI (Finnish Meteorological Institute), processes and archives the offline UV products as well as archives the offline absorbing aerosol index and vertical ozone profile products and LER (Lambertian equivalent reflectivity) data set processed
15
at KNMI (Royal Netherlands Meteorological Institute). DLR (Deutsches Zentrum für Luft- und Raumfahrt) processes, archives and disseminates total and tropospheric trace gas column products. The NRT products are disseminated via EUMETCast and WMO GTS network directly by the processing centers except the NRT UV products which are processed in by the Danish Meteorological Institute (DMI) and distributed via
20
http and FTP. The internal O3M SAF product, assimilated GOME-2 total ozone analy-sis and forecast (Eskes et al., 2003), is based on O3M SAF GOME-2 total ozone and processed by KNMI and used by DMI in NRT UV production Furthermore, the internal cloud products needed for trace gas retrievals are processed by DLR.
The O3M SAF GOME-2 products undergo an extensive review process during the
25
AMTD
8, 6993–7056, 2015Overview of the O3M SAF GOME-2
operational atmospheric composition
S. Hassinen et al.
Title Page
Abstract Introduction
Conclusions References
Tables Figures
◭ ◮
◭ ◮
Back Close
Full Screen / Esc
Printer-friendly Version Interactive Discussion
Discussion
P
a
per
|
Discussion
P
a
per
|
Discussion
P
a
per
|
Discussion
P
a
per
|
are an important part of this review process. The validation is mainly performed by the specialized validation entities AUTH (Aristotle University of Thessaloniki), BIRA (Bel-gian Institute for Space Aeronomy), DWD (German Weather Service) and RMI (Royal Meteorological Institute). On top of that, online quality monitoring services have been implemented by the processing and validation institutes so that the product users may
5
check the latest information regarding the product quality. Online quality monitoring uses external satellite and ground-based data and plotting of trends and special pa-rameters. The data delay is from a few minutes up to a few days depending on what kind of method is used. Furthermore, special user services of climatological proxies and BEAT (Basic Envisat Atmospheric Toolbox) support are provided by MKF
(Mari-10
olopoulos – Kanaginis Foundation) and the S & T private company respectively. All the product documentation, such as ATBDs (Algorithm Theoretical Basis Doc-uments), validation reports and Product User Manuals (PUMs) as well as ordering interfaces and links to validation and online quality monitoring sites are available from the project web site: http://o3msaf.fmi.fi.
15
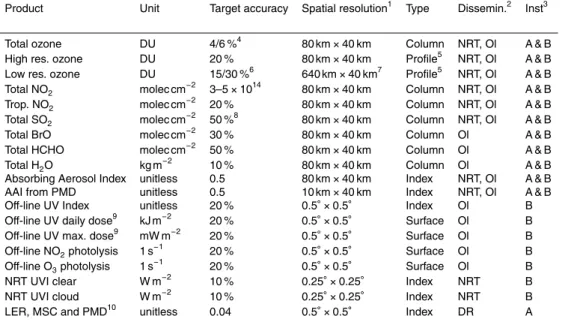
5 Operational O3M SAF GOME-2 products
The currently operational and available products are shown in Table 1. The following sub-chapters provide an overview of those products with some validation examples. Most of the products are available both from the Metop-A instrument as well as from the Metop-B instrument. By using both of those instruments together, global coverage
20
may be obtained in one day. Merged L3 products will be available during the CDOP-3 phase, starting in 2017.
5.1 Vertical column densities of ozone and other trace gases
The vertical column densities of ozone and other trace gases are retrieved with the GDP (GOME Data Processor). The retrieval of the trace gas column products with the
AMTD
8, 6993–7056, 2015Overview of the O3M SAF GOME-2
operational atmospheric composition
S. Hassinen et al.
Title Page
Abstract Introduction
Conclusions References
Tables Figures
◭ ◮
◭ ◮
Back Close
Full Screen / Esc
Printer-friendly Version Interactive Discussion
Discussion
P
a
per
|
Discussion
P
a
per
|
Discussion
P
a
per
|
Discussion
P
a
per
|
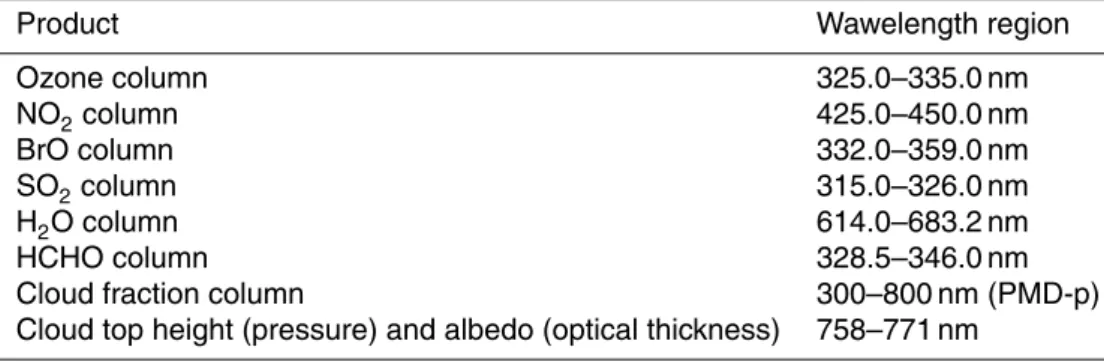
GDP is based on the Differential Optical Absorption Spectroscopy (DOAS) method Platt and Stutz (2008).The latest operational version is 4.7 whereas the updated version 4.8 will be implemented in fall 2015. Table 2 lists the GOME-2 trace gas column and cloud products generated by the O3MSAF, with the corresponding wavelength regions used for the retrieval.
5
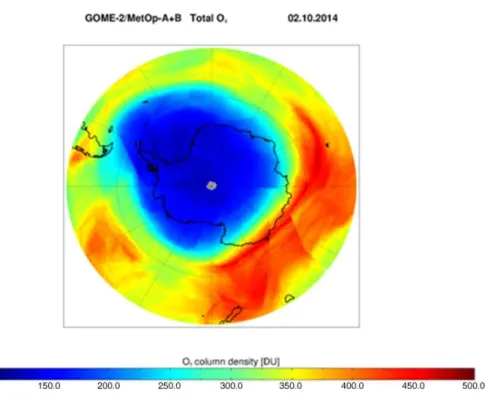
5.1.1 Total ozone column
Total ozone columns are retrieved from GOME-2 (ir)radiance spectra using the DOAS method (Platt and Stutz, 2008) in the wavelength region 325–335 nm (Huggins ab-sorption band). The fitting includes an effective temperature for the ozone absorption, an NO2absorption cross-section, and scaling factors for interference due to the Ring
10
effect. The retrieved ozone slant column densities are converted to vertical columns (VCD) using an iterative air mass factor (AMF). A detailed description of the GOME-2 total ozone column algorithm can be found in Van Roozendael et al. (2006); Loyola et al. (2011) and Hao et al. (2014). Figure 2 shows one example of the total ozone product: the Antarctic ozone hole for 2 October 2014 measured from GOME-2A and
15
GOME-2B when the minimum total ozone column reached around 120 DU.
The total ozone NRT and offline products from GOME-2A and GOME-2B are pe-riodically validated and routinely monitored for their quality. For this purpose, in the frame of the EUMETSAT O3M SAF project, a dedicated web-portal is available at http://lap3.physics.auth.gr/eumetsat. In this portal, online comparisons with quality
as-20
sured ground-based total ozone measurements are available. The reference data for the offline total ozone comparisons are archived Brewer, Dobson and M-124 total ozone data, as these are deposited at the World Ozone and UV Data Centre (http: //www.woudc.org) and are employed after being thoroughly controlled for their qual-ity. These online comparisons are routinely and automatically updated every month.
25
AMTD
8, 6993–7056, 2015Overview of the O3M SAF GOME-2
operational atmospheric composition
S. Hassinen et al.
Title Page
Abstract Introduction
Conclusions References
Tables Figures
◭ ◮
◭ ◮
Back Close
Full Screen / Esc
Printer-friendly Version Interactive Discussion
Discussion
P
a
per
|
Discussion
P
a
per
|
Discussion
P
a
per
|
Discussion
P
a
per
|
Center (http://lap.physics.auth.gr/ozonemaps2/), are downloaded and compared to the GOME-2A and GOME-2B near real-time observations on a weekly basis.
Comparison results for the GOME-2A offline data for the period 2007–2011, pro-cessed with GDP4.4 (Loyola et al., 2011), have been previously presented by Koukouli et al. (2012) indicating that GOME-2 total ozone data agree at the 1 % level with the
5
ground-based measurements as well as other satellite instrument datasets, showing a small dependency on solar zenith angle for angles less than 75◦ and almost no
de-pendency on cloud fraction and cloud top pressure. Results from an initial validation of the GOME-2B offline data, processed with GDP4.7 for the year 2013, have been presented in Hao et al. (2014). These results show an excellent consistency with
co-10
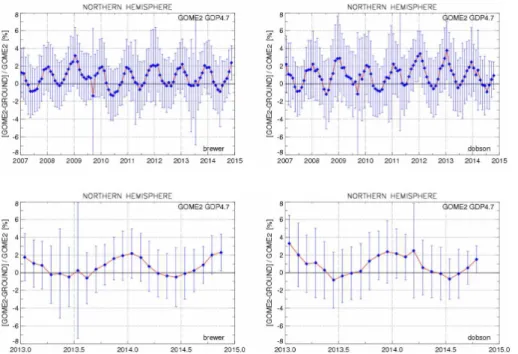
incident GOME-2A total ozone measurements. In Fig. 3 we present an updated time series of the differences between GOME-2A and GOME-2B vs. Dobson and Brewer total ozone data, averaged over the Northern Hemisphere for the period 2007–2014 inclusive. This confirms the consistency between the two satellite data sets as well as their long-term stability. The use of BDM (Brion, Daumont, and Malicet) absorption
15
cross sections (Malicet et al., 1995) in the GDP4.7 version of the algorithm explains the overestimation of GOME-2 data, compared with the results presented earlier by Koukouli et al. (2012). Both satellites are consistent over the Northern Hemisphere with negligible latitudinal dependence, while over the Southern Hemisphere there is a systematic difference of 1 % between the two satellite instruments.
20
In addition to the comparisons with the ground-based data, GOME-2 total ozone has been analyzed against dynamical proxies such as the QBO, ENSO, NAO, etc. The tar-get is to verify the amplitude of these proxies in the GOME-2 total ozone and if these proxies are consistent with other satellite date sets, as well as model simulations (Eleft-heratos et al., 2015). The upper panel of Fig. 4 shows the amplitude of ENSO in the
25
AMTD
8, 6993–7056, 2015Overview of the O3M SAF GOME-2
operational atmospheric composition
S. Hassinen et al.
Title Page
Abstract Introduction
Conclusions References
Tables Figures
◭ ◮
◭ ◮
Back Close
Full Screen / Esc
Printer-friendly Version Interactive Discussion
Discussion
P
a
per
|
Discussion
P
a
per
|
Discussion
P
a
per
|
Discussion
P
a
per
|
of 12 DU which corresponds to 4 % of the annual mean. The lower panel presents the corresponding analysis for the North Atlantic Oscillation for the northern mid-latitude region. Also here the NAO signal is consistent between the three datasets, showing an amplitude of 18 DU which corresponds to 6 % of the annual mean.
A wide community is using the GOME-2 total ozone product provided by the
5
O3M SAF. Since October 2013, total ozone column data are assimilated in the GMES/Copernicus (Global Monitoring for Environment and Security) atmosphere core service project MACC-II (Monitoring Atmospheric Composition and Climate – Interim Implementation) NRT system. The GOME-2 ozone columns are also used in the In-tegrated Forecast System (IFS) of the European Centre for Medium-Range Weather
10
Forecasts (ECMWF). Furthermore, the GOME-2 total ozone data was used in the WMO/UNEP Scientific Assessment of Ozone Depletion reports of 2010 (World Meteo-rological Organization 2011) and 2014 (in preparation). Other users are WMO WOUDC (World Ozone and Ultraviolet Radiation Data Centre), WMO OMP (Ozone Mapping Centre), DLR WDC-RSAT (World Data Center for Remote Sensing of the Atmosphere),
15
and ESA TEMIS (Tropospheric Emission Monitoring Internet Service), for example.
5.1.2 Total and tropospheric NO2column
NO2 plays a key role in air quality and atmospheric chemistry. It is an air pollutant af-fecting human health and ecosystems, and an important ozone precursor. In addition, NO2 is involved in ozone depletion processes in the stratosphere and it is important
20
for climate change studies, because of the indirect effect on the global climate. Total NO2columns, including a tropospheric and stratospheric component, are retrieved with the DOAS method in the VIS wavelength region 425–450 nm (Valks et al., 2011). To obtain the stratospheric NO2 component from the total NO2 column, a spatial filter-ing approach is used. After the stratosphere-troposphere separation, the tropospheric
25
AMTD
8, 6993–7056, 2015Overview of the O3M SAF GOME-2
operational atmospheric composition
S. Hassinen et al.
Title Page
Abstract Introduction
Conclusions References
Tables Figures
◭ ◮
◭ ◮
Back Close
Full Screen / Esc
Printer-friendly Version Interactive Discussion
Discussion
P
a
per
|
Discussion
P
a
per
|
Discussion
P
a
per
|
Discussion
P
a
per
|
period 2007–2013. The world’s largest area with high NO2 pollution is found above eastern China, which is a result of China’s spectacular economic growth during the last decade, accompanied by a strong increase in emissions of air pollutants. Another remarkable feature visible in Fig. 5 is the enhanced tropospheric NO2 along shipping lanes in the Bay of Bengal and the South China Sea, like in Richter et al. (2011). The
5
GOME-2 tropospheric NO2columns are used in the MACC-II NRT system and in sup-port of regional (e.g. European) air quality models, for example. The NO2 products from the O3M-SAF are also used by a number of research institutes for various appli-cations such as verification of emissions, investigation of regional and global trends, and assessment of chemistry-transport models.
10
The near real-time and offline total and tropospheric NO2 products are regularly validated and monitored by comparing to: (1) data sets acquired by other satel-lites (GOME, SCIAMACHY, OMI) and GOME-2 retrievals performed with other pro-cessors (such as the TEMIS system, http://www.temis.nl) and (2) ground-based ref-erence measurements acquired by UV-visible DOAS spectrometers performing
net-15
work operation in the framework of the Network for the Detection of Atmospheric Composition Change (NDACC, http://ndacc.org) and zenith-sky looking spectrome-ters for the NO2 stratospheric column and multi-axis (MAX-DOAS) spectrometers for the NO2 tropospheric column. Detailed validation results for GOME-2A can be found in Valks et al. (2011). The dedicated O3M SAF BIRA-IASB validation website
20
(http://cdop.aeronomie.be/validation) gathers the latest validation results.
The step by-step verification of the operational 2B product against GOME-2A, and GOME-2A and B alternative retrievals, has highlighted a global underesti-mation by GOME-2B slant columns of 1×10¹⁵molec cm−2with respect to GOME-2A,
which translates into a bias of 0.15×10¹⁵and 0.4×10¹⁵molec cm−2in total and strato-25
spheric columns. GOME-2B tropospheric column data underestimate GOME-2A by less than 0.5×10¹⁵molec cm−2 in moderately polluted conditions, while larger diff
er-ences (up to 8×10¹⁵molec cm−2) occur in polluted regions. The latter can be explained
as-AMTD
8, 6993–7056, 2015Overview of the O3M SAF GOME-2
operational atmospheric composition
S. Hassinen et al.
Title Page
Abstract Introduction
Conclusions References
Tables Figures
◭ ◮
◭ ◮
Back Close
Full Screen / Esc
Printer-friendly Version Interactive Discussion
Discussion
P
a
per
|
Discussion
P
a
per
|
Discussion
P
a
per
|
Discussion
P
a
per
|
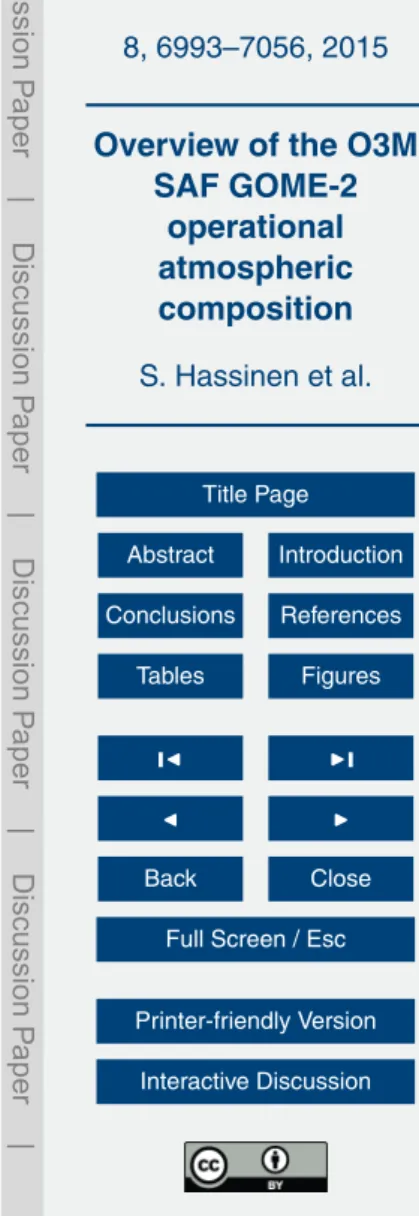
sociated impact of the variability in NO2 content and cloud cover on the comparison results. Figure 6 presents, from pole to pole, the median bias and spread for total NO2 between GOME-2A/B total NO2and correlative ground-based measurements acquired by 25 zenith-sky DOAS instruments. Prior to the comparisons, GOME-2/NDACC co-located data are filtered to avoid GOME-2 data contaminated by tropospheric pollution,
5
and corrected for photochemical diurnal effects (arising from solar local time differences between NDACC and Metop observations). Only the latest, consolidated versions of the NDACC data are considered for Fig. 6 (no NRT data), and only the GOME-2 for-ward pixels (no backfor-ward pixels). Figure 6 illustrates the good agreement between the different stratospheric NO2data sets, usually within 0.1–0.5×10¹⁴molec cm−2, a value 10
close to the combined uncertainty of the comparison method. Nevertheless, the slight bias between GOME-2A and GOME-2B data is also seen, GOME-2B underestimating GOME-2A by about 1–3×10¹⁴molec cm−2(bias propagated from the retrieval of slant
columns densities), as well as another slight bias of 2–5×10¹⁴molec cm−2 between
comparison results averaged over the Northern Hemisphere and those averaged over
15
the Southern Hemisphere.
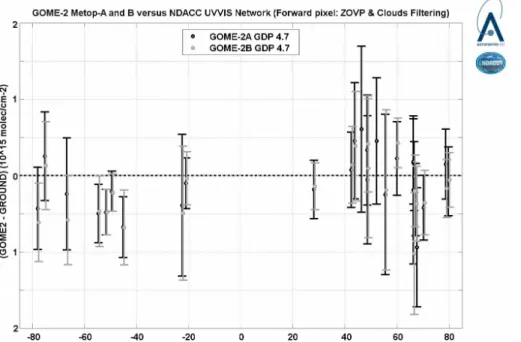
Figure 7 presents some examples of validation results for tropospheric NO2 GOME-2 columns based on BIRA-IASB MAXDOAS stations. As can be seen in Fig. 7a, very different conditions of tropospheric NO2 are sampled at the four stations, from clean/remote region (OHP, south of France), city (Uccle, Belgium) and heavily polluted
20
region in Beijing and Xianghe in China (just outside the city, at 60 km south-east of Beijing). Figure 7b present the scatter plots of the monthly means at the four stations. Good correlations between GOME-2A and the ground-based MAXDOAS data are ob-tained, both in terms of correlation coefficientsR (ranging from 0.65 in Uccle to 0.92 in Beijing) and slopes of the regression analysisS, with values 0.8 at Xianghe, slightly
25
AMTD
8, 6993–7056, 2015Overview of the O3M SAF GOME-2
operational atmospheric composition
S. Hassinen et al.
Title Page
Abstract Introduction
Conclusions References
Tables Figures
◭ ◮
◭ ◮
Back Close
Full Screen / Esc
Printer-friendly Version Interactive Discussion
Discussion
P
a
per
|
Discussion
P
a
per
|
Discussion
P
a
per
|
Discussion
P
a
per
|
moved to the Xianghe site outside the city, in a zone more representative of what seen by a satellite pixel. This “urban effect” has been also highlighted in larger scale comparisons started in Pinardi et al. (2014) for total, stratospheric and tropospheric GOME-2 NO2 columns compared to DirectSun, ZenithSky and MAXDOAS datasets. Figure 7c presents an example of the time-series of GOME-2A and B above OHP and
5
its comparisons to ground-based MAXDOAS tropospheric NO2 data, extending the results presented in Valks et al. (2011). The pollution episodes are well captured by both GOME-2 instruments and the comparisons of monthly averaged columns show consistent seasonal variations, with high NO2in winter and low NO2in summer.
5.1.3 Total H2CO column
10
Atmospheric formaldehyde (H2CO) is an intermediate product common to the degra-dation of many volatile organic compounds and therefore it is a central component of tropospheric chemistry. While the global formaldehyde background is due to methane oxidation, emissions of non-methane volatile organic compounds (NMVOCs) from bio-genic, biomass burning and anthropogenic continental sources result in important
15
and localized enhancements of the H2CO concentration. Improving our knowledge of NMVOC emissions is essential for a better understanding of the processes that control the production and the evolution of tropospheric ozone, a key actor in air quality and climate change, but also of the hydroxyl radical OH, the main cleansing agent of our troposphere. As the lifetime of H2CO is typically a few hours, enhanced concentrations
20
serve as tracer for reactive NMVOC emissions (Fig. 8). Moreover, H2CO satellite ob-servations are used in combination with tropospheric chemistry transport models to constrain NMVOC emission inventories in so-called top-down inversion approaches. Satellite H2CO and NO2observations are also combined to estimate VOC/NOxratios, and thereby the local chemical regime of tropospheric ozone production. The main
25
AMTD
8, 6993–7056, 2015Overview of the O3M SAF GOME-2
operational atmospheric composition
S. Hassinen et al.
Title Page
Abstract Introduction
Conclusions References
Tables Figures
◭ ◮
◭ ◮
Back Close
Full Screen / Esc
Printer-friendly Version Interactive Discussion
Discussion
P
a
per
|
Discussion
P
a
per
|
Discussion
P
a
per
|
Discussion
P
a
per
|
Common settings are used for GOME-2A and GOME-2B retrievals. The H2CO slant column inversion is performed in the UV wavelength range 328.5–346 nm, and includes a post-treatment for systematic biases based on a latitude dependent offset correction. Tropospheric H2CO vertical columns are calculated using air mass factors that depend on the solar and viewing geometries, the surface albedo, cloud fraction and cloud top
5
height (OCRA/ROCINN product), and the H2CO profile shape which is derived from 3-dimensional chemical-transport model simulations obtained using the IMAGES model (Stavrakou et al., 2009).
For the validation of the H2CO columns a step-by-step verification of the operational product against the reference scientific GOME-2 H2CO retrieval algorithm (De Smedt
10
et al., 2012) has been performed. An example of this verification is given in Fig. 9 for two different emissions regions: Northern China and Amazonia. GOME-2B H2CO slant columns, fit residuals, and scatter are comparable to those obtained from GOME-2A spectra at the beginning of the mission in 2007, both for the operational and scientific products. The effect of Metop-A degradation (increase of the DOAS fit RMS with time)
15
is clearly visible. Differences between operational and scientific datasets are within 40 and 28 % for Metop-A since 2007 and within 20 and 13 % for Metop-B since December 2012, for Amazonia and Northern China respectively. GOME-2 A and B GDP 4.7 H2CO retrievals are in very good agreement with the reference scientific retrievals when using the same settings (not shown here). The reduced H2CO slant column noise level in the
20
scientific algorithm presented here (v14) is obtained by pre-fitting BrO in a separate larger interval (328.5–359 nm) which allows decorrelation of H2CO and BrO diff eren-tial absorption structures (De Smedt et al., 2012). Remaining differences between the operational and scientific H2CO vertical columns are mainly related to the different in-put parameters used for the air mass factor calculation, namely the cloud product and
25
AMTD
8, 6993–7056, 2015Overview of the O3M SAF GOME-2
operational atmospheric composition
S. Hassinen et al.
Title Page
Abstract Introduction
Conclusions References
Tables Figures
◭ ◮
◭ ◮
Back Close
Full Screen / Esc
Printer-friendly Version Interactive Discussion
Discussion
P
a
per
|
Discussion
P
a
per
|
Discussion
P
a
per
|
Discussion
P
a
per
|
other H2CO satellite datasets, such as GOME, SCIAMACHY and OMI instruments as well as direct comparisons with ground-based MAXDOAS and/or FTIR instruments are planned to be performed in a near future.
5.1.4 Total SO2column
Volcanic SO2measurements from satellites provide critical information for aviation
haz-5
ard mitigation and early warning of volcanic unrest. In several regions (e.g. South-East Asia), SO2 is an important air pollutant affecting human health and ecosystems, and it is responsible for the production of acid rain. Furthermore, sulfate aerosol is impor-tant for climate monitoring, since it affects the Earth’s radiative balance by scattering incident sunlight back to space. The global SO2emissions are shown in the Fig. 10.
10
The DOAS slant column retrieval of SO2 is performed in the UV wavelength range 315–326 nm (Rix et al., 2012). The retrieved SO2 slant columns are corrected for any systematic bias by applying a latitude and surface-elevation dependent offset correc-tion. Total vertical SO2 columns are calculated by applying an air mass factor which is depending on the viewing geometry surface conditions, and the SO2 profile shape.
15
Since at the time of the measurement the SO2plume height is unknown, the total ver-tical column is calculated for three scenarios representing the passive degassing of volcanoes and anthropogenic pollution (plume height: 2.5 km); passive degassing of high altitude volcanoes and weak eruptions (6 km); and explosive volcanic eruptions (15 km). Furthermore, in order to detect volcanic eruptions, pixels with elevated SO2
20
columns are automatically flagged when they fulfill certain threshold criteria (Brenot et al., 2014). This is especially important for the assimilation of the GOME-2 SO2 columns in forecast models, such as in the MACC-II system. The main users of the GOME-2 SO2product are the volcanic hazard and air quality communities. The GOME-2 SO2product is used within the Support to Aviation Control Service (SACS) (Brenot
25
AMTD
8, 6993–7056, 2015Overview of the O3M SAF GOME-2
operational atmospheric composition
S. Hassinen et al.
Title Page
Abstract Introduction
Conclusions References
Tables Figures
◭ ◮
◭ ◮
Back Close
Full Screen / Esc
Printer-friendly Version Interactive Discussion
Discussion
P
a
per
|
Discussion
P
a
per
|
Discussion
P
a
per
|
Discussion
P
a
per
|
scale using Earth Observation data products. Furthermore, the GOME-2 SO2columns have been used within the mobile volcano fast response system Exupéy (Rix et al., 2009).
The validation of GOME-2 SO2 columns currently relies on inter-comparisons with other satellite datasets, such as SCIAMACHY/Envisat and OMI/Aura as well as
inter-5
evaluation between the two GOME-2 instruments on Metop platforms. An example of inter-comparison of GOME-2A and GOME-2B for the Copahue volcanic eruption on the 23 December 2012 is given in Fig. 11, left, showing very consistent results between the two sensors for their co-located measurements. Figure 11, right, shows an example of anthropogenic SO2comparisons, for a region in Eastern China centralized
10
over Beijing. The OMI/Aura PBL product, which assumes an SO2loading with a center of mass altitude of about 0.9 km (Krotkov et al., 2006), is compared to both GOME-2A and GOME-2B observations considering an SO2 plume height at 2.5 km. A very good correlation between between GOME-2A and B results is shown in the scatter plot (blue line) withr squared of 0.74, to be expected since the same algorithm is applied
15
to both sensors. However, the GOME-2B retrievals result in lower SO2 columns than the OMI retrievals for loadings over 0.5 DU as shown in the equivalent scatter plot (red line) even though the absolute correlation is very satisfactory at 0.80. The reason for this difference may be attributed to the different assumptions on the a-priori SO2 profile used by the two different algorithms (see Theys et al., 2013b for more details). In
20
the future, comparisons with ground-based MAXDOAS instruments at different global locations is envisaged for strong anthropogenic and volcanic SO2 cases as this type of comparison allows the dependence of the retrievals on the SO2profile shape to be taken into account.
5.1.5 Total BrO column
25
AMTD
8, 6993–7056, 2015Overview of the O3M SAF GOME-2
operational atmospheric composition
S. Hassinen et al.
Title Page
Abstract Introduction
Conclusions References
Tables Figures
◭ ◮
◭ ◮
Back Close
Full Screen / Esc
Printer-friendly Version Interactive Discussion
Discussion
P
a
per
|
Discussion
P
a
per
|
Discussion
P
a
per
|
Discussion
P
a
per
|
The retrieval of total BrO is achieved by a DOAS analysis in the wavelength region 332–359 nm (Theys et al., 2011), including five BrO absorption bands. It is followed by an equatorial offset correction (Richter et al., 2002) applied to the retrieved slant columns, in order to minimize the impact of the long-term instrumental degradation. The conversion into total BrO vertical columns is made using air mass factors
assum-5
ing representative stratospheric BrO profiles. The scientific community is using the GOME-2 total BrO product provided by the O3M SAF. The main interest is on bromine emissions in the polar boundary layer. GOME-2 measurements allow springtime BrO columns to be studied in both the Arctic and Antarctic regions (as illustrated in Fig. 12). BrO production is related to heterogeneous photochemistry due to the presence of sea
10
salt, but the mechanisms are currently not fully characterized, especially the link with meterological variables (e.g., wind) and the importance of bromine for the deposition of mercury which impacts the polar biosphere. Owing to its wide coverage, GOME-2 measurements enable long-range transport of polar tropospheric BrO (Begoin et al., 2010) to be studied, and also emissions from volcanic eruptions (Theys et al., 2009a;
15
Hörmann et al., 2013). In addition there is an interest in the study of stratospheric BrO and its long-term trend. However, strictly speaking, scientific studies of BrO from GOME-2 measurements are only possible by separating the retrieved total BrO column into its tropospheric and stratospheric components (see Sect. 6).
The validation of BrO columns relies on the comparison of the total columns to other
20
satellite datasets, such as the SCIAMACHY and GOME-2 scientific products (Theys et al., 2011) and on ground-based zenith-sky DOAS instruments from NDACC sta-tions, such as Harestua (Hendrick et al., 2007). The results for the validation of GOME-2A and B BrO total columns can be found in Theys et al. (2013a) and on the O3M SAF BIRA validation pages (http://cdop.aeronomie.be/validation/valid-results).
Exam-25
AMTD
8, 6993–7056, 2015Overview of the O3M SAF GOME-2
operational atmospheric composition
S. Hassinen et al.
Title Page
Abstract Introduction
Conclusions References
Tables Figures
◭ ◮
◭ ◮
Back Close
Full Screen / Esc
Printer-friendly Version Interactive Discussion
Discussion
P
a
per
|
Discussion
P
a
per
|
Discussion
P
a
per
|
Discussion
P
a
per
|
GOME-2A and -B total BrO columns have an accuracy better than 30 % most of the time and hence the product reaches its target accuracy.
5.1.6 Total water vapour column
Atmospheric water vapour plays a major role for both meteorological phenomena and climate via its influence on the formation of clouds and precipitation, the growth of
5
aerosols and significantly contributes to the energy balance of the Earth acting as a powerful greenhouse gas. Hence, advancing in understanding of variability and long/term changes in water vapour is vital, especially considering that atmospheric water vapour exhibits a highly variable spatial and temporal distribution. Total column water vapour (TCWV) from GOME-2 is the only data product with the following
combi-10
nation of features: global coverage over land and over sea, good sensitivity down to the surface (where most of the water vapour column resides), independent of model input (no model-dependent information in climatological data record), and retrievals insen-sitive to instrument drift. Thus, the GOME-2 water vapour product is especially valu-able for long-term series and climatological studies (Wagner et al., 2006; Lang et al.,
15
2007; Noël et al., 2008; Mieruch et al., 2010). The example of the retrieved monthly mean maps of total column water vapour in Fig. 14 shows the global distribution of TCWV in February and August 2008 retrieved by GOME-2A. The algorithm used for the retrieval of GOME-2 TCWV is based on a classical Differential Optical Absorption Spectroscopy (DOAS) performed in the wavelength interval 614.0–683.2 nm and does
20
not include explicit numerical modelling of the atmospheric radiative transfer (Wagner et al., 2006; Grossi et al., 2014). It consists of three basic steps: in the first step, the spectral DOAS fitting is carried out, taking into account absorption by O2 and O4, in addition to that of water vapour. In the second step, a correction for absorption non-linearity effects is applied because the highly fine structured H2O (and O2) absorption
25
divi-AMTD
8, 6993–7056, 2015Overview of the O3M SAF GOME-2
operational atmospheric composition
S. Hassinen et al.
Title Page
Abstract Introduction
Conclusions References
Tables Figures
◭ ◮
◭ ◮
Back Close
Full Screen / Esc
Printer-friendly Version Interactive Discussion
Discussion
P
a
per
|
Discussion
P
a
per
|
Discussion
P
a
per
|
Discussion
P
a
per
|
sion by an appropriate Air Mass Factor (AMF), which is derived from the measured O2 absorption.
To assess the quality of the GOME-2 water vapour columns, the TCWV products were compared with corresponding model data from the European Centre for Medium Range Weather Forecast (ECMWF) ERA-Interim reanalysis (Dee et al., 2011) and with
5
SSMIS satellite F16 measurements (Wentz and Meissner, 2007) during the full period January 2007–June 2014 (Grossi et al., 2014). A comparison between the GOME-2A product and the combined SSM/I+MERIS GlobVapour data set in 2007 and 2008 was also carried out. Good general agreement was reported between all three datasets with mean bias within 0.035 g cm−2, although some seasonal and regional biases have been
10
identified. Figure 15 shows a time series of globally averaged total bias in the TCWV distribution between GOME-2A and the data sets described above. Since January 2013, the bias between the most recent GOME-2B results and the ERA-Interim and SSMIS retrievals was also computed. It was found that the combined SSM/I-MERIS sample and the ERA-Interim data set are typically drier than the GOME-2 retrievals
15
(0.03 and 0.035 g cm−2, respectively), while on average GOME-2 data overestimate
the SSMIS measurements by only 0.006 g cm−2. However, the size of these biases is
seasonally dependent. Monthly average differences as large as 0.1 g cm−2 were
ob-served in the analysis against SSMIS measurements, but were not so evident in the comparison with ERA/Interim and SSM/I+ MERIS data, because of the
compensat-20
ing effect of having land and ocean retrievals. Pronounced negative biases over land areas were identified in regions with high humidity or a relatively large surface albedo (0.3–0.5).
The water vapour product has also been validated against ground-based data (Kalakoski et al., 2014). In that study, the radiosonde data were from the Integrated
25
AMTD
8, 6993–7056, 2015Overview of the O3M SAF GOME-2
operational atmospheric composition
S. Hassinen et al.
Title Page
Abstract Introduction
Conclusions References
Tables Figures
◭ ◮
◭ ◮
Back Close
Full Screen / Esc
Printer-friendly Version Interactive Discussion
Discussion
P
a
per
|
Discussion
P
a
per
|
Discussion
P
a
per
|
Discussion
P
a
per
|
the general agreement between GOME-2 and the ground-based observations is good. The median relative difference to radiosonde observations was found to be−2.7 % for
GOME-2A and−0.3 % for GOME-2B. Against GPS observations, the median relative
differences were 4.9 and 3.2 % for GOME-2A and B, respectively. For water vapour total columns below 10 kg m−2, large wet biases were observed, especially against GPS
ob-5
servations. Conversely, at values above 50 kg m−2, GOME-2 generally underestimates
both ground-based observations.
5.2 Vertical ozone profiles
The NRT and offline vertical ozone profile product (van Peet et al., 2009, 2014) uses reflectance measurements from 260 to 330 nm and iteratively finds the ozone
pro-10
file best matching the original radiance measurements using optimal estimation. The ozone profiles are given as partial ozone columns in DU in 40 logarithmically spaced layers from the surface up to 0.001 hPa. For (partially) cloudy scenes, the retrieved cloud pressure replaces the nearest pressure level. The cloud pressure is retrieved by the FRESCO algorithm from the O2A-band measurement of GOME-2 (Wang et al.,
15
2008). GOME-2 has nominal spatial resolution of 80 km×40 km, but for the shortest UV
wavelengths the integration time is 8 times longer. The initial O3M SAF ozone profile product was provided at a spatial resolution of 640 km×40 km (coarse resolution, CR)
but has since been improved to the 80 km×40 km resolution using radiance
measure-ments from a mix of integration times. As an example of the ozone profile product from
20
GOME-2B, Fig. 16 shows a vertical cross section along an orbit from north to south. The measurements end in a location over Antarctica where the Southern Hemisphere spring ozone hole is present, indicated by low ozone values in the stratosphere.
The ozone profile products are validated with ozone sonde data as well as with lidar and microwave measurements. The ozone sonde data are used in particular for the
25
AMTD
8, 6993–7056, 2015Overview of the O3M SAF GOME-2
operational atmospheric composition
S. Hassinen et al.
Title Page
Abstract Introduction
Conclusions References
Tables Figures
◭ ◮
◭ ◮
Back Close
Full Screen / Esc
Printer-friendly Version Interactive Discussion
Discussion
P
a
per
|
Discussion
P
a
per
|
Discussion
P
a
per
|
Discussion
P
a
per
|
(Southern Hemisphere ADditional OZonesondes) network, NDACC (Network for the Detection of Atmospheric Composition Change) and the NILU’s Atmospheric Database for Interactive Retrieval (NADIR) at Norsk Institutt for Luftforskning (NILU) (http://www. nilu.no/nadir/). The NDACC network also provides the data of 4 lidar and 5 microwave stations. These are the only NDACC stations which deliver ozone profile data regularly
5
and with comparatively small delay in time. A comprehensive description of the ground based validation methods and results for the upper stratosphere will soon be published elsewhere.
The validation and quality monitoring is done by trending of monthly mean values and by direct comparison of satellite and ground-based data. The regular validation
10
uses ground based ozone profile measurements and considers the dependence of the deviations between satellite and ground based profiles on total ozone, scan angle, solar zenith angle, cloud fraction and distance in space and time. All comparisons are performed for the high and coarse resolution satellite profiles, respectively. The complete set of results is regularly available at the O3M SAF validation internet site.
15
Overall target values are met in the troposphere (30 %) and the lower stratosphere (15 %), not taking into account the UTLS zone, which shows more elevated relative dif-ferences, which cannot be assigned to the troposphere or to the stratosphere. However, GOME-2 shows a clear underestimation of ozone concentrations above about 30 km (Fig. 17). The difference to ground based data increases with altitude, amounting up to
20
about 25 % at 55 km for GOME-2B and up to about 55 % for GOME-2A, depending to some degree on ground based station and instrument. Furthermore, a satellite to satel-lite comparison with Global Ozone Monitoring by Occultation of Stars (GOMOS), Opti-cal Spectrograph and Infrared Imager System (OSIRIS) and Microwave Limb Sounder (MLS) confirms these conclusions (Määttä et al., 2015).
25
AMTD
8, 6993–7056, 2015Overview of the O3M SAF GOME-2
operational atmospheric composition
S. Hassinen et al.
Title Page
Abstract Introduction
Conclusions References
Tables Figures
◭ ◮
◭ ◮
Back Close
Full Screen / Esc
Printer-friendly Version Interactive Discussion
Discussion
P
a
per
|
Discussion
P
a
per
|
Discussion
P
a
per
|
Discussion
P
a
per
|
GOME-2A could be identified. For the coarse resolution profiles, this trend can be as large as 75 % per decade in the upper stratosphere above 30 km. GOME-2B data (red lines in Fig. 18) don’t show this effect yet. Thus, the implementation of the degradation correction is an important part of the algorithm development in future.
5.3 Aerosol products
5
The Absorbing Aerosol Index (AAI) product is derived from the reflectances measured by GOME-2 at 340 and 380 nm (Tilstra et al., 2010). The AAI may be used to detect absorbing aerosols over both land and sea surfaces, even in the presence of clouds. The AAI retrieval algorithm compares the measured reflectances with simulated clear-sky reflectances and calculates a “residue” from these which represents the difference
10
between measurement and (clear-sky) simulation and takes the form of a single index. In the algorithm, the surface albedo is assumed to be constant over the spectral range of the two selected wavelengths, and when the total ozone column is taken into account in the simulations, deviations from the Rayleigh scattering atmosphere are caused purely by clouds and/or aerosols. Negative values for the AAI are caused by
15
the presence of clouds and/or scattering aerosol in the scene. However, a positive value for the AAI can only be explained by the presence of absorbing aerosols. This makes the AAI ideally suited for aerosol masking and the detection of smoke from forest fires or volcanic eruptions. An example of the detection of a volcanic plume is shown in Fig. 19, where the ash plume originating from the Puyehue volcano can be
20
seen to travel from its source eastward over the south Atlantic Ocean. This event has been analyzed in Wang et al. (2012).
For the validation of the GOME-2 AAI product we rely on comparisons with AAI products derived from other satellite instruments, such as GOME-1, SCIAMACHY and OMI. The validation results show that the GOME-2 AAI has reached the target accuracy
25
AMTD
8, 6993–7056, 2015Overview of the O3M SAF GOME-2
operational atmospheric composition
S. Hassinen et al.
Title Page
Abstract Introduction
Conclusions References
Tables Figures
◭ ◮
◭ ◮
Back Close
Full Screen / Esc
Printer-friendly Version Interactive Discussion
Discussion
P
a
per
|
Discussion
P
a
per
|
Discussion
P
a
per
|
Discussion
P
a
per
|
5.4 Lambertian-equivalent reflectivity surface albedo database
The Lambertian-equivalent reflectivity (LER) of the Earth’s surface is based on re-flectance measurements taken by GOME-2 on the Metop-A satellite. It is the improved follow-up of earlier surface LER databases based on GOME-1 (on the ERS-2 satellite) and OMI (on the Aura satellite). The surface LER is an essential input parameter for
5
the retrieval of many trace gases, clouds properties, and aerosols.
The GOME-2 surface LER is retrieved from the main science channels for 15 pre-defined one-nm wide wavelength bands ranging from the UV to the near-infrared. Ad-ditionally, we provide a surface LER product based on the PMD (Polarization Mea-surement Device) meaMea-surements. The definition of these PMD bands is fixed but the
10
advantage is the much smaller footprint size (10 km×40 km instead of 80 km×40 km)
which results in better statistics. The surface LER spectra are provided for each month of the year in a grid of 1◦
×1◦(MSC-LER) or 0.5◦×0.5◦(PMD-LER).
The retrieval algorithm follows an approach in which the reflectance measurements from the entire mission are transformed for each of the months into scene LERs. The
15
scene LERs are distributed into the grid cells of the Earth grid and their histograms are analyzed to find the representative (cloud-free) scene LER, i.e., the spectral surface LER. For some surfaces the mode of this distribution is taken (e.g. snow, desert), for others the minimum value is taken (e.g. ocean). Cloud contamination over the oceans caused by persistent cloud presence is corrected by looking for near-by grid cells that
20
can act as a surface LER donor. The surface LER is retrieved for land and sea surfaces, including those covered by snow and ice. A more extensive description of the algorithm and product can be found in Tilstra et al. (2014). An example of the surface LER product is presented in Fig. 20.
5.5 UV radiation products
25
AMTD
8, 6993–7056, 2015Overview of the O3M SAF GOME-2
operational atmospheric composition
S. Hassinen et al.
Title Page
Abstract Introduction
Conclusions References
Tables Figures
◭ ◮
◭ ◮
Back Close
Full Screen / Esc
Printer-friendly Version Interactive Discussion
Discussion
P
a
per
|
Discussion
P
a
per
|
Discussion
P
a
per
|
Discussion
P
a
per
|
These quantities include daily doses and maximum dose rates of integrated UVB and UVA radiation together with values obtained by different biological weighting functions, solar noon UV Index and quality control flags. Recent additions are the photolysis fre-quencies of two key reactions in the atmospheric chemistry of the troposphere: the photodissociation of ozone and nitrogen dioxide. The photolysis frequency of ozone
5
refers to the rate constantjO(1D) of the following reaction forming atomic oxygen in its exited1D state from ozone
O3+hν(λ<320 nm)→O(1D)+O2 (R1)
This is an important photodissociation route of ozone leading to production of the hy-droxyl radical, a key species in oxidation of hydrocarbons in the troposphere. Figure 21
10
shows, as an example, the daily maximumjO(1D)at ground level on 10 April 2015. The OUV products are derived from the O3M SAF total ozone column product and the visible channel reflectances of the third Advanced Very High Resolution Radiometer (AVHRR/3), therefore combining data from two different instruments aboard the Metop satellites (Kujanpää and Kalakoski, 2015). Sampling of the diurnal cloud cycle is
im-15
proved by complementing the morning orbit Metop AVHRR/3 data with corresponding afternoon orbit data from the Polar Orbiting Environmental Satellites (POES) of the National Oceanic and Atmospheric Administration (NOAA), available through the data exchange between EUMETSAT and NOAA in their Initial Joint Polar System (IJPS) pro-gramme. The validation results will be presented in a paper by Kalakoski and Kujanpää
20
(2015). The offline UV products are currently used by research institutes in Europe and Australia.
The Near Real Time UV product is a 1–5 day forecast of UV index on global scale. The NUV/CLEAR product is based on GOME-2 assimilated total ozone (ATO) from KNMI. UV index is calculated from ATO applying climatologies for surface albedo,
25
prod-AMTD
8, 6993–7056, 2015Overview of the O3M SAF GOME-2
operational atmospheric composition
S. Hassinen et al.
Title Page
Abstract Introduction
Conclusions References
Tables Figures
◭ ◮
◭ ◮
Back Close
Full Screen / Esc
Printer-friendly Version Interactive Discussion
Discussion
P
a
per
|
Discussion
P
a
per
|
Discussion
P
a
per
|
Discussion
P
a
per
|
uct modified with an algorithm using the cloud cover fraction forecast from ECMWF to reflect the actual UV index. The UV fields are calculated on the same grid size as the input ATO fields, with a sub-pixel resolution of 0.25◦
×0.25◦. The product may be highly
customized for users, with regard to geographical coverage, forecast time etc.
The NUV/CLEAR and NUV/CLOUD have been validated against ground-based
mea-5
surements of UV index. The most recent validation was performed on data from 2011 for 6 locations with a total of 2064 measurements. In Fig. 22 the distribution of the diff er-ence between measured and forecasted NUV/CLOUD product is shown. The red line is the mean and the blue line the median of the distribution. The mean absolute relative difference is 22.6 % for the whole NUV/CLOUD comparison, while the NUV/CLEAR
10
product shows a mean absolute relative difference of 8.5 %.
6 Emerging products
The existing O3M SAF GOME-2 L2 products will be reprocessed in 2015. The repro-cessed trace gas products as well as aerosol products will be available in fall 2015 whereas the reprocessed OUV products will be available in late 2015.
15
The O3M SAF project will release completely new GOME-2 products within next two years. The products will be: tropospheric ozone, tropospheric BrO, Glyoxal (CHOCHO), OClO and monthly climate products of H2O and NO2. The products are described below.
There will be two different kinds of tropospheric ozone products. The first one will be
20
a product called Tropical Tropospheric Ozone Columns (TTOCs) using a convective-cloud-differential (CCD) method (Valks et al., 2014). The retrieval is based on total ozone and cloud property data provided by the GDP 4.8 (see Sect. 3.1), and uses above-cloud and clear-sky ozone column measurements to derive a monthly mean TOC between 20◦N and 20◦S. Tropical tropospheric ozone data from GOME-2 will
pro-25