ACPD
10, 15963–16006, 2010Kola emission refinement
M. Prank et al.
Title Page
Abstract Introduction
Conclusions References
Tables Figures
◭ ◮
◭ ◮
Back Close
Full Screen / Esc
Printer-friendly Version Interactive Discussion
Discussion
P
a
per
|
Dis
cussion
P
a
per
|
Discussion
P
a
per
|
Discussio
n
P
a
per
|
Atmos. Chem. Phys. Discuss., 10, 15963–16006, 2010 www.atmos-chem-phys-discuss.net/10/15963/2010/ doi:10.5194/acpd-10-15963-2010
© Author(s) 2010. CC Attribution 3.0 License.
Atmospheric Chemistry and Physics Discussions
This discussion paper is/has been under review for the journal Atmospheric Chemistry and Physics (ACP). Please refer to the corresponding final paper in ACP if available.
A refinement of the emission data for Kola
Peninsula based on inverse dispersion
modelling
M. Prank1, M. Sofiev1, H. A. C. Denier van der Gon2, M. Kaasik3,
T. M. Ruuskanen4, and J. Kukkonen1
1
Finnish Meteorological Institute, P.O. Box 503, 00101 Helsinki, Finland
2
TNO, Princetonlaan 6, 3584 CB Utrecht, The Netherlands
3
University of Tartu, ¨Ulikooli 18, 50090 Tartu, Estonia
4
University of Helsinki, Department of Physics, P.O. Box 68, 00014 Helsinki, Finland
Received: 31 May 2010 – Accepted: 10 June 2010 – Published: 29 June 2010 Correspondence to: M. Prank ([email protected])
ACPD
10, 15963–16006, 2010Kola emission refinement
M. Prank et al.
Title Page
Abstract Introduction
Conclusions References
Tables Figures
◭ ◮
◭ ◮
Back Close
Full Screen / Esc
Printer-friendly Version Interactive Discussion
Discussion
P
a
per
|
Dis
cussion
P
a
per
|
Discussion
P
a
per
|
Discussio
n
P
a
per
|
Abstract
The study reviews the emission estimates of sulphur oxides (SOx) and primary par-ticulate matter (PM) from the major industrial sources of Kola Peninsula. Analysis of the disagreements between the existing emission inventories for the Kola region com-bined with forward and inverse ensemble dispersion modelling, analysis of observa-5
tion time-series and model-measurement comparison showed that the emission of the Nikel non-ferrous metallurgy plant was missing from the EMEP inventory, as well as from some others, being in some cases misplaced or mis-attributed to other sources of the region. A more consistent inventory of the anthropogenic emissions of SOxand PM has been compiled for the peninsula, compared with the existing estimates and 10
verified by means of dispersion modelling. In particular, the SILAM model simulations for 2003 and 2006 with the revised emission data showed much lower bias – up to 6 times for the most-affected sites – for SO2with regard to the measured concentrations of 8 Finnish and Norwegian observational stations in the region. Temporal correlation improved moderately (10–20%) but homogeneously over Lapland. The study demon-15
strates the value of a combined usage of forward and inverse ensemble modelling for source apportionment in case of limited observational data.
1 Introduction
The emission database of EMEP (Co-operative Programme for Monitoring and Evalu-ation of the Long-range Transmission of Air Pollutants in Europe, http://www.emep.int) 20
(UNECE, 2009) includes both anthropogenic and natural emissions, with yearly time step and 50 km spatial resolution. The emission inventory is based on the reports of the European countries and the estimations of the EMEP experts. The EMEP database is one of the main sources of information for atmospheric dispersion modelling in Europe and contains one of the best-verified datasets.
25
ACPD
10, 15963–16006, 2010Kola emission refinement
M. Prank et al.
Title Page
Abstract Introduction
Conclusions References
Tables Figures
◭ ◮
◭ ◮
Back Close
Full Screen / Esc
Printer-friendly Version Interactive Discussion
Discussion
P
a
per
|
Dis
cussion
P
a
per
|
Discussion
P
a
per
|
Discussio
n
P
a
per
|
Other emission inventories covering Europe, such as GEIA (http://www. geiacenter.org), CGEIC (http://www.ortech.ca/cgeic), RETRO (http://retro.enes.org), EDGAR (http://www.mnp.nl/edgar), TNO-GEMS (Visschedijk et al., 2007) and PAREST MEGAPOLI (Denier van der Gon et al., 2010), are partly independent from the EMEP database but still maintain some of its features. For example, the TNO-5
GEMS inventory distinguishes between the area and point sources and significantly rearranges the emission distributions but for most countries it keeps the EMEP-based national totals. Some other inventories, such as CGEIC, incorporate EMEP as the Eu-ropean component of the global patterns (http://www.ortech.ca/cgeic/poster.html). The EDGAR inventory is mostly independent but for some major sources it uses the same 10
activity data as the ones underlying the EMEP emissions and, consequently, has some common features with EMEP.
An emerging approach to refine emission data is the inverse atmospheric disper-sion modelling. It has become a useful tool in model-based analysis of observations and source apportionment studies (e.g. Kuparinen et al., 2007; Rannik et al., 2003; 15
Bergamaschi et al., 2005; Saarikoski et al., 2007; Sofiev et al., 2006a, Elbern et al., 1997, 1999, 2007). The method can be used for both correcting the emission rates of known sources and delineating the origins of observed concentration peaks. Source apportionment using dispersion models is a corner stone of the nuclear emergency preparedness activity (Bocquet, 2005a, b; Issartel, 2005; Issartel and Baverel, 2003; 20
Thomson et al., 2007; Loosmore et al., 2007; Chang et al., 1997 etc.).
The specific approach to the source apportionment depends on abundance and cov-erage of available observational information, modelling tools and a-priori information on the sources. If high quality frequent measurement data are available from sufficiently dense network, a full-scale data assimilation problem can be solved with the emission 25
ACPD
10, 15963–16006, 2010Kola emission refinement
M. Prank et al.
Title Page
Abstract Introduction
Conclusions References
Tables Figures
◭ ◮
◭ ◮
Back Close
Full Screen / Esc
Printer-friendly Version Interactive Discussion
Discussion
P
a
per
|
Dis
cussion
P
a
per
|
Discussion
P
a
per
|
Discussio
n
P
a
per
|
al., 2007).
When the source pattern is simple and the observational data are scarce, certain reductions of the methodology are possible or even inevitable. In an extreme case, a crude analysis can be based on trivial backward trajectories. Interpretation of such results is usually qualitative (e.g., Barletta et al., 2009; Skjøth et al., 2007), but some-5
times quantitative analysis can be undertaken (Kulmala, 2000; Sogacheva et al., 2005, 2007; Heo et al., 2009). For quantitative and comparatively accurate assessment in case of limited observational information, the so-called “footprint” computations can be used (Rannik et al., 2003; Kuparinen et al., 2007; Saarikoski et al., 2007). This ap-proach is based on solving the adjoint dispersion equation for e.g. an isolated episode 10
registered by a single measurement device. The result of the adjoint computations describes the sensitivity distribution of that particular measurement. The observed val-ues are sensitive to the emission fluxes from the area where the sensitivity is non-zero. This area is referred as the measurement footprint.
The source apportionment problem in Lapland has to be based on a limited set of 15
stations, but fortunately the region has just a few almost-point sources dominating the emission pattern. Such distribution simplifies the source location problem, but also leads to a high sensitivity of the refined emission estimates to the uncertainties of the meteorological and dispersion models. For instance, a limited deviation of the predicted wind direction from the actual one may result in the model plume missing the particular 20
station, thus jeopardizing the model-measurement comparison.
The uncertainties of the individual simulations can be reduced by constructing a modelling ensemble. This tool has proven to be useful for various tasks, including air quality analysis and forecasting (http://gems.ecmwf.int; http://www.gmes-atmosphere. eu; Sofiev et al., 1996; http://www.gse-promote.org; Delle Monache and Stull, 2003; 25
Mallet and Sportisse, 2006; Pagowski and Grell, 2006) and also emergency modelling with point-type sources (Galmarini et al., 2004a, b; Potempski et al., 2008), i.e. for the emission distributions similar to the current study. It has been shown that even a simple arithmetical average, or the median as its robust analogy, of the individual ensemble
ACPD
10, 15963–16006, 2010Kola emission refinement
M. Prank et al.
Title Page
Abstract Introduction
Conclusions References
Tables Figures
◭ ◮
◭ ◮
Back Close
Full Screen / Esc
Printer-friendly Version Interactive Discussion
Discussion
P
a
per
|
Dis
cussion
P
a
per
|
Discussion
P
a
per
|
Discussio
n
P
a
per
|
members (air-quality models or specific simulations) usually shows better scores in the model-measurement comparisons than any single participating model (Galmarini et al., 2004c; Riccio et al., 2007; Potempski et al., 2008). The spread between the individual models then indicates the predictability of the episode, its stochastic features, and the potential range of the uncertainties in the results of the simulations. More sophisticated 5
approaches are under construction, aiming at the optimal selection and combination of the ensemble members and at softening or lifting some of the underlying assumptions concerning the relation between the ensemble and the actual probability distribution (Galmarini et al., 2004c; Mallet and Sportisse, 2006; Riccio et al., 2007; Delle Monache et al., 2006; Potempski and Galmarini 2010).
10
The goal of the current study is to refine the estimates of sulphur oxides (SO2 and SO24−) and aerosol particulate matter (PM) pollution in Northern Lapland caused by the industrial sources of Kola Peninsula. The study includes the following steps: (i) the analysis of the emission patterns of Kola Peninsula in the existing emission inventories, (ii) the refinement of the emission data taking the EMEP inventory as a starting point, 15
(iii) the verification of the proposed adjustments using ensemble forward and adjoint dispersion simulations with the SILAM modelling system, and (iv) the evaluation of their impact on the predicted air pollution of the region.
2 Analyses and refinement of the emission distribution of Kola Peninsula
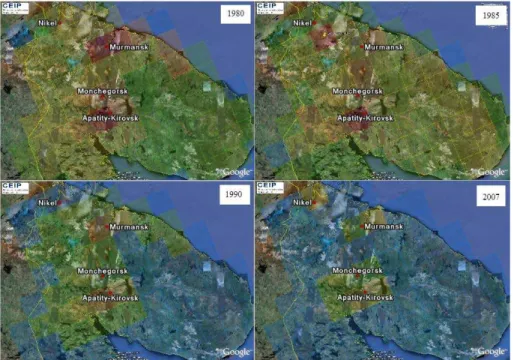
The industrial pattern of Kola Peninsula is heavily dominated by three major centres of 20
activity (Fig. 1): the Nikel (69◦20′N, 30◦04′E) and Monchegorsk (67◦55′N, 32◦57′E) non-ferrous metallurgy plants and mines, and the city of Murmansk (68◦57′N, 33◦06′E) with the nearby harbour. There is very limited anthropogenic activity outside these centres.
The SOxemissions from Nikel and Monchegorsk are by far the largest in the region, 25
ACPD
10, 15963–16006, 2010Kola emission refinement
M. Prank et al.
Title Page
Abstract Introduction
Conclusions References
Tables Figures
◭ ◮
◭ ◮
Back Close
Full Screen / Esc
Printer-friendly Version Interactive Discussion
Discussion
P
a
per
|
Dis
cussion
P
a
per
|
Discussion
P
a
per
|
Discussio
n
P
a
per
|
to Nikel, which has high SOx but low NOx fraction (Ruuskanen et al., 2003; Virkkula et al., 2003). The PM emissions from these three sources are comparable but uncertain-ties are large, also due to relatively high contribution of other sources.
The natural SOx in Lapland originate from marine DMS production, which forms a generally low background level. The natural NOx emissions around Lapland are very 5
small and their background concentration is caused by long range transport of PANs from Europe. The PM non-industrial contributions are disperse and originate from very different sources: road dust, sea salt, production of secondary aerosols, etc.
Summarising, the best-articulated tracer for the industrial emission distribution in Lapland and Kola region is SO2. Uncertainties in the Nikel NOx emission seem to 10
be below the sensitivity of our methods. There was little observational information readily available on PM concentrations, apart from Varrio campaign. Therefore, below we concentrate on the SOxemission and “project” its activity-specific modifications to particulate emission.
2.1 Evaluation of EMEP SO2emission data
15
According to the EMEP rules, every five years the emission distributions must be up-dated and reported afresh to the database by the member states. For intermittent years only the national totals are reported and the patterns are interpolated linearly in time. Upon the decision of the member states, the data can be revised retrospectively.
Until the early 1990s, the EMEP standard grid resolution was 150 km. In this grid 20
the locations of Murmansk and Nikel belonged to two neighbouring grid-cells. For the year 1992 (the last available with 150 km resolution), over 250 kT yr−1of SO2emission was reported in the grid-cell covering Nikel and about 30 kT attributed to Murmansk grid-cell (Sofiev, 2000).
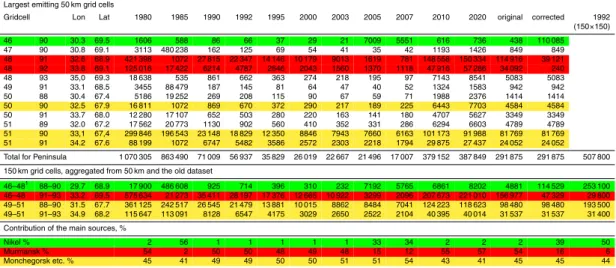
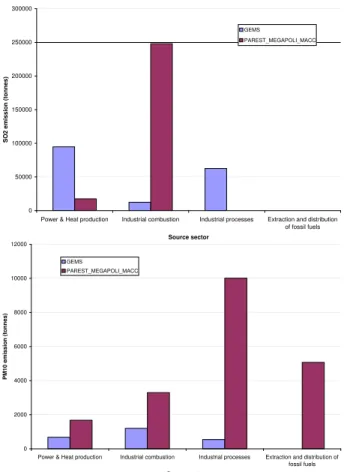
The current EMEP database, with 50×50 km resolution, reports strongly varying 25
emission amounts and patterns for different years for both SOx and PM (see Table 1 and Fig. 2). Moreover, it differs considerably from the 1992 150×150 km distribution.
ACPD
10, 15963–16006, 2010Kola emission refinement
M. Prank et al.
Title Page
Abstract Introduction
Conclusions References
Tables Figures
◭ ◮
◭ ◮
Back Close
Full Screen / Esc
Printer-friendly Version Interactive Discussion
Discussion
P
a
per
|
Dis
cussion
P
a
per
|
Discussion
P
a
per
|
Discussio
n
P
a
per
|
A strong source of SOxhas been shown for 1980 in the grid-cell (48, 91) neighbouring Murmansk and for 1985 in the grid-cell (47, 90) neighbouring the Nikel location (Fig. 2). However, the plant itself is not represented as a source. Starting from 1990, all the re-ported emissions in the area suddenly fall by more than an order of magnitude, though in 2005 somewhat higher emissions (compared to surrounding background level) show 5
up in the Nikel-containing grid cell (46, 90). The 2010 and 2020 emission projections again show a strong source near Murmansk but nothing around Nikel. Totals of these years return to the level of 1980s.
The same problems are evident for other substances, such as NOx (to a less extent and somewhat different temporal pattern) and PM. The totals for other regions of 10
Russia located within the EMEP domain do not exhibit such jumps.
Considering the above sharp changes since 1980s, one should take into account that the decline of the economy of the region in 1980s–1990s may indeed result in some decrease of the emission. However, we are not aware of any dedicated large-scale emission-reduction measures at the plant. Boyd et al. (2009) cautiously mentioned 15
∼33% reduction during 1990s with a reference to the official values and assumed no modernisation of the plant. According to Hagen et al. (2002), Berglen et al. (2008), Nikel SO2 emissions were reported around 250–300 kT yr−1 until mid-1980s and re-duced to ∼175 kT yr−1 by the beginning of 1990s. After that no significant long-term trend is reported but the data are scarce after 1993. Ahonen et al. (1997), referring to 20
Baklanov (1994) and to Committee (1995) report, suggests the SO2 emissions of the whole Kola Peninsula to fall by∼25% from 517 kT yr−1in 1992 to 380 kT yr−1in 1994.
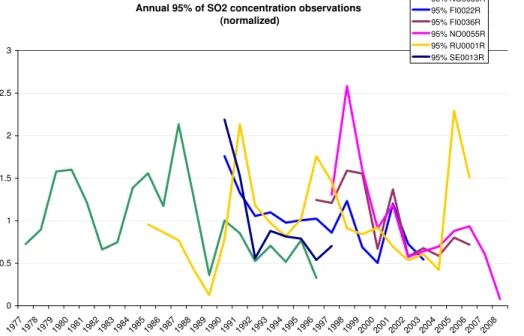
The SO2 concentration measurements in surrounding stations also do not support the changes shown by EMEP data (Hagen et al., 2002; Berglen et al., 2008; Ruuska-nen et al., 2003; Virkkula et al., 2003). The Svanvik measurement station in Norway 25
ACPD
10, 15963–16006, 2010Kola emission refinement
M. Prank et al.
Title Page
Abstract Introduction
Conclusions References
Tables Figures
◭ ◮
◭ ◮
Back Close
Full Screen / Esc
Printer-friendly Version Interactive Discussion
Discussion
P
a
per
|
Dis
cussion
P
a
per
|
Discussion
P
a
per
|
Discussio
n
P
a
per
|
20 yr. In particular, there was no dramatic decrease of the upper percentiles of the daily mean concentrations observed by any EMEP station of the region (Fig. 3).
Therefore, the sharp fall of all emissions over Kola Peninsula and large random changes in the emission distribution do not seem justified. Since the period of the fastest economical decline had ended by the mid-90s, the reported total emission of 5
1992 should not be too far from the emissions of later years, at least until 2008, when the current crisis started.
Finally, the 50 km resolving datasets obtained from EMEP before 2006 (used with some modifications by Hongisto et al., 2003; Sofiev et al., 2003; BACC, 2008; Bartnicki et al., 2002; EMEP, 2000; the EMEP assessment reports, see http://www.emep.int, 10
etc.) differ drastically from the currently available EMEP information. In the old reports dated before 2006, the total SOxemission for Kola Peninsula differed only slightly from the total of the 150 km resolution dataset for 1992. The source distribution pattern was again somewhat different, though still missing all emissions in the Nikel location. It is noteworthy that previous atmospheric dispersion simulations have shown that pollutant 15
concentrations in Lapland are usually underestimated with respect to measurements at the monitoring stations in Finland, Sweden and Norway, unless extra information is included (Hongisto et al., 2003; Bartnicki et al., 2004, 2006; Zlatev et al., 2001; Sofiev et al., 1994; Sofiev, 2000).
2.2 Comparison of the emission inventories
20
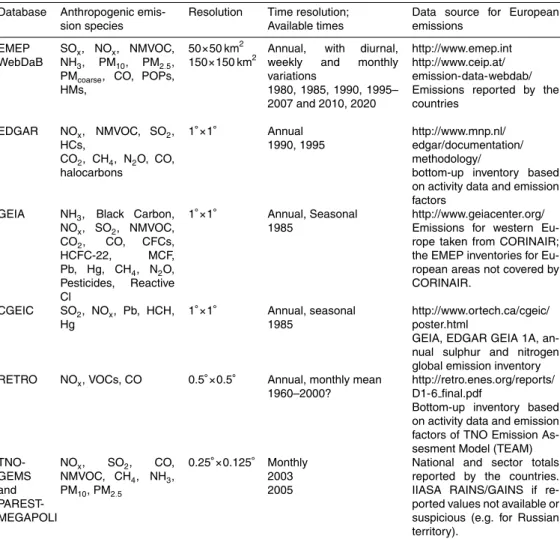
There are numerous inventories of anthropogenic emission available, covering various regions and time periods with different spatial and temporal resolutions and containing different sets of pollutant species (Table 2). For Europe, the most extensive databases, with the largest number of pollutants and the highest spatial and temporal resolutions seem to be EMEP, TNO- GEMS and PAREST MEGAPOLI, and RETRO. The global 25
databases, such as GEIA, EDGAR and CGEIC usually have low (1×1 degree) reso-lution, which is insufficient for regional model applications. However, they can still be considered for comparison when it comes to regional totals.
ACPD
10, 15963–16006, 2010Kola emission refinement
M. Prank et al.
Title Page
Abstract Introduction
Conclusions References
Tables Figures
◭ ◮
◭ ◮
Back Close
Full Screen / Esc
Printer-friendly Version Interactive Discussion
Discussion
P
a
per
|
Dis
cussion
P
a
per
|
Discussion
P
a
per
|
Discussio
n
P
a
per
|
In the TNO-GEMS inventory for 2003, the initial EMEP emission distributions have been significantly rearranged but the national totals for most countries are based on values reported to EMEP. Independent bottom-up assessment from activity data and emission factors were used only if the reported data were missing or suspected to be erroneous. In particular, new emissions were generated for Russian Federation, 5
including Kola Peninsula (Visschedijk et al., 2007). The total SO2 emission of the region is assessed to be around 140 kT of SO2 per year, which is of the same order of magnitude, though lower than the regional total of EMEP 1992 with 150 km grid resolution (Table 1). The emission distribution for SO2 in the TNO-GEMS inventory differs considerably from that of EMEP and explicitly shows Nikel emission. However, 10
it attributes about 80% of the emissions of the peninsula to the Monchegorsk area and only about 15% (22 kT of SO2 per year) to the Nikel area, which is doubtful. For instance, Boyd et al. (2009) mentioned 300 kT (with a reference to Zientek et al., 1994) as a total-Kola industrial SO2emission with∼70% attributed to the Nikel plant area.
The step from TNO- GEMS to PAREST-MEGAPOLI (Denier van der Gon et al., 2010) 15
included a complete overhaul of the European point source database including removal of the closed installations and expansion with all new point sources accessible through source-sector specific databases or statistics. There were two major reasons for this. Firstly, it improved the completeness of the list of European point sources. Secondly, for Russia the assessment relied on the estimates of the national sector total emis-20
sions by the IIASA RAINS/GAINS model (http://gains.iiasa.ac.at) which was adjusted significantly after releasing the TNO-GEMS database. The reconsideration of the point sources and Russian emission totals resulted in almost doubling the total SO2emission of the point sources in Kola Peninsula: from 170 to 266 kT of SO2 per year (Table 5). However, the emission distribution still attributes only 19% of it (52.5 kT) to the Nikel 25
plant.
ACPD
10, 15963–16006, 2010Kola emission refinement
M. Prank et al.
Title Page
Abstract Introduction
Conclusions References
Tables Figures
◭ ◮
◭ ◮
Back Close
Full Screen / Esc
Printer-friendly Version Interactive Discussion
Discussion
P
a
per
|
Dis
cussion
P
a
per
|
Discussion
P
a
per
|
Discussio
n
P
a
per
|
concerning, in particular, the spatial distribution.
The EDGAR emission data are available only for years 1990 and 1995. The total levels are comparable with EMEP 1992 150 km resolution emissions, dropping moder-ately (by 1.7 times) between these years. However, the emission pattern still does not show any significant emissions at the Nikel location, and has an unrealistically large 5
source in the Murmansk area (Table 3).
GEIA and CGEIC emissions for Europe are based on either EMEP or EDGAR as-sessments.
Concluding the analysis, none of the considered inventories contains information which would have (i) a sufficient resolution, (ii) a correct distribution of the major 10
sources, (iii) a reasonable absolute emission level. Below we have compiled a dataset which seems to be matching these criteria better than the existing inventories.
2.3 Starting point for the emission correction
Selecting the initial dataset for modifications, we took into account that the previ-ous modelling activities (Saarikoski et al., 2007; Galperin et al., 1994a, b, Sofiev et 15
al., 1995; Galperin and Sofiev, 1998; Sofiev 2000; EMEP assessment reports from http://www.emep.int) have not shown significant over-estimation of SOx and PM con-centrations in 1990s and 2000s, when the data with absolute levels similar to those of the EMEP 150 km emissions for 1992 are used. Secondly, the EMEP datasets until mid-2000s reported∼40% reduction from these levels (e.g. EMEP, 1999, 2000), which 20
is similar to the reduction reported by Ahonen et al. (1997), Boyd et al. (2009) and Zientek et al. (1994). Therefore, we assumed that the total emission for the peninsula in 1990s and first half of 2000s is close to 300 kT of SO2. The unexplained sharp fall of the absolute level of emissions (by a factor of 15–20) in the later EMEP reports was considered to be unjustified and disregarded.
25
The datasets with the Kola emission totals close to 300 kT of SO2and 50 km reso-lution could be downloaded from the EMEP WebDab portal before 2006. They have only one evident error in the distribution: entirely missing Nikel emission. The next task
ACPD
10, 15963–16006, 2010Kola emission refinement
M. Prank et al.
Title Page
Abstract Introduction
Conclusions References
Tables Figures
◭ ◮
◭ ◮
Back Close
Full Screen / Esc
Printer-friendly Version Interactive Discussion
Discussion
P
a
per
|
Dis
cussion
P
a
per
|
Discussion
P
a
per
|
Discussio
n
P
a
per
|
of this work is, therefore, to correct this error. The emission data for year 2000, down-loaded in 2006 was chosen as the reference point for the correction (Table 1). The dataset misses the Nikel plant emissions, while an extremely strong source of SO2 (about 150 kT of SO2per year), NOx, CO and PM is placed around Murmansk. A large fraction of the emission there is reported for the SNAP sector 1, (large combustion in 5
energy and transformation industry), sector 2 (non-industrial combustion plants) and sector 3 (combustion in manufacturing industry) (SNAP=System Nomenclature of Air Pollutants, http://www.emep.int). As there are no known major sources in that area, apart from the city itself and the harbour, both reporting mainly into different SNAP sectors, such as 7 (transport) we assumed that in this reference dataset the emission 10
of the Nikel metallurgy plant was misplaced to near-Murmansk.
Since the time trends of the emission after 2000 are uncertain and probably not significant, we used the 2000 emissions for all the modelling simulations described below.
2.4 Modification of the emission distribution
15
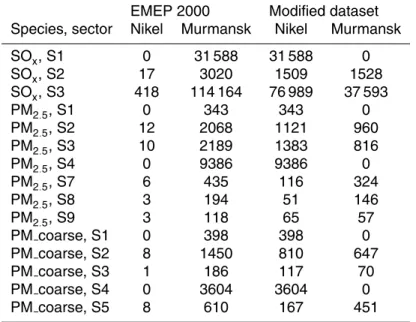
The correction of the emission database started from estimating the fraction of the emission attributed to Murmansk, that must be relocated to Nikel. The consideration can be based on individual SNAP sectors. Assuming that the emission of SNAP sector S1 (large combustion in energy and transformation industry) is dominated by Nikel, the S1 emissions in Murmansk area were moved to the Nikel plant location, leaving in the 20
original grid cells only a small fraction, corresponding to the S1 level in the neighbouring cells. Similar logic was applied to other sectors and species that contribute to the infrastructure of a large factory (Table 4).
The new estimates are probably representative for 1990s and the first half of 2000s. With the limited amount of observational data, no trend analysis seems to be feasible 25
ACPD
10, 15963–16006, 2010Kola emission refinement
M. Prank et al.
Title Page
Abstract Introduction
Conclusions References
Tables Figures
◭ ◮
◭ ◮
Back Close
Full Screen / Esc
Printer-friendly Version Interactive Discussion
Discussion
P
a
per
|
Dis
cussion
P
a
per
|
Discussion
P
a
per
|
Discussio
n
P
a
per
|
The above correction does not reposition the Nikel town emission, neither it reflects the details of the infrastructure, first of all, roads in the Nikel region. It is the plant emission only that has been repositioned. However, this is the biggest emission source in the Kola region.
Comparison of the emission fractions attributed to different sources (Table 1) shows, 5
that the rearrangement of the emission pattern can be considered quite conservative, as only∼40% of the SO2 emissions of the peninsula were moved to Nikel area com-pared to∼50% in 150 km resolving EMEP 1992 dataset and∼70% reported by Boyd et al. (2009).
3 Source apportionment via dispersion modelling
10
In this section we present the modelling-based evidence of the problems of the present emission distribution in Kola peninsula, demonstrate the improvements due to the above described changes and the need for further emission refinement.
3.1 Input data and SILAM system
3.1.1 Observational LAPBIAT-campaign at Varrio in 2003 and other datasets
15
An unequivocal indication of the missing emission source in the original EMEP inven-tory was obtained from the high-resolution atmospheric aerosol measurement cam-paign LAPBIAT carried out at Varrio, Finnish Lapland, 67◦46′N, 29◦35′E, from 28 April to 11 May 2003 (Ruuskanen et al., 2007). For the current study, we used the mea-surements of PM2.5 (particulate matter smaller than 2.5 µm) as a prominent indication 20
of industrial aerosols.
Apart from the Varrio campaign, the long-term analysis has been performed using the information from national networks of Finland and Norway. For the purpose of the study, we used seven stations located close to the Nikel site. Six of them moni-tor SO2 concentrations in air, one reports SO24− in aerosol, and three report SO24− in 25
ACPD
10, 15963–16006, 2010Kola emission refinement
M. Prank et al.
Title Page
Abstract Introduction
Conclusions References
Tables Figures
◭ ◮
◭ ◮
Back Close
Full Screen / Esc
Printer-friendly Version Interactive Discussion
Discussion
P
a
per
|
Dis
cussion
P
a
per
|
Discussion
P
a
per
|
Discussio
n
P
a
per
|
precipitation. The latter were converted to wet deposition for this comparison. None of these stations reported PM over sufficiently long periods, so the long-term analysis was performed for sulphur oxides.
3.1.2 SILAM modelling system and setup
Limited observational information, unfavourable positions of most of the stations up-5
wind of the main emission sources (regarding the prevailing synoptic wind pattern), and contradicting input emission data preclude a direct estimation of the emission in the Nikel and Murmansk areas via full-scale data assimilation and source apportion-ment techniques. Alternative analyses have therefore been used.
The pollution transport simulations and simplified source apportionment have been 10
performed with the air quality modelling system SILAM version 4, which has two – Eulerian and Lagrangian – advection-diffusion cores. The Lagrangian 3-D transport (Sofiev et al., 2006b) incorporates a high-precision iterative advection algorithm after Eerola (1990) and a Monte-Carlo random-walk representation of atmospheric diffusion. The Eulerian core, also used in the current experiment, is based on the non-diffusive 15
advection scheme of Galperin (2000) and the adaptive vertical diffusion algorithm of Sofiev (2002). For a more detailed description we refer to Sofiev et al. (2008) and http://silam.fmi.fi.
All simulations were performed with 0.1 degree horizontal and 10 min temporal res-olution. The model vertical consisted of 11 layers up to about 9 km above the surface. 20
The modelling domain covered the area of 15◦E–42◦E and 58◦N–72◦N. The boundary values were taken from SILAM European simulations. The modelling was performed for 2003 and 2006 – two arbitrarily selected years for which the observational data were available. For 2003, the meteorological data were taken from the operational forecasts of the global model of European Centre of Medium Range Weather Forecast 25
ACPD
10, 15963–16006, 2010Kola emission refinement
M. Prank et al.
Title Page
Abstract Introduction
Conclusions References
Tables Figures
◭ ◮
◭ ◮
Back Close
Full Screen / Esc
Printer-friendly Version Interactive Discussion
Discussion
P
a
per
|
Dis
cussion
P
a
per
|
Discussion
P
a
per
|
Discussio
n
P
a
per
|
campaign in 2003 were performed with both Lagrangian and Eulerian kernels, each driven by both ECMWF and HIRLAM meteo input. This 4-member modelling ensem-ble allowed more robust estimation of the dispersion patterns (compared to individual simulations) and also indicated the level of uncertainty of the results. For the long term simulations only one configuration based on the Eulerian kernel of SILAM was used to 5
limit the computational costs.
The input emission, depending on the specific run, was either the EMEP-original dataset for 2000 (downloaded before 2006) or the same dataset with the above de-scribed corrections.
The SO2/SO24− split of the SOx emission was assumed to be 80%/20% for all the 10
runs. All emission was considered in the model grid (no point sources) with prescribed SNAP-sector-dependent initial vertical distribution after Simpson et al. (2003). Conse-quently, no dynamic plume-rise computations were made.
3.2 Modelling results
3.2.1 Is Nikel plant an active source in 2000s?
15
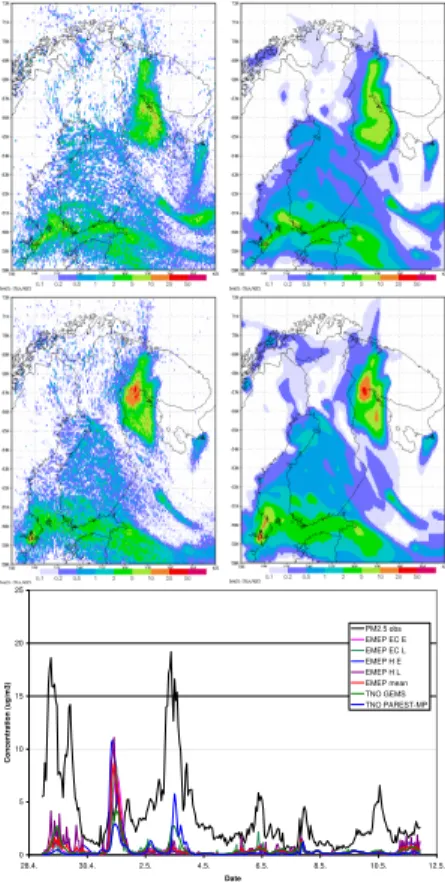
The LAPBIAT-campaign at Varrio in 2003 provided a direct confirmation that during that time Nikel was still an active source of airborne pollution. During this campaign, a few pollution episodes were observed over a generally low aerosol background of Arctic spring. The modelling attempts to reproduce some of the strongest ones (more than 10-fold from the background level), such as the peak of 2–3 May, using the orig-20
inal EMEP emission data, were unsuccessful – all 4 ensemble members showed nei-ther significant concentrations near Varrio (Fig. 5) nor any probability for it: all high-concentration plumes were predicted far from the observational site. The dispersion simulations made using the TNO-GEMS and PAREST-MP emission data reproduced the peak time better (Fig. 5, lowest panel) but showed strong underestimation of its 25
value compared to the observations.
ACPD
10, 15963–16006, 2010Kola emission refinement
M. Prank et al.
Title Page
Abstract Introduction
Conclusions References
Tables Figures
◭ ◮
◭ ◮
Back Close
Full Screen / Esc
Printer-friendly Version Interactive Discussion
Discussion
P
a
per
|
Dis
cussion
P
a
per
|
Discussion
P
a
per
|
Discussio
n
P
a
per
|
Adjoint computations performed for the time period of the peak pointed at a small area centred around the Nikel plant (Fig. 6). Therefore, it was confirmed that at least up to 2003 the plant was an active source of anthropogenic pollution (with no indication of the reduction seen up to 2006 – see Fig. 3), which is in agreement with, e.g., Boyd et al. (2009).
5
3.2.2 Revised Nikel emission data: re-analysis of the Varrio campaign
The SILAM simulations with the revised emissions produced significantly different re-sults. In all 4 cases high PM2.5concentrations reached V ¨arrio at the right time (Fig. 7). Both simulations with ECMWF meteorological input even overestimated the peak, whereas both HIRLAM-driven runs underestimated it, especially when using the La-10
grangian dynamic kernel. However, the mean of the ensemble reproduces the mea-sured peak value of PM2.5concentration with less than 10% error.
Analysis of Fig. 7 shows the value of the ensemble-type simulations when compared to the single-simulation assessments. Prediction of the position of narrow plumes orig-inating from point-type sources is always uncertain and so are the absolute concen-15
trations in the plumes. In this particular case, the variations between the model-runs exceed an order of magnitude (from less than 3 µg PM2.5m−3 up to 35 µg PM2.5m−3, depending on the model setup and the input meteorological data). The time moments when the polluted masses arrive and leave the observation site are within 1–2 h for all the simulations. As a result the ensemble both reproduces the observed peak values 20
and points out the high uncertainty and low predictability of the case.
3.2.3 New Nikel emission: long-term evaluation
The above correction of the emission distribution was used in two year-long simula-tions of the SOx distribution over the area. The goals of the computations were: (i) to evaluate the impact of the source location correction to the model-measurement com-25
ACPD
10, 15963–16006, 2010Kola emission refinement
M. Prank et al.
Title Page
Abstract Introduction
Conclusions References
Tables Figures
◭ ◮
◭ ◮
Back Close
Full Screen / Esc
Printer-friendly Version Interactive Discussion
Discussion
P
a
per
|
Dis
cussion
P
a
per
|
Discussion
P
a
per
|
Discussio
n
P
a
per
|
the new distribution is to the real emission pattern in the region, (iv) to estimate the impact of the correction onto the modelled acid deposition in the region.
In general, the comparison of predicted concentrations and depositions with the ob-servations (Table 5) shows that the new emission distribution leads to a significant improvement of the model-measurement agreement. However, the impact is not homo-5
geneous over the region and varies between species. The influence on the predicted mean values and variability quickly fades out with the distance from the plant and de-pends on the site location with respect to both Murmansk and Nikel: from the 5.5-fold increase of the for mean values (Svanvik, 9.6 km away from Nikel) down to practically no impact at Oulanka (345 km from Nikel, 334 km from Murmansk). Improvement of 10
the temporal correlation and root mean square error (RMSE) are much more moderate (up to ∼20%) but also more homogeneous around the region. These are related to more accurate positioning of the plume from the plant, which leads to reduction of the “false alerts” and catching up the “missed peaks” in the predicted time series – see examples in Fig. 8.
15
From the quantile charts (Fig. 9) we can also see a substantial improvement in both modelled concentrations and wet deposition with the revised emissions, though the new Nikel emission estimate still seems to be low, leading to some 25–30% of under-estimation. The almost linear character of the charts shows that SILAM reproduces all ranges of the concentrations with about the same accuracy, except for very low back-20
ground levels. For Svanvik (the nearest site to the plant) the slope of the chart is the same for all concentrations, while Karpbukt (the site nearest to the coast and second-nearest to the plant) shows somewhat stronger under-estimation of the background, which can possibly be attributed to the missing marine dimethyl sulphide (DMS) emis-sion.
25
Both concentrations of SO2and wet deposition of SO4show almost the same under-estimation, meaning that the near-surface values and column loads are reproduced with the same moderate underestimation. In turn, it may indicate that there are no se-vere deficiencies in modelled vertical profile of concentration, but rather the emission
ACPD
10, 15963–16006, 2010Kola emission refinement
M. Prank et al.
Title Page
Abstract Introduction
Conclusions References
Tables Figures
◭ ◮
◭ ◮
Back Close
Full Screen / Esc
Printer-friendly Version Interactive Discussion
Discussion
P
a
per
|
Dis
cussion
P
a
per
|
Discussion
P
a
per
|
Discussio
n
P
a
per
|
pattern still has some room for improvement. This similarity also supports the esti-mation of the source injection height, evaluated using the stack height of Nikel plant, because concentration at Svanvik is strongly affected by the initial injection profile.
To directly confirm that Nikel SO2emission is still underestimated in the revised data, we computed the footprint of the differences between modelled and observed concen-5
tration peaks. The corresponding adjoint SILAM run covered the year 2006. The input for the run was compiled as a deviation of the model from the hourly concentrations reported by four monitoring sites close to Nikel. The closest site – Svanvik – was not included, as the distance from this site to the plant was less than a model grid cell size, which made its observations not representative for the current grid. For the other sites, 10
a two-steps filtration procedure was applied to highlight only the significant problems in the model – measurement comparison. Firstly, the background concentrations in both modelled and observed time series were eliminated. Secondly, time periods with the model error less than 50% were excluded. The remaining time periods were analysed via the adjoint SILAM run.
15
The overlap of the yearly-mean footprints of the significant differences
(cmodel−cobserved) for the four sites (Fig. 10) shows that, apart from the areas near
the sites, the footprints have a common highlighted area around the Nikel plant (circled in the map). This overlap suggests a common reason for the model under-estimation at all sites: the under-estimated emission from the Nikel plant and/or surrounding in-20
frastructure.
4 Discussion
4.1 Reliability of the revised emission pattern
The suggested correction of the Kola emission distribution and suspected problems in the recent changes of the EMEP emission database are based on indirect con-25
ACPD
10, 15963–16006, 2010Kola emission refinement
M. Prank et al.
Title Page
Abstract Introduction
Conclusions References
Tables Figures
◭ ◮
◭ ◮
Back Close
Full Screen / Esc
Printer-friendly Version Interactive Discussion
Discussion
P
a
per
|
Dis
cussion
P
a
per
|
Discussion
P
a
per
|
Discussio
n
P
a
per
|
heuristic analysis of the available data. All these considerations are prone to uncer-tainties, which in many cases are difficult to estimate. Locations of the sources are well known and easy to correct, but the actual emission rates of each of them are not. The most objective information comes from the observational sites, but in Lapland they are all located upwind from the major sources and thus require careful processing and 5
combining with modelling for the source apportionment tasks.
The main assumption accepted as the starting point of the analysis was that the total SOx emission from Kola Peninsula, as presented in the 1992 and the original 2000 datasets of EMEP, is approximately correct. It was supported by the small mean bias of the SILAM model and other CTMs including the EMEP model with regard to 10
observations when run with this emission – also after 2000. According to J. M. Pacyna (personal communication), the uncertainty of the European SOxemission in 1990s was
∼30%. From the trend analysis of the observations (Fig. 3), it followed that there were no drastic changes in the emission during last two decades and the estimates of 1990s are valid up to 2006 within a factor of 1.5 or better. There are, however, uncertainties 15
embedded in this approach: the model internal errors, limited representativeness of the monitoring sites, and a limited number of episodes when the impact of each of the major sources could be identified. Their crude assessment is as follows. According to Sofiev et al. (2006b), the SILAM-induced uncertainty of the mean concentrations inside the individual plumes from point sources is about 50%. Following Galperin and Sofiev 20
(1994), the representativeness-related uncertainty of the observed annual mean value is at least 20%. Finally, the extra specific uncertainty due to sparse station network in the region located upwind from the sources is difficult to estimate but it is hardly lower than 10–15%. Indeed, let the number of episodes when a particular site registered the plume from the plant beNepi. The standard deviation of the mean over these episodes 25
is then proportional to 1/qNepi. With typicalNepi∼30–40 per yr, the relative uncertainty
will be∼15%. Summarising, a factor of 2 as an uncertainty of the above suggested total emission of SOxin Kola Peninsula in 2000s may be a reasonable estimate.
ACPD
10, 15963–16006, 2010Kola emission refinement
M. Prank et al.
Title Page
Abstract Introduction
Conclusions References
Tables Figures
◭ ◮
◭ ◮
Back Close
Full Screen / Esc
Printer-friendly Version Interactive Discussion
Discussion
P
a
per
|
Dis
cussion
P
a
per
|
Discussion
P
a
per
|
Discussio
n
P
a
per
|
Uncertainties caused by rearrangement of the emission pattern can be summarised as follows.
Firstly, the relocated emission amount was chosen to some extent arbitrarily, with only moderate justification based on SNAP sectors and surrounding background emis-sions. As visible from the simulation results in Fig. 8, several false SO2concentration 5
peaks remained in the time series modelled with the new input. Therefore, the emis-sion in the Murmansk area is still probably over-estimated. Conversely, the model still underestimates the SO2 concentrations at all stations to the west of the Nikel plant by a factor of 2 to 3, which only partly comes from missing background values due to missing marine DMS emissions. The peak concentrations are also underestimated, 10
which indicates that the Nikel emissions are still too low.
Secondly, in this study, the relocated Nikel emission is represented as a point source with the corresponding stack height, while some part of the emission probably comes from the surrounding area and infrastructure of the Nikel town. The lack of low-level emissions can also be a reason for underestimating the peak concentrations at nearby 15
stations.
Thirdly, the SO2/SO24− split of the SOx emission as 80%/20% might not be exactly correct, as indicated by the measurements at Karasjok site. That station is located 197 km from Nikel and 318 km from Murmansk and is the only site reporting both SO2 and SO24− concentrations. There, the observed ratio is about 50/50, which, assuming 20
the mean SO2→SO24− conversion rate of 4–5% h−1 and travel time as 5–7 h suggests the actual ratio at the source place about 70–30%. Due to different removal intensities of SO2and sulphates, such change might lead to∼10% of additional uncertainty of the concentration and deposition fields.
4.2 Long-term impact of the Kola source onto Northern Lapland
25
ACPD
10, 15963–16006, 2010Kola emission refinement
M. Prank et al.
Title Page
Abstract Introduction
Conclusions References
Tables Figures
◭ ◮
◭ ◮
Back Close
Full Screen / Esc
Printer-friendly Version Interactive Discussion
Discussion
P
a
per
|
Dis
cussion
P
a
per
|
Discussion
P
a
per
|
Discussio
n
P
a
per
|
in Northern Lapland. These changes are particularly important due to the high sensi-tivity of the ecosystems in the region to acidifying deposition. Strong increase of the deposition (more than an order of magnitude) is predicted within∼20 km from the new source location, over an almost circular area. Since substantial emission is still present in the Murmansk region, the deposition in this region reduces about 5-fold only. The 5
uncertainty of such deposition redistribution is moderate. Indeed, the normalised stan-dard deviation of the deposition redistribution (Fig. 11b) is smaller than its mean value (Fig. 11a) almost everywhere and is less than a half of it over the areas with significant changes (more than a factor 1.5).
5 Conclusions
10
An analysis of the disagreements between different emission inventories, the results of the observational campaigns and regular AQ monitoring in Northern Lapland, land-use, and anthropogenic activity data, allowed detecting a mis-location of a significant part of the anthropogenic emission in Kola Peninsula, as well as problems with the regional totals currently available from EMEP. Firstly, a sudden 15–20-fold drop of the 15
emission totals of SOx and PM in Kola Peninsula in 1990s, reported by EMEP for the region after 2006, is not supported by long term observations. Secondly, the emission of the Nikel metallurgy plant is probably falsely allocated to the Murmansk city region in several available datasets.
The starting point for the modifications was the EMEP dataset for 2000 downloaded 20
from WebDab before 2006. Following this dataset, the total emission of Nikel and Murmansk area is suggested to stay fairly constant at ∼150 kT of SO2 per year or more throughout both 1990s and 2000s.
Using forward and adjoint simulations of the SILAM system the suggested emission correction has been verified against two years of regular SO2monitoring data in North-25
ern Lapland and the PM measurement campaign at Varrio in 2003. The ensemble sim-ulations of Varrio campaign period reduced the dependence on specific input dataset
ACPD
10, 15963–16006, 2010Kola emission refinement
M. Prank et al.
Title Page
Abstract Introduction
Conclusions References
Tables Figures
◭ ◮
◭ ◮
Back Close
Full Screen / Esc
Printer-friendly Version Interactive Discussion
Discussion
P
a
per
|
Dis
cussion
P
a
per
|
Discussion
P
a
per
|
Discussio
n
P
a
per
|
and the model dynamics and increased the confidence in the suggested emission re-distribution. The long-term simulations showed substantial reduction of the model bias (up to a factor of times) in the Northern Lapland and 10–20% increase of the temporal correlation coefficient compared to the measurements.
The impact of the discovered error in the database on the deposition of sulphur 5
compounds is significant (over an order of magnitude) but limited in space. It becomes insignificant when the distance from the modified sources exceeds the spatial scale of the emission redistribution, i.e., the distance between Nikel and Murmansk.
The new Nikel emission estimate still seems to be low, leading to some 25–30% of under-estimation in modelled concentrations. Further refinement of the Kola Peninsula 10
emissions with activity-based emission assessment methods could thus be recom-mended.
Acknowledgements. The research described in this paper has been partly funded by EU-GEMS (FP-6 grant SIP4-CT-2004-516099), EU-MEGAPOLI (FP/2007-2011 grant agree-ment no. 212520), ESA GSE-PROMOTE, Estonian National Targeted Financing Project
15
SF0180038s08 and grant 7005 of Estonian Science Foundation. Antoon Visschedijk is thanked for revising the point source emissions in the emission data bases. The observational data from Norwegian network were kindly provided by NILU. The Varrio measurement campaign was sup-ported by Nordic Centre of Excellence BACCI and EU-project LAPBIAT.
References
20
Ahonen, T., Aalto, P., Rannik ¨U., Kulmala, M., Nilsson, E. D., Palmroth, D., Ylitalo, H., and Hari, P.: Variations and vertical profiles of trace gas and aerosol concentrations and CO2
exchange in Eastern Lapland, Atmos. Environ., 31, 3351–3362, 1997.
BACC, The BACC Author team: Assessment of climate change for the Baltic Sea basin, in: Regional Climate Studies, Springer, Heidelberg, ISBN:978-3-540-72785-94, 86 pp., 2008.
25
ACPD
10, 15963–16006, 2010Kola emission refinement
M. Prank et al.
Title Page
Abstract Introduction
Conclusions References
Tables Figures
◭ ◮
◭ ◮
Back Close
Full Screen / Esc
Printer-friendly Version Interactive Discussion
Discussion
P
a
per
|
Dis
cussion
P
a
per
|
Discussion
P
a
per
|
Discussio
n
P
a
per
|
Barletta, B., Meinardi, S., Simpson, I. J., Atlas, E. L., Beyersdorf, A. J., Baker, A. K., Blake, N. J., Yang, M., Midyett, J. R., Novak, B. J., McKeachie, R. J., Fuelberg, H. E., Sachse, G. W., Av-ery, M. A., Campos, T., Weinheimer, A. J., Rowland, F. S., and Blake, D. R.: Characterization of volatile organic compounds (VOCs) in Asian and North American pollution plumes during INTEX-B: identification of specific Chinese air mass tracers, Atmos. Chem. Phys., 9, 5371–
5
5388, 2009,
http://www.atmos-chem-phys.net/9/5371/2009/.
Bartnicki, J., Gusev, A., Barret, K., and Simpson, D.: Atmospheric supply of nitrogen, lead, cadmium, mercury and lindane to the Baltic Sea in the period 1996–2000, Joint EMEP cetres report for HELCOM 2002, EMEP, 2002, http://www.emep.int, last access: 24 June 2010,
10
2002.
Bartnicki, J., Gusev, A., Berg, T., and Fagerli, H.: Atmospheric supply of nitrogen, lead, cad-mium, mercury and lindane to the Baltic Sea in 2002, EMEP/MSC-W technical report 3/2004, 2004.
Bartnicki, J., Gusev, A., Aas, W., and Fagerli, H.: Atmospheric supply of nitrogen, lead,
cad-15
mium, mercury and dioxines/furanes to the Baltic Sea in 2004, EMEP/MSC-W TECHNICAL REPORT 3/2006, OSLO, Sep 2006, ISSN:0332-9879, 2006.
Bergamaschi, P., Krol, M., Dentener, F., Vermeulen, A., Meinhardt, F., Graul, R., Ramonet, M., Peters, W., and Dlugokencky, E. J.: Inverse modelling of national and European CH4
emissions using the atmospheric zoom model TM5, Atmos. Chem. Phys., 5, 2431–2460,
20
doi:10.5194/acp-5-2431-2005, 2005.
Berglen, T. F., Sivertsen, B., and Arnesen, K.: Air quality monitoring in the border areas of Norway and Russia – progress report April 2007–March 2008, Statlig program for foruren-sningsoverv ˚aking, Rapport 1037/2008, TA-2445/2008, ISBN 978-82-425-2032-6, NILU, 76 pp., 2008.
25
Bocquet, M.: Reconstruction of an atmospheric tracer source using the principle of maximum entropy, I: applications, Q. J. Roy. Meteorol. Soc., 131, 2209–2223, 2005a.
Bocquet, M.: Reconstruction of an atmospheric tracer source using the principle of maximum entropy, I: theory, Q. J. Roy. Meteorol. Soc., 131, 2191–2208, 2005b.
Boyd, R., Barnes, S.-J., De Caritat, P., Chekushin, V. A., Melezhik, V. A., Reimann, C., and
30
Zientek, M. L.: Emissions from the copper-nickel industry on the Kola Peninsula and at Noril’sk, Russia, Atmos. Environ., 43, 1474–1480, 2009.
ACPD
10, 15963–16006, 2010Kola emission refinement
M. Prank et al.
Title Page
Abstract Introduction
Conclusions References
Tables Figures
◭ ◮
◭ ◮
Back Close
Full Screen / Esc
Printer-friendly Version Interactive Discussion
Discussion
P
a
per
|
Dis
cussion
P
a
per
|
Discussion
P
a
per
|
Discussio
n
P
a
per
|
Chang, M. I., Hartley, D. E., Cardelino, C., Haas-Laursen, D., and Chang, W. L.: On using inverse methods for resolving emissions with large spatial inhomogeneities, J. Geophys. Res., 102, 16023–16036, 1997.
Committee: Report of Komitet ekologii i prirodnih resursov Murmanskoi oblasti, Ministerstvo ohrani okrugaushei sredi prirodnih resursov rossiiskoi federatsii, Sostojanie I ohrana
okru-5
gaushei prirodnoi sredi Murmanskoi oblasti v 1994, 1995.
Delle Monache, L. and Stull, R. B.: An ensemble air-quality forecast over Western Europe during an ozone episode, Atmos. Environ., 37, 3469–3474, 2003.
Delle Monache, L., Hacker, J. P., Zhou, Y., Deng, X., and Stull, R. B.: Probabilistic aspects of meteorological and ozone regional ensemble forecasts, J. Geophys. Res., 111, D24307,
10
doi:10.1029/2005JD006917, 2006.
Denier van der Gon, H. A. C., Visschedijk, A., van der Brugh, H., and Dr ¨oge, R.: A high resolution European emission data base for the year 2005, A contribution to UBA-Projekt PAREST – Particle Reductions Strategies, TNO report, Utrecht, The Netherlands, in prepa-ration, 2010.
15
Eerola, K.: Experimentation with a three-dimensional trajectory model, FMI Meteorological Publication 15, 33 pp., 1990.
Elbern, H., Schmidt, H., and Ebel, A.: Lagrangian four-dimensional variational data assimilation of chemical species, J. Geophys. Res., 102, 15967–15985, 1997.
Elbern, H. and Schmidt, H.: A four dimensional variational chemistry data assimilation
20
schmeme for eulerian chemistry transport modeling, J. Geophys. Res., 104, 18583–18598, 1999.
Elbern, H., Strunk, A., Schmidt, H., and Talagrand, O.: Emission rate and chemical state estimation by 4-dimensional variational inversion, Atmos. Chem. Phys., 7, 3749–3769, doi:10.5194/acp-7-3749-2007, 2007.
25
EMEP: Transboundary acidification and eutrophicaltion in Europe, EMEP summary report CCC and MSC-W 1999, EMEP report 1/1999, 70 pp., 1999.
EMEP: Transboundary acidification and eutrophicaltion in Europe, EMEP summary report CCC and MSC-W 2000, EMEP report 1/2000, 264 pp., 2000.
Erdman, L., Galperin, M., Subbotin, S., Sofiev, M., and Afinogenova, O.: Modelling experience
30
ACPD
10, 15963–16006, 2010Kola emission refinement
M. Prank et al.
Title Page
Abstract Introduction
Conclusions References
Tables Figures
◭ ◮
◭ ◮
Back Close
Full Screen / Esc
Printer-friendly Version Interactive Discussion
Discussion
P
a
per
|
Dis
cussion
P
a
per
|
Discussion
P
a
per
|
Discussio
n
P
a
per
|
Galmarini, S., Bianconi, R., Klug, W., Mikkelsen, T., Addis, R., Andronopoulos, S., Astrup, P., Baklanov, A., Bartniki, J., Bartzis, J. C., Bellasio, R., Bompay, F., Buckley, R., Bouzom, M., Champion, H., D’Amours, R., Davakis, E., Eleveld, H., Geertsema, G. T., Glaab, H., Kol-lax, M., Ilvonen, M., Manning, A., Pechinger, U., Persson, C., Polreich, E., Potemski, S., Prodanova, M., Saltbones, J., Slaper, H., Sofev, M. A., Syrakov, D., S `urensen, J. H., Van
5
der Auwera, L., Valkama, I., and Zelazny, R.: Can the confidence in long-range atmospheric transport models be increased? The pan-European experience of ENSEMBLE, Radiat. Prot. Dosim., 109(1–2), 19–24, doi:10.1093/rpd/nch261, 2004a.
Galmarini, S., Bianconi, R., Klug, W., Mikkelsen, T., Addis, R., Andronopoulos, S., Astrup, P., Baklanov, A., Bartniki, J., Bartzis, J. C., Bellasio, R., Bompay, F., Buckley, R., Bouzom, M.,
10
Champion, H., D’Amours, R., Davakis, E., Eleveld, H., Geertsema, G. T., Glaab, H., Kol-lax, M., Ilvonen, M., Manning, A., Pechinger, U., Persson, C., Polreich, E., Potempski, S., Prodanova, M., Saltbones, J., Slaper, H., Sofiev, M. A., Syrakov, D., Sørensen, J. H., Van der Auwera, L., Valkama, I., and Zelazny, R.: Ensemble dispersion forecasting – Part I: concept, approach and indicators, Atmos. Environ., 38(28), 4607–4617, 2004b.
15
Galmarini, S., Bianconi, R., Addis, R., Andronopoulos, S., Astrup, P., Bartzis, J. C., Bella-sio, R., Buckley, R., Champion, H., Chino, M., D’Amours, R., Davakis, E., Eleveld, H., Glaab, H., Manning, A., Mikkelsen, T., Pechinger, U., Polreich, E., Prodanova, M., Slaper, H., Syrakov, D., Terada, H., and Van der Auwera, L.: Ensemble dispersion forecasting – Part II: application and evaluation, Atmos. Environ., 38, 28, 4619–4632, 2004c.
20
Galperin, M. and Sofiev, M.: Robustness of methods for comparison of measured and calcu-lated data, MSC-E Report 2/94, Moscow, Feb 1994, 25 p., 1994.
Galperin, M., Dedkova, I., Sofiev, M., and Perelmuter, Y.: The approach to integrated assess-ment modelling developed by MSC-E, MSC-E Report 1/94, Moscow, Feb 1994, 34 p., 1994. Galperin, M., and Sofiev, M.: The long-range transport of ammonia and ammonium in the
25
Northern Hemisphere, Atmos. Environ., 32(3), 373–380, 1998.
Galperin, M.: The approaches to correct computation of airborne pollution advection, in: Prob-lems of ecological Monitoring and Ecosystem Modelling, Gidrometeoizdat, Moscow, 54–68, 2000.
Hagen, L. O., Sivertsen, B., Arnesen, K.: Grenseomr ˚adene i Norge og Russland luft- og
30
nedbørkvalitet, Apr 2005–Mar 2006, NILU Rep. OR 69/2006, Norwegian Institute of Air Re-search, Lillestr ¨om, 2002.
ACPD
10, 15963–16006, 2010Kola emission refinement
M. Prank et al.
Title Page
Abstract Introduction
Conclusions References
Tables Figures
◭ ◮
◭ ◮
Back Close
Full Screen / Esc
Printer-friendly Version Interactive Discussion
Discussion
P
a
per
|
Dis
cussion
P
a
per
|
Discussion
P
a
per
|
Discussio
n
P
a
per
|
Heo, J.-B., Hopke, P. K., and Yi, S.-M.: Source apportionment of PM2.5in Seoul, Korea, Atmos.
Chem. Phys., 9, 4957–4971, doi:10.5194/acp-9-4957-2009, 2009.
Hongisto, M., Sofiev, M., and Joffre, S.: Hilatar, a limited area simulation model of acid con-taminants: II. model verification and long-tern simulation results, Atmos. Environ., 37, 1549– 1560, 2003.
5
Issartel, J.-P. and Baverel, J.: Inverse transport for the verification of the comprehensive nuclear test ban treaty, Atmos. Chem. Phys., 3, 475–486, 2003,
http://www.atmos-chem-phys.net/3/475/2003/.
Issartel, J.-P.: Emergence of a tracer source from air concentration measurements, a new strategy for linear assimilation, Atmos. Chem. Phys., 5, 249–273, 2005,
10
http://www.atmos-chem-phys.net/5/249/2005/.
Kulmala, M., Rannik, ¨U., Pirjola, L., Dal Maso, M., Karim ¨aki, J., Asmi, A., J ¨appinen, A., Karhu, V., Korhonen, H., Malvikko, S.-P., Raittila, J., Romakkaniemi, S., Suni, T., Yli-Koivisto, S., Paatero, J., Hari, P., and Vesala, T.: Characterization of atmospheric trace gas and aerosol concentrations at forest sites in Southern and Northern Finland using back
tra-15
jectories, Boreal Envir. Res., 5, 315–336, 2000.
Kuparinen, A., Markkanen, T., Riikonen, H., and Vesala, T.: Modeling air-mediated dispersal of spores, pollen and seeds in forested areas, Ecol. Model., 208, 177–188, 2000.
Loosmore, J., Nitao, J., Sugiyama, G. A., and Vogt, P. J.: Bayesian inference and Markov chain Monte Carlo sampling to reconstruct a contaminant source at continental scale, J. Appl.
20
Meteorol. Climatol., 47(10), 2600–2613, 2007.
Mallet, V. and Sportisse, B: Ensemble-based air quality forecasts: a multimodel approach ap-plied to ozone, J. Geophys. Res., 111, D18302, doi:10.1029/2005JD006675, 2006.
Pagowski, M., Grell, G. A.: Ensemble-based ozone forecasts: Skill and economic value, J. Geophys. Res., 111, D23S30, doi:10.1029/2006JD007124, 2006.
25
Potempski, S., Galmarini, S., Addis, R., Astrup, P., Bader, S., Bellasio, R., Bianconi, R., Bon-nardot, F., Buckley, R., D’Amours, R., van Dijk, A., Geertsema, G., Jones, A., Kaufmann, P., Pechinger, U., Perssonm, C., Polreich, E., Prodanova, M., Robertsonm, L., Sørensen, J., and Syrakov, D.: Multi-model ensemble analysis of the ETEX-2 experiment, Atmos. Environ., 42, 7250–7265, 2008.
30
ACPD
10, 15963–16006, 2010Kola emission refinement
M. Prank et al.
Title Page
Abstract Introduction
Conclusions References
Tables Figures
◭ ◮
◭ ◮
Back Close
Full Screen / Esc
Printer-friendly Version Interactive Discussion
Discussion
P
a
per
|
Dis
cussion
P
a
per
|
Discussion
P
a
per
|
Discussio
n
P
a
per
|
Rannik, ¨U., Markkanen, T., Raittila, J., Hari, P., and Vesala, T.: Turbulence statistics inside and over forest: influence on footprint prediction, Bound.-Lay. Meteorol., 109, 163–189, 2003. Riccio, A., Giunta, G., and Galmarini, S.: Seeking for the rational basis of the Median Model: the
optimal combination of multi-model ensemble results, Atmos. Chem. Phys., 7, 6085–6098, doi:10.5194/acp-7-6085-2007, 2007.
5
Ruuskanen, T. M., Reissell, A., Keronen, P., Aalto, P. P., Laakso, L., Gr ¨onholm, T., Hari, P., and Kulmala, M.: Atmospheric trace gas and aerosol particle concentration measurements in Eastern Lapland, Finland 1992–2001, Boreal Environ. Res., 8, 335–349, 2003.
Ruuskanen, T. M., Kaasik, M., Aalto, P. P., H ˜orrak, U., Vana, M., M ˚artensson, M., Yoon, Y. J., Keronen, P., Mordas, G., Ceburnis, D., Nilsson, E. D., O’Dowd, C., Noppel, M., Alliksaar,
10
T., Ivask, J., Sofiev, M., Prank, M., and Kulmala, M.: Concentrations and fluxes of aerosol particles during the LAPBIAT measurement campaign at V ¨arri ¨o field station, Atmos. Chem. Phys., 7, 3683–3700, doi:10.5194/acp-7-3683-2007, 2007.
Saarikoski, S., Sillanp ¨a ¨a, M., Sofiev, M., Timonen, H., Saarnio, K., Teinil ¨a, K., Karppinen, A., Kukkonen, J., and Hillamo, R.: Chemical composition of aerosols during a major biomass
15
burning episode over Northern Europe in spring 2006: experimental and modelling assess-ments. Atmos. Environ., 41, 3577–3589, 2007.
Simpson, D., Fagerli, H., Jonson, J. E., Tsyro, S., Wind, P., and Tuovinen, J.-P.: Transbound-ary acidification and eutrophication and ground level ozone in Europe: unified EMEP model description, EMEP Status Report 1/2003 Part I, EMEP/MSC-W Report, The Norwegian
Me-20
teorological Institute, Oslo, Norway, 104 pp., 2003.
Skjøth, A. C., Sommerw, J., Stachz, A., Smithz, M., and Brandt, J.: The long-range transport of birch (Betula) pollen from Poland and Germany causes significant pre-season concentrations in Denmark, Clin. Exp. Allergy, 37, 1204–1212, 2007.
Sofiev, M., Gusev, L., and Strijkina, I.: Results of MSC-East current model calibration with
25
measurement of SOx, NOx, NHx1987–93, MSC-E Report 4/94, Mar 1994, 125 pp., 1994.
Sofiev, M., Gusev, A., and Afinogenova, O.: Atmospheric transport of acid compounds in the Northern Hemisphere for 1991–1994. MSC-E Report 8/95, Moscow, June 1995, 44 pp., 1995.
Sofiev, M., Maslyaev, A., and Gusev, A.: Heavy metal model intercomparison. Methodology
30
and results for Pb in 1990, MSC-E Report 2/96, Moscow, Mar 1996, 108 pp., 1996.
Sofiev, M.: A model for the evaluation of long-term airborne pollution transport at regional and continental scales, Atmos. Environ., 34(15), 2481–2493, 2000.