BGD
12, 6929–6969, 2015Two decades of inorganic carbon
dynamics
C. Hauri et al.
Title Page
Abstract Introduction
Conclusions References
Tables Figures
◭ ◮
◭ ◮
Back Close
Full Screen / Esc
Printer-friendly Version Interactive Discussion
Discussion
P
a
per
|
Discussion
P
a
per
|
Discussion
P
a
per
|
Discussion
P
a
per
|
Biogeosciences Discuss., 12, 6929–6969, 2015 www.biogeosciences-discuss.net/12/6929/2015/ doi:10.5194/bgd-12-6929-2015
© Author(s) 2015. CC Attribution 3.0 License.
This discussion paper is/has been under review for the journal Biogeosciences (BG). Please refer to the corresponding final paper in BG if available.
Two decades of inorganic carbon
dynamics along the Western Antarctic
Peninsula
C. Hauri1,2,3, S. C. Doney4, T. Takahashi5, M. Erickson6, G. Jiang7, and H. W. Ducklow5
1
International Pacific Research Center, SOEST, University of Hawai’i, Honolulu, HI, USA
2
International Arctic Research Center, University of Alaska Fairbanks, Fairbanks, AK, USA
3
School of Fisheries and Ocean Sciences, University of Alaska Fairbanks, Fairbanks, AK, USA
4
Marine Chemistry and Geochemistry Department, Woods Hole Oceanographic Institution, Woods Hole, MA, USA
5
Lamont-Doherty Earth Observatory, Columbia University, Palisades, NY, USA
6
Antarctic Support Contractor, Arlington, VA, USA
7
School of Earth Sciences, University of Melbourne, Melbourne, VIC, Australia Received: 17 April 2015 – Accepted: 21 April 2015 – Published: 7 May 2015 Correspondence to: C. Hauri ([email protected])
BGD
12, 6929–6969, 2015Two decades of inorganic carbon
dynamics
C. Hauri et al.
Title Page
Abstract Introduction
Conclusions References
Tables Figures
◭ ◮
◭ ◮
Back Close
Full Screen / Esc
Printer-friendly Version Interactive Discussion
Discussion
P
a
per
|
Discussion
P
a
per
|
Discussion
P
a
per
|
Discussion
P
a
per
|
Abstract
We present 20 years of seawater inorganic carbon measurements collected along the western shelf and slope of the Antarctic Peninsula. Water column observations from
summertime cruises and seasonal surface underway pCO2 measurements provide
unique insights into the spatial, seasonal and interannual variability of the dynamic
sys-5
tem. The discrete measurements from depths>2000 m align well with World Ocean
Circulation Experiment observations across the time-series and underline the consis-tency of the data set. Analysis shows large spatial gradients in surface alkalinity and
dissolved inorganic carbon content, with a concomitant wide range ofΩaragfrom values
<1 up to 3.9. This spatial variability was mainly driven by increasing influence of
bio-10
logical productivity towards the southern end of the sampling grid and melt water input along the coast towards the northern end. Large inorganic carbon drawdown through
biological production in summer caused high near-shoreΩ
aragdespite glacial and
sea-ice melt water input. In support of previous studies, we observed Redfield behavior
of regional C/N nutrient utilization, while the C/P (80.5±2.5) and N/P (11.7±0.3)
15
molar ratios were significantly lower than the Redfield elemental stoichiometric values.
Seasonal predictions ofΩaragsuggest that surface waters remained mostly
supersatu-rated with regard to aragonite throughout the study. However, more than a third of the
predictions for winters between 1999 and 2013 resulted inΩ
arag<1.3. Such low levels
of Ωarag may have implications for important organisms such as pteropods. Despite
20
large interannual variability, surfacepCO2measurements indicate a statistically
signif-icant increasing trend of up to 23 µatm per decade in fall and spring and a concomitant decreasing pH, pointing towards first signs of ocean acidification in the region. The combination of ongoing ocean acidification and freshwater input may soon provoke more unfavorable conditions than what the ecosystem experiences today.
BGD
12, 6929–6969, 2015Two decades of inorganic carbon
dynamics
C. Hauri et al.
Title Page
Abstract Introduction
Conclusions References
Tables Figures
◭ ◮
◭ ◮
Back Close
Full Screen / Esc
Printer-friendly Version Interactive Discussion
Discussion
P
a
per
|
Discussion
P
a
per
|
Discussion
P
a
per
|
Discussion
P
a
per
|
1 Introduction
Antarctic continental shelves are viewed as strong anthropogenic CO2sinks and
there-fore play an important role in global biogeochemical cycles (Arrigo et al., 2008). These highly productive regions also support productive ecosystems that are exposed to rapid environmental changes (Ducklow et al., 2007, 2012). Conditions along the
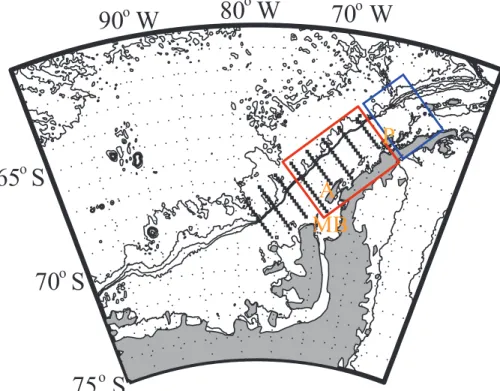
west-5
ern shelf of the Antarctic Peninsula (WAP, Fig. 1) are characterized by rapid ocean– atmosphere warming, sea-ice retreat and melting of glaciers (Ducklow et al., 2012; Stammerjohn et al., 2012; Meredith et al., 2013), impacting phytoplankton concentra-tions (Montes-Hugo et al., 2009) and higher trophic level species such as krill, fish, and Adèlie Penguins (Ducklow et al., 2007, 2012; Schofield et al., 2010). Climate and
10
oceanography trends are also mirrored in the inorganic carbon dynamics, which could feed back to global carbon cycling and/or enhance the projected fast progression of Southern Ocean acidification (McNeil and Matear, 2008; Steinacher et al., 2009; Bopp et al., 2013), thereby imposing additional environmental stressors on the ecosystem.
In the WAP, carbon biogeochemistry is controlled by an interplay of physical and
bi-15
ological mechanisms, which include photosynthesis, respiration, freshwater input, gas exchange, sea-ice cover, winds, and horizontal advection (Carrillo and Karl, 1999; Car-rillo et al., 2004; Wang et al., 2009; Montes-Hugo et al., 2010). From austral spring
through summer, sea-ice retreats from north to south and from offshore to inshore
(Smith and Stammerjohn, 2001). If not counteracted by strong winds, freshwater from
20
melting sea-ice, glaciers and snow (Meredith et al., 2013) stabilizes the water column in close proximity to the inshore and southward moving sea-ice edge. Stratification and iron availability provide favorable conditions for phytoplankton blooms (Garibotti et al., 2003, 2005; Vernet et al., 2008), resulting in a strong drawdown of dissolved inorganic
carbon (DIC) and flux of CO2from the atmosphere into the ocean (Carrillo et al., 2004;
25
Montes-Hugo et al., 2009; Wang et al., 2009). Subsequent iron depletion results in
a decreasing trend of chlorophylla (Chl a) from onshore to offshore, with interannual
BGD
12, 6929–6969, 2015Two decades of inorganic carbon
dynamics
C. Hauri et al.
Title Page
Abstract Introduction
Conclusions References
Tables Figures
◭ ◮
◭ ◮
Back Close
Full Screen / Esc
Printer-friendly Version Interactive Discussion
Discussion
P
a
per
|
Discussion
P
a
per
|
Discussion
P
a
per
|
Discussion
P
a
per
|
possibly also the timing of sampling (Garibotti, 2005; Garibotti et al., 2005). In the dark
winter months, respiration processes and entrainment of deep CO2-rich water onto the
shelf and into the upper parts of the water column increase the DIC concentration in
surface waters to supersaturated levels of CO2with respect to the atmosphere (Carrillo
et al., 2004; Wang et al., 2009; Tortell et al., 2014).
5
The inorganic carbon dynamics are further complicated by large-scale atmospheric patterns. The El Niño Southern Oscillation (ENSO) and Southern Annular Mode (SAM) drive the WAP climate and oceanography on a interannual to multidecadal timescale (Yuan and Martinson, 2001; Stammerjohn et al., 2008a). During La Niña years, storms become longer and more intense in the WAP region as a result of a strong low-pressure
10
system driven by the poleward displacement of the polar jet (Yuan, 2004). Positive SAM phases are associated with positive temperature anomalies over the Antarctic Penin-sula and decreased sea-ice extent (Kwok, 2002; Stammerjohn et al., 2008). Further-more, the SAM brings the Southern Hemisphere westerly winds closer to Antarctica,
which amplifies the typical features of La Niña. During these periods, nutrient and CO2
-15
rich Circumpolar Deep Water intrudes more frequently on to the shelf (Martinson et al., 2008). On the other hand, weaker and fewer storms and spatial and temporal exten-sion of sea-ice coverage are observed in negative phases of SAM, with associated stronger stratification of the water column and enhanced biological productivity (Saba et al., 2014). These features are further intensified when a negative SAM coincides
20
with El Niño (Stammerjohn et al., 2008b).
The WAP oceanography and ecosystem has been intensely observed as part of the PAL-LTER (Palmer Long Term Ecological Research) program (http://pal.lternet.edu/) over the past two decades (Ducklow et al., 2007, 2012). Since 1993, this multifaceted data set also contains seawater inorganic carbon measurements taken each January
25
along transects shown in Fig. 1. We complement the summertime inorganic carbon
measurements from PAL-LTER with surface underwaypCO2measurements that cover
BGD
12, 6929–6969, 2015Two decades of inorganic carbon
dynamics
C. Hauri et al.
Title Page
Abstract Introduction
Conclusions References
Tables Figures
◭ ◮
◭ ◮
Back Close
Full Screen / Esc
Printer-friendly Version Interactive Discussion
Discussion
P
a
per
|
Discussion
P
a
per
|
Discussion
P
a
per
|
Discussion
P
a
per
|
the intention to improve our understanding of the main physical and biological controls. Furthermore, such a uniquely long data set allows us to gain first insights into the impacts of ocean acidification on the region.
2 Data and methods
2.1 In situ data and calculation of carbonate system parameters 5
We used discrete measurements of seawater DIC, total alkalinity (TA) and nutrients collected during ship-based cruises as part of the PAL-LTER program (protocols at http: //pal.lternet.edu/data/), along with temperature and salinity from CTD casts. The data were gathered along the PAL-LTER sampling grid (Fig. 1), which runs 500 km along the coast and 250 km across the shelf. The along shelf transects were spaced every
10
100 km, with 20 km between the stations of each transect. The data were collected on an annual cruise each January–February from 1993 through 2012. Sample collection and analysis were performed by David Karl and Chris Carrillo for data prior to 2003, by Taro Takahashi in 2003–2004, and by Hugh Ducklow and Matthew Erickson for data in 2005 onward. No TA data were collected during 2003–2004.
15
Following the WOCE-JGOFS protocols, discrete samples of DIC and TA (300 mL)
from Niskin bottle casts were preserved with 200 µL saturated HgCl2 solution and
sealed (Dickson and Goyet, 1994). DIC was analyzed by coulometric determination of
extracted CO2(Johnson et al., 1987). TA was measured with the potentiometric titration
method. Certified Reference Materials (provided by A. G. Dickson, Scripps Institution
20
of Oceanography) were used to assure internal consistency of data with a precision of
±2 µmol kg−1 for DIC, ±5 ueq kg−1 for TA and nutrients of ±1 %. All data are publicly
available at http://pal.lternet.edu/.
Calculated pH and saturation state for aragonite (Ωarag) were determined from
DIC, TA, temperature, salinity, phosphate, silicate and pressure using the CO2SYS
25
BGD
12, 6929–6969, 2015Two decades of inorganic carbon
dynamics
C. Hauri et al.
Title Page
Abstract Introduction
Conclusions References
Tables Figures
◭ ◮
◭ ◮
Back Close
Full Screen / Esc
Printer-friendly Version Interactive Discussion
Discussion
P
a
per
|
Discussion
P
a
per
|
Discussion
P
a
per
|
Discussion
P
a
per
|
we applied the dissociation constants for carbonic acid by Dickson and Millero (1987)
(refit from Mehrbach et al., 1973). The CO2 solubility equations of Weiss (1974), and
dissociation constants for boric acid by Dickson (1990) were also used to determine
pH andΩ
arag. pH is reported on the total H
+
ion concentration scale.
The Lamont–Doherty Earth Observatory (LDEO) measured underway-surfacepCO2
5
with a precision of±0.5 %, together with salinity and temperature in various seasons
between 1999 and 2013, using a shower-type water-gas equilibrator and infrared CO2
gas analyzer (see http://www.ldeo.columbia.edu/res/pi/CO2/ for the operational and engineering details, Takahashi et al., 2013). A range of five standard gas mixtures
spanning between 100 and 700 ppm mole fraction CO2certified by the Earth System
10
Research Laboratory of the National Oceanic and Atmospheric Administration (NOAA) was used to calibrate the system every four hours.
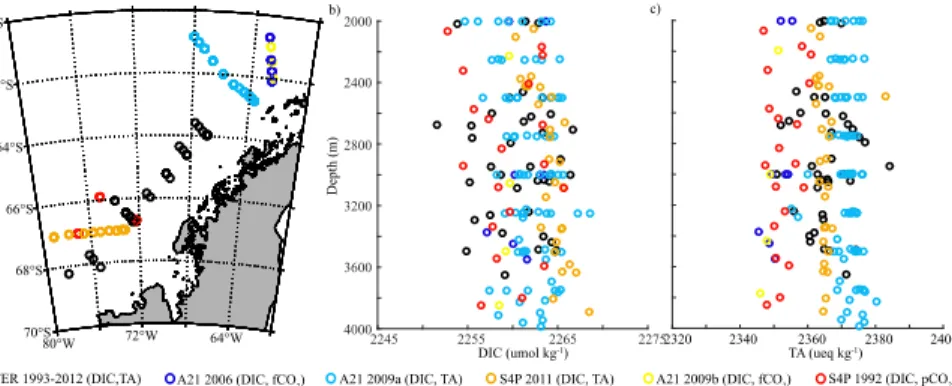
2.2 Comparison with deep-water WOCE/CLIVAR inorganic carbon system data
We checked the consistency of the LTER DIC and TA data by comparing
PAL-LTER deep-water (>2000 m), offshore TA and DIC measurements to deep-water data
15
collected during the World Ocean Circulation Experiment (WOCE) and Climate and Ocean – Variability, Predictability, and Change (CLIVAR) cruises along parts of sec-tions A21 and S4P that were overlapping with the PAL-LTER grid (data available at http: //www.nodc.noaa.gov/woce/wdiu/). DIC was measured on all cruises. When necessary,
TA was calculated from DIC and eitherfCO2orpCO2following the same calculations
20
as described in Sect. 2.1. Figure 2a shows the stations along the WAP where deep-water samples were taken during PAL-LTER and WOCE cruises. PAL-LTER DIC and TA measurements were well within the range of sampled/calculated DIC and TA from the WOCE and CLIVAR cruises (Fig. 2b and c). After removing five outliers, mean
deep-water DIC (DICmean=2260.6±3.8 µmol kg−1) and TA (TAmean=2365.4±7.0 ueq kg−1)
25
from PAL-LTER cruises corresponded well with the data measured/calculated from
BGD
12, 6929–6969, 2015Two decades of inorganic carbon
dynamics
C. Hauri et al.
Title Page
Abstract Introduction
Conclusions References
Tables Figures
◭ ◮
◭ ◮
Back Close
Full Screen / Esc
Printer-friendly Version Interactive Discussion
Discussion
P
a
per
|
Discussion
P
a
per
|
Discussion
P
a
per
|
Discussion
P
a
per
|
2.3 Comparison with underway-surfacepCO2data
We also undertook a quality check of the PAL-LTER discrete surface DIC and TA data
(depth <5 m) by comparing PAL-LTER pCO2, which was calculated using observed
DIC and TA values, to LDEOpCO2. LDEOpCO2 samples that were collected during
the PAL-LTER cruises were spatially matched with the PAL-LTER derivedpCO2values
5
by choosing the nearest latitude and longitude pair within a 1 km distance. PAL-LTER
pCO2 outliers that underestimate/overestimate pCO2 relative to the underway
obser-vations by more than 150 µatm were removed. These outliers included an
underesti-mation ofpCO2 by 188 µatm (DIC underestimation), 194 µatm (DIC underestimation),
174 µatm (TA overestimation) in 2005, 2007 and 2009 respectively, andpCO2
overes-10
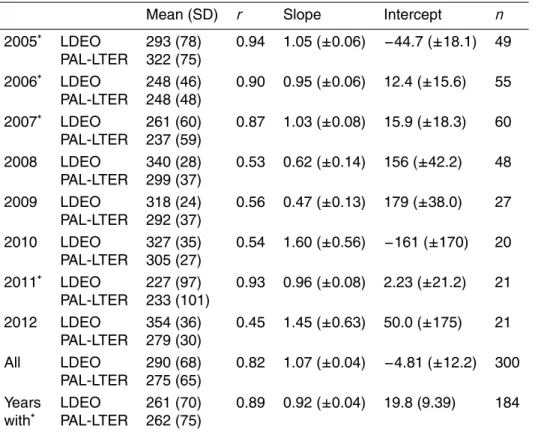
timation relative to the underway observations by as much as 308 µatm in 2005 (DIC overestimation). These outliers were excluded from further analysis. Analysis of the corrected data set with a Linear Regression Type II model suggests a correlation of
r=0.82 (Fig. A1a, Table 1). The ranges of pCO2 values measured in the summers
between years 2008 and 2010, and in year 2012 are rather small, which may also
15
introduce a large error on the intercept parameter. The datasets collected in years
2005, 2006, 2007 and 2011 represent a larger range of pCO2 values, resulting in
a slightly better correlation of (r=0.89), with an intercept and slope of −33.4±11.8
and 1.13±0.04 respectively (Fig. A1b, Table 1). Some of the observed discrepancies
may also be attributed to errors in matching the time of bottle samples with that of
20
underway pCO2 measurements. Seawater inorganic carbon chemistry is highly
vari-able along the WAP due to the influence of productivity, respiration, freshwater and
upwelling of CO2-rich subsurface water (Carrillo et al., 2004). Small matching errors
may therefore introduce small DIC and TA errors, which would translate into larger
fractional errors inpCO2due to the large Revelle Factor (∂lnpCO2/∂ln DIC) common
25
BGD
12, 6929–6969, 2015Two decades of inorganic carbon
dynamics
C. Hauri et al.
Title Page
Abstract Introduction
Conclusions References
Tables Figures
◭ ◮
◭ ◮
Back Close
Full Screen / Esc
Printer-friendly Version Interactive Discussion
Discussion
P
a
per
|
Discussion
P
a
per
|
Discussion
P
a
per
|
Discussion
P
a
per
|
2.4 Salinity based formulation of alkalinity
To take advantage of the LDEO pCO2, salinity and temperature data set that spans
all four seasons from 1999 through 2013, we developed a regional algorithm for TA
and calculated pH and Ω
arag for fall, winter, spring, and summer from the predicted
TA and measured LDEOpCO2. Since the WAP surface data showed a poor
correla-5
tion between temperature and TA (Fig. A2,r=0.50), we developed a salinity-based TA
algorithm (correlation withS:r =0.88). According to the Akaike information criterion
(Burnham and Anderson, 2002), a first order linear model represents the most accu-rate model to predict TA along the WAP. We then randomly divided the LTER surface
measurements (depth <5 m) into 10 data subsets using the 10-fold cross validation
10
method (Stone, 1974; Breiman, 1996). Using nine of the ten data sets we derived a
re-gression model, predicted the TA with the model, and calculated the model coefficients
and root mean square errors (RMSE). We repeated these steps so every data subset
was left out once. The coefficients for the final model were calculated from the mean of
the ten regression coefficients. We found the best fit in the following equation:
15
TApred(ueq kg−1)=57.01(
±0.88)×S+373.86(±35.26),
which resulted in a linear correlation coefficient of r=0.88 and a RMSE of
15.2 ueq kg−1 (Fig. A2). In combination with the pCO2 measurement precision of
3 uatm, the RMSE of TA prediction resulted in a mean error in predictedΩarag of 0.02
units (Glover et al., 2011).
20
3 Results
Here, we examine the observed spatial summer time patterns of DIC, TA, pH and
Ωarag along the WAP and explore the underlying biological and physical drivers. We
then discuss regional carbon–nutrient drawdown ratios and present our seasonalΩarag
predictions that give initial insights into the chemical environment in the more poorly
BGD
12, 6929–6969, 2015Two decades of inorganic carbon
dynamics
C. Hauri et al.
Title Page
Abstract Introduction
Conclusions References
Tables Figures
◭ ◮
◭ ◮
Back Close
Full Screen / Esc
Printer-friendly Version Interactive Discussion
Discussion
P
a
per
|
Discussion
P
a
per
|
Discussion
P
a
per
|
Discussion
P
a
per
|
sampled spring, fall and winter months. Finally, using the LTER and LDEO data sets, we investigate temporal trends over the past two decades.
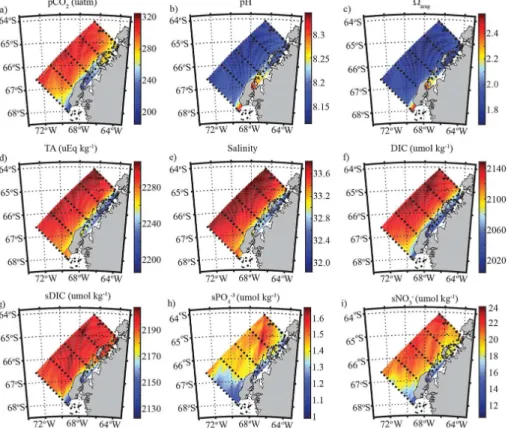
3.1 Spatial summertime patterns of the inorganic carbon system
The carbon system in the PAL-LTER region exhibited high spatial and interannual vari-ability. To gain a spatial overview of the general summertime surface features (upper
5
5 m), we linearly interpolated the observations in space and averaged across years with available DIC and TA (or nutrient) measurements. Averages are only shown for
re-gions where samples were taken in more than 5 years (Fig. 3). The resultingpCO2, pH,
Ωarag, TA, salinity, DIC, and nutrient fields exhibited clear onshore–offshore gradients.
With the exception of DIC, all parameters also followed a north–south gradient. Mean
10
summertime surfacepCO2was lowest (<200 uatm) in the southern coastal region and
was about 60 to 70 uatm lower than in the northern near-shore regions (Fig. 3a). The
highest mean summertimepCO2values were found in the northern slope region (300–
325 uatm). The opposite pattern was reflected in Ω
arag and pH, with highest values
(Ωmaxarag=2.6 and pHmax=8.3) close to the coast and south of 66.5◦S (Fig. 3b and c),
15
decreasing along the coast towards the north to pH∼8.2 andΩarag∼1.9, and reaching
the lowest levels in northern offshore waters (pHmin=8.1;Ωmin
arag=1.7). TA also
exhib-ited north–south and onshore–offshore gradients, with values as low as 2185 ueq kg−1
in the northern near-shore regions and as high as>2300 ueq kg−1 offshore. The low
TA values along the northern part of the coast coincided with the lowest salinity
val-20
ues of 31.8, suggesting dilution of TA due to freshwater input (Fig. 3d and e). Higher
TA values offshore were also reflected in increased DIC and salinity concentrations,
with temperatures between 1.3–1.5◦C. DIC also exhibited an onshore–offshore
gradi-ent with values about 80 to 100 µmol kg−1 lower in the near shore region compared
to offshore, but there was no significant north–south gradient despite the presence of
25
freshwater in the north (Fig. 3f). Salinity normalized DIC (sDIC, normalized with UCDW
BGD
12, 6929–6969, 2015Two decades of inorganic carbon
dynamics
C. Hauri et al.
Title Page
Abstract Introduction
Conclusions References
Tables Figures
◭ ◮
◭ ◮
Back Close
Full Screen / Esc
Printer-friendly Version Interactive Discussion
Discussion
P
a
per
|
Discussion
P
a
per
|
Discussion
P
a
per
|
Discussion
P
a
per
|
processes likely counteracted the expected north–south DIC gradient due to the pro-nounced freshwater influence on DIC in the north (Fig. 3g).
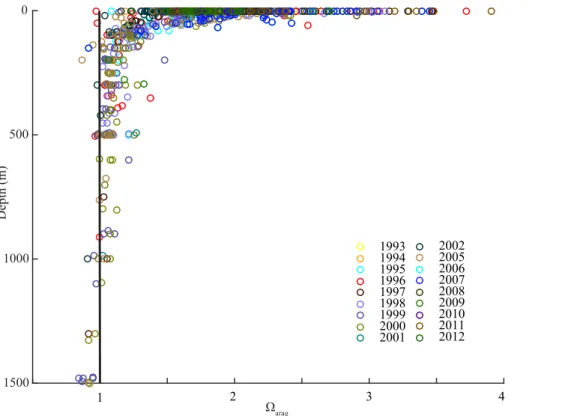
The above-presented temporal average of surfaceΩaragmasks out the large
interan-nual variability and some low levels of surfaceΩ
aragthat were close to undersaturation
(Fig. 4, min Ωarag=0.97). Aragonite undersaturation was detected at the surface in
5
1996 and on the shelf between 100 and 200 m depth in 2005 and 2007. At depths
>70 m, which is below the mixed layer depth,Ω
aragwas<1.5 in all years.
3.2 Physical and biological drivers of the inorganic carbon system
In this section we examine the physical and biological mechanisms that control the observed variability in DIC and TA. DIC can be decreased (increased) through
dilu-10
tion with freshwater (evaporation), organic matter production (remineralization), CO2
outgassing to the atmosphere (CO2 uptake) and/or precipitation of CaCO3
(dissolu-tion). While positive net community production decreases DIC, the biological effect of
organic matter production on TA depends on the source of the nitrogen, where nitrate consumption increases TA and ammonium consumption decreases TA (Goldman and
15
Brewer, 1980). Nitrate is abundant in WAP surface waters, and assuming nitrate as
the nitrogen source and a Redfield stoichiometry of 6.6 mol C (mol N)−1then TA should
increase by 1/6.6= +0.15 ueq TA per umol DIC consumed. Precipitation of biological
CaCO3material reduces both DIC and TA with the effect on TA twice as large as that
on DIC (2 ueq umol−1). TA is not affected by gas exchange but does vary as a result of
20
dilution and evaporation.
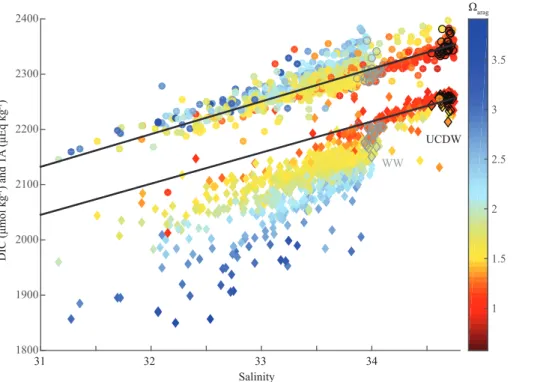
Indications of surface reductions in TA and DIC due to freshwater input are evident along the WAP, and therefore freshwater processes (sea-ice and glacial melt, precipita-tion) (Meredith et al., 2013) appear to be important factors influencing the summertime carbon dynamics along the WAP. Figure 5 shows TA (circles) and DIC (diamonds) as
25
BGD
12, 6929–6969, 2015Two decades of inorganic carbon
dynamics
C. Hauri et al.
Title Page
Abstract Introduction
Conclusions References
Tables Figures
◭ ◮
◭ ◮
Back Close
Full Screen / Esc
Printer-friendly Version Interactive Discussion
Discussion
P
a
per
|
Discussion
P
a
per
|
Discussion
P
a
per
|
Discussion
P
a
per
|
(black frames) (Martinson et al., 2008). Upper-ocean TA follows its dilution line closely,
with stronger positive deviations of about 35 ueq kg−1on average. In contrast, DIC
val-ues fall considerably below the dilution line. A DIC drawdown of about 60 umol kg−1is
visible in the winter water (grey diamonds), which increased to more than 200 umol kg−1
in the mixed layer, leading toΩarag as low as 1.5 and as high as 3.9.
5
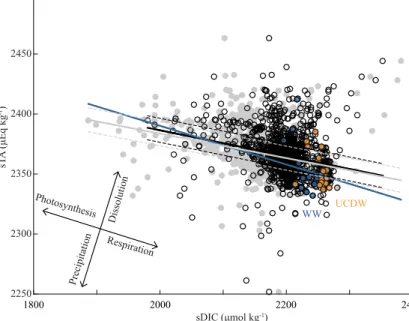
The DIC drawdown relative to the salinity mixing-dilution line is most likely due to biological production of organic matter. Figure 6 shows sDIC as a function of salinity-normalized TA (sTA) for waters shallower than UCDW (orange dots). The regression
line (solid black line, sTA =−0.11×sDIC+2601, RMSE =18.6) ±2σ (dashed lines)
for estimated measurement precision (σ=±5 ueq kg−1) is similar to the nitrate-based
10
photosynthesis line (blue line), indicating that the large decrease in DIC with the con-comitant smaller increase in TA was mainly due to net biological production of or-ganic matter. The photosynthesis line is based on winter water (WW) DIC and TA
end-members (blue dots) and a slope of −1/6.2. According to the Redfield ratios
(C/N/P=106 : 16 : 1, Redfield, 1958), photosynthetic utilization of 1 mole of NO3
in-15
creases TA by 1 eq kg−1 and decreases DIC by 106/16 (6.6). However, since the TA
titration was performed to a pH of about 3, the TA values include residual PO−43, which
leads to this slightly shallower slope of 6.2.
The intense, biologically driven DIC drawdown and resultingpCO2 undersaturation
in the mixed layer may have led to some CO2uptake from the atmosphere that tends to
20
reduce the apparent DIC deficit; thus the estimated biological drawdown from observed DIC values in Fig. 6 may be underestimated and needs to be corrected for air–sea
CO2 gas exchange from the period of biological drawdown to the sampling time. To
account for DIC concentration changes due to gas exchange with the atmosphere, we assumed a constant atmospheric concentration of 390 uatm between 1993 and
25
2012, and a gas transfer rate (k) of 5 umol CO2m−2uatm−1month−1, which is the mean
rate over the global oceans based on14C (Sweeney et al., 2007). The change in DIC
(umol kg−1month−1) due to gas transfer into the mixed layer (ML) ofd meters depth is:
∆DIC=k·∆t·∆pCO
BGD
12, 6929–6969, 2015Two decades of inorganic carbon
dynamics
C. Hauri et al.
Title Page
Abstract Introduction
Conclusions References
Tables Figures
◭ ◮
◭ ◮
Back Close
Full Screen / Esc
Printer-friendly Version Interactive Discussion
Discussion
P
a
per
|
Discussion
P
a
per
|
Discussion
P
a
per
|
Discussion
P
a
per
|
∆pCO2(pCOatm
2 −pCO
ML
2 ) was between−143 and 312 uatm, aspCO
ML
2 ranged from
533 to 78 uatm, indicating that there was potential for both oceanic CO2 uptake
and outgassing. Assuming that d =50 m (Ducklow et al., 2013), we estimate that
the monthly ∆DIC due to air-to-sea CO2 gas exchange was in the range of −14 to
31 umol kg−1month−1. Since the first large phytoplankton blooms generally occur after
5
the sea-ice retreats in November (∆t∼3 months), we assume that by the time of
sam-pling at the end of January,∆DIC would fall in the range−43 to 94 umol kg−1. The DIC
corrected for gas exchange is illustrated as grey dots in Fig. 6. While applying the gas exchange correction flattens the regression line (grey line) somewhat, the photosyn-thesis line (blue) still remains within the estimated error bounds of the gas exchange
10
corrected regression line (grey dotted lines), further emphasizing that photosynthesis is the key biological driver of the summertime carbonate system west of the Antarctic Peninsula.
3.3 Nutrient vs. carbon drawdown
Ocean carbon, nitrogen and phosphorus cycles are governed by organic matter
pro-15
duction and subsequent remineralization and are strongly correlated on a global
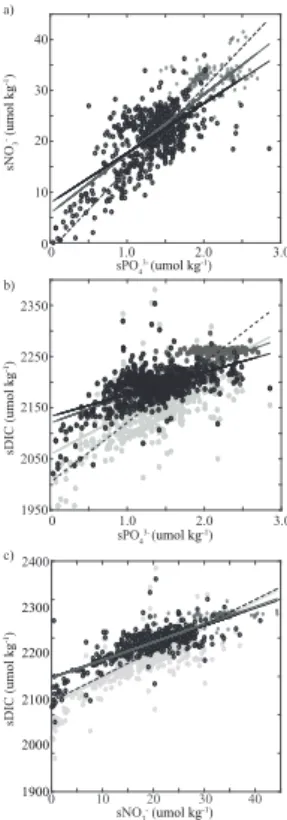
aver-age with the proportions C/N/P=106 : 16 : 1 (Redfield, 1958). Our findings suggest
that the carbon-nutrient cycles along the WAP depart from the standard Redfield values
(Fig. 7). In a few samples, the standing stock of PO34− became depleted before NO−3,
and overall the regression indicates a low N : P ratio of 9.8±0.4 in the mixed layer
20
(Fig. 7a, black) and N : P=11.7±0.3 for all data (dark grey) relative to the standard
Redfield value of 16 mol N(mol P)−1. The mole/mole C : P ratio was also considerably
smaller than the Redfield ratio (Fig. 7b). C : P yielded 43.1±2.3 in the mixed layer and
55.0±1.7 for all data. However, after applying the gas exchange correction on DIC (see
Sect. 3.2), the C : P ratio shifted closer to the Redfield Ratio and resulted in a value of
25
BGD
12, 6929–6969, 2015Two decades of inorganic carbon
dynamics
C. Hauri et al.
Title Page
Abstract Introduction
Conclusions References
Tables Figures
◭ ◮
◭ ◮
Back Close
Full Screen / Esc
Printer-friendly Version Interactive Discussion
Discussion
P
a
per
|
Discussion
P
a
per
|
Discussion
P
a
per
|
Discussion
P
a
per
|
molar ratio from 4.5±0.2 (mixed layer depth) and 4.7±0.1 (all data) to 6.7±0.2 and
resulted in a Redfield-like C : N ratio.
3.4 Seasonal variability
In this section we use the LDEOpCO2, salinity and temperature data set and a
salinity-based TA algorithm to predictΩ
arag during all seasons between 1999 and 2013 (see
5
Sect. 2.3 for method details). Note that the predictedΩaragestimates implicitly require
that the approximately linear summertime TA-salinity relationship holds for the other
seasons, a reasonable assumption if dilution and mixing substantially affect TA
pat-terns. This approach allows for insights into the carbon dynamics during winter, spring, and fall, when direct measurements of DIC and TA are either scarce or not available.
10
Summertime LDEO underway pCO2 values were, on average, lower than during
the rest of the year (Fig. 8a). The majority of summertime surface LDEOpCO2
mea-surements were distributed between 60 and 390 uatm. While less than 1 % of these
summertime values reached levels higher than the atmospheric CO2 concentration,
50 % of the water samples taken in winter were supersaturated with regard to
atmo-15
spheric CO2(>390 uatm). Spring and fallpCO2values were also generally higher than
summertime measurements and ranged from 210 to 480 uatm and 180 to 450 uatm.
Our salinity-based algorithm predicted TA with a range of 2200 to 2300 ueq kg−1 for
fall, winter and spring, with the most frequent occurrence of highest TA in winter and
spring (>40 %, Fig. 8b). Summertime TA was predicted to span a wider range, with
20
a few predictions as low as 1939 ueq kg−1. The majority of the predicted summertime
TA values ranged between 2160 and 2300 ueq kg−1, which corresponds with the range
that was measured as part of PAL-LTER.
Prediction of seasonal Ω
arag revealed that surface waters of the WAP were mostly
supersaturated with regard to aragonite throughout the years (Fig. 8c). The most
fre-25
quent occurrence of lowΩarag was in winter. More than 50 % of the predicted values
resulted inΩ
arag<1.5, of which 35 % were Ωarag<1.3, with the lowest predicted
BGD
12, 6929–6969, 2015Two decades of inorganic carbon
dynamics
C. Hauri et al.
Title Page
Abstract Introduction
Conclusions References
Tables Figures
◭ ◮
◭ ◮
Back Close
Full Screen / Esc
Printer-friendly Version Interactive Discussion
Discussion
P
a
per
|
Discussion
P
a
per
|
Discussion
P
a
per
|
Discussion
P
a
per
|
only 1 % or less of the predictions were<1.3 in summer and fall. Similar to the LTER
observations, predicted summertimeΩaragdisplayed a large range, spanning from 1.1
to 3.9, with the majority of predictions between 1.3 and 2.
3.5 Temporal trends
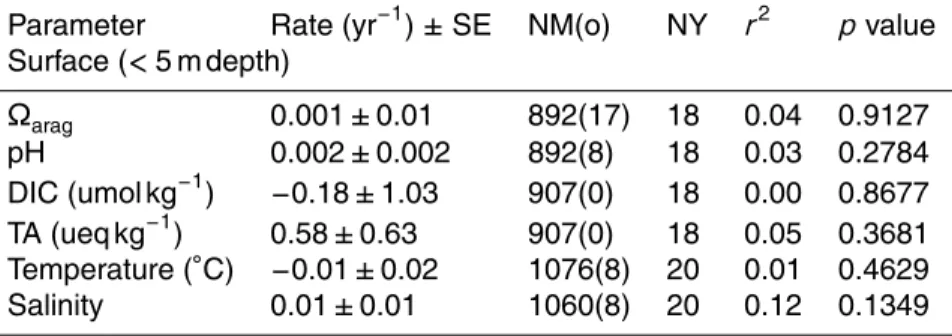
Trend analysis of the PAL-LTER data showed no statistically significant annual trends
5
(at the 95 % confidence level) in the measured carbon parameters, temperature or salinity in surface waters between 1993 and 2012 (Table 2).
As a comparison, we conducted the same trend analysis for the LDEO surface
un-derway pCO2 data set. We divided the LDEO data into a northern and central
sub-region, of which the latter corresponds with the area of the LTER-WAP grid.
Summer-10
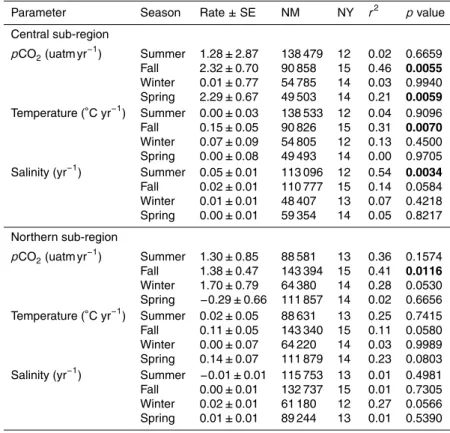
time LDEO observations of the central sub-region also do not show a significant trend
in surfacepCO2 (Table 3). However, a significant positive trend was found in fall and
spring (p <0.05), when pCO2 increased by 2.3 (±0.7) uatm yr
−1
between 1999 and 2013 in both seasons. The LDEO dataset also suggests that temperature and salin-ity significantly increased in fall and summer, respectively. In the northern sub-region,
15
which lies outside and north of the LTER-sampling grid, LDEOpCO2increased
signif-icantly by 1.4 (±0.5) uatm yr−1 in fall. The wintertime surface pCO2 showed a higher
pCO2 trend (1.7±0.8) uatm yr
−1
, but this trend was slightly outside the confidence in-terval and therefore statistically not significant.
4 Discussion 20
The 20 year-long PAL-LTER seawater inorganic carbon time-series showed a distinct
upper-ocean spatial pattern of onshore–offshore and north–south gradients and
BGD
12, 6929–6969, 2015Two decades of inorganic carbon
dynamics
C. Hauri et al.
Title Page
Abstract Introduction
Conclusions References
Tables Figures
◭ ◮
◭ ◮
Back Close
Full Screen / Esc
Printer-friendly Version Interactive Discussion
Discussion
P
a
per
|
Discussion
P
a
per
|
Discussion
P
a
per
|
Discussion
P
a
per
|
SurfaceΩ
aragwas distributed across a wide range (<1 to values>3) in
freshwater-influenced areas with salinitiesS <32 (Fig. 5). To better understand how such a wide
range ofΩaragat relatively low salinities was possible, we quantified the effect of
fresh-water and biological production. Mixing of seafresh-water with sea-ice or glacial meltfresh-water
leads to a “dilution” of CO23− ions and a decrease in Ωarag because TA and DIC in
5
glacial and sea-ice meltwater are much lower than in seawater (Anderson et al., 2000;
Yamamoto-Kawai et al., 2009). Calculations of salinity normalized Ω
arag using sDIC
and sTA showed that freshwater decreasedΩarag by up to 0.2 units along the coast.
Despite the negative effect of freshwater onΩarag, the water in the south was
neverthe-less highly supersaturated with CaCO3. The salinity normalized DIC in the near-shore
10
southern region of the PAL-LTER sampling grid was up to 177 µmol kg−1 lower than
elsewhere, suggesting that near-shore phytoplankton blooms balanced out the
nega-tive effect of freshwater on Ω
arag and even increasedΩarag by up to 2 units. In 2005,
when the above-described pattern was particularly obvious, high Chla(up to 20 ug L−1)
in the southern coastal area of the sampling grid provides further evidence that high
15
primary productivity led to the observed highΩaragdespite the presence of freshwater.
Similar results were found after the calving event of the Mertz glacier tongue in
east-ern Antarctica, where enhanced primary productivity increased theΩ
arag and thereby
counteracted the effect of dilution by meltwater input (Shadwick et al., 2013).
Our findings of onshore–offshore and latitudinal gradients of carbon parameters are
20
supported by previous results that suggest similar patterns for several physical and
bio-geochemical parameters. Summertime surface temperature, salinity and NO−3+NO−
2
are generally lower close to the coast, while Chl a, primary production, Si(OH)2 and
water column stability decrease from the coast toward the open ocean (Smith, 2001; Garibotti et al., 2003; Vernet et al., 2008). The freshwater along the coast may
origi-25
BGD
12, 6929–6969, 2015Two decades of inorganic carbon
dynamics
C. Hauri et al.
Title Page
Abstract Introduction
Conclusions References
Tables Figures
◭ ◮
◭ ◮
Back Close
Full Screen / Esc
Printer-friendly Version Interactive Discussion
Discussion
P
a
per
|
Discussion
P
a
per
|
Discussion
P
a
per
|
Discussion
P
a
per
|
control of the onshore-offshore gradient of phytoplankton variability and associated
biologically-impacted parameters. The north–south gradients possibly reflect the tim-ing of phytoplankton blooms in the north and south. As such, blooms in the north occur sooner than blooms in the south (Smith et al., 2008) – thus on average the PAL-LTER January cruise takes place after the bloom in the north, and during the blooms in the
5
south. This may also be the reason for the nutrient depletion along the coast, despite low biological productivity at the time of sampling in the north (Fig. 3h and i). How-ever, it is important to note that as a result of changes in ice cover, cloud formation and wind over the past 30 years, biological productivity has increased in the southern
part of the WAP and significantly decreased north of 63◦S (Montes-Hugo et al., 2009).
10
The observed DIC drawdown in the winter water (Figs. 5 and A3) is also supported by
previous observations of Chlamaxima in the euphotic part of the winter water, likely
due to increased iron concentrations there (Garibotti et al., 2003; Garibotti, 2005).
LowΩ
aragvalues (<1.35) observed offshore overlapped with surface waters
super-saturated with regard to atmospheric CO2, salinities>33.5, and temperatures between
15
1.3–1.5◦C. These physical properties are associated with modified UCDW, a mixture
between UCDW and Antarctic Surface Water (Smith et al., 1999) and indicate that
up-welling of DIC and TA rich water into the mixed layer may lead to lowerΩaragconditions
offshore (Carrillo et al., 2004).
The Palmer LTER data indicate N : P uptake ratios lower than the Redfield ratio of
20
16 : 1, and uptake ratios similar to our findings (14 : 1) are common for the polar region of the Southern Ocean (Weber and Deutsch, 2010; Martiny et al., 2013). Our observed
low ratio may be the result of a high abundance of diatoms with low N/P ratios in this
cold and nutrient-rich environment (Arrigo, 1999; Arrigo et al., 2002; Green and
Sam-brotto, 2006; Martiny et al., 2013). Rubin et al., (1998) observed a similar N/P ratio of
25
13.0±1.2 in the mixed layer south of the Polar Front, and an even lower N/P ratio of
11.3±0.3 was observed in the iron-spiked mixed layer during the iron fertilization
exper-iment in the Subantarctic South Pacific (Hales and Takahashi, 2012). Consistent with
BGD
12, 6929–6969, 2015Two decades of inorganic carbon
dynamics
C. Hauri et al.
Title Page
Abstract Introduction
Conclusions References
Tables Figures
◭ ◮
◭ ◮
Back Close
Full Screen / Esc
Printer-friendly Version Interactive Discussion
Discussion
P
a
per
|
Discussion
P
a
per
|
Discussion
P
a
per
|
Discussion
P
a
per
|
also smaller than the classic Redfield ratio. This indicates that the regional phosphate cycle shows non-Redfield behavior, which is in agreement with the observed C : P ratio
of 91.4±7.9 in the mixed layer south of the Polar Front (Rubin et al., 1998). For the
same region, Rubin et al. (1998) describe Redfield behavior of C/N nutrient utilization,
which corresponds with our gas exchange corrected C/N nutrient utilization ratio of
5
6.7±0.2. Recently published work suggests that C/N/P ratios exhibit a latitudinal
pat-tern, with a range of 66 : 11 : 1 to 74 : 13 : 1 at higher latitudes in the Southern Ocean (Martiny et al., 2013) and can therefore be significantly lower than what we found in this study.
TA variability was largely driven by dilution through freshwater input and mixing
10
(Fig. 5), which is well characterized by the salinity-derived TA relationship presented in Sect. 2.4. However, biological mechanisms such as photosynthesis, respiration,
CaCO3precipitation and dissolution also played an important role in controlling TA
con-centrations in the water column and at the surface (Fig. 6). Neglecting these important drivers may be responsible for the large RMSE of our predicted TA (Fig. A2) relative
15
to other studies that either had additional parameters at hand (i.e. O2 or nutrients) to
derive inorganic carbon system parameters in coastal environments (Juranek et al., 2009; Kim et al., 2010; Evans et al., 2013) or that used salinity algorithms to predict TA in open-ocean regions (Takahashi et al., 2014). Furthermore, TA varied by more than
70 ueq kg−1 at salinities >33.7, which led to an unbalanced distribution of residuals
20
(Fig. A2c). Increasing TA at higher salinities and nearly constant DIC concentrations has been observed before in Arctic and Antarctic regions (Dieckmann et al., 2008; Fransson et al., 2011; Rysgaard et al., 2012; Shadwick et al., 2014) and may be due to
formation of ikaite crystals (CaCO3.6H2O) (Suess et al., 1982) that store TA in sea-ice
and, upon melting, release the excess TA into the surface water (Rysgaard et al., 2012,
25
BGD
12, 6929–6969, 2015Two decades of inorganic carbon
dynamics
C. Hauri et al.
Title Page
Abstract Introduction
Conclusions References
Tables Figures
◭ ◮
◭ ◮
Back Close
Full Screen / Esc
Printer-friendly Version Interactive Discussion
Discussion
P
a
per
|
Discussion
P
a
per
|
Discussion
P
a
per
|
Discussion
P
a
per
|
with biological DIC drawdown, could have increased TA : DIC ratios at high salinities. Finally, the WAP region is very dynamic, with large seasonal changes that may af-fect the carbon system in ways not representable by one algorithm and may therefore require seasonally adjusted algorithms.
Despite of the above-described shortcomings in our salinity-derived TA algorithm,
5
the predictedΩarag (Figs. 4 and 8) give a useful overview of the seasonal distribution
and variability of Ω
arag. Error propagation of pCO2 measurement precision and TA
prediction accuracy suggests that the predicted error forΩaragmay be as little as 0.02
(Glover et al., 2011). The seasonal predictions ofΩarag suggest that some wintertime
Ω
aragwere<1 and more than a third were between 1.1 and 1.3 (Fig. 9). 25 and 10 % of
10
the predictions made for spring and fall also fell into that category. Short-term exposure
to low levels of Ωarag may cause severe dissolution of live pteropod shells and has
already been observed in the Scotia Sea (Bednaršek et al., 2012). Surface aragonite
undersaturation along the WAP may be a result of ocean acidification and may not have been common at preindustrial times (Hauri et al., 2015).
15
The strongest and most significant increase in surfacepCO2 was observed in the
central sub-region in fall and spring (23 µatm decade−1). This increase is slightly higher
than what was found for large areas of the global ocean and the mean atmospheric
pCO2 increase of 19 µatm per decade, which causes a pH decrease of about 0.02
per decade (Takahashi et al., 2014). Interestingly, Stammerjohn et al. (2008a, b) found
20
that sea ice extent and wind are also changing most rapidly in spring and fall, which
may enhance sea–air gas exchange and therefore facilitate positivepCO2trends.
Fur-thermore, it is likely that the strong counter effect of biological productivity successfully
masks out thepCO2 trend in summer, and decreased gas exchange due to sea ice
weakens the trend in winter. Predicted surface pH also decreased in the central
sub-25
region in fall (−0.04 decade−1,p=0.003) and spring (−0.01 decade−1,p=0.08),
BGD
12, 6929–6969, 2015Two decades of inorganic carbon
dynamics
C. Hauri et al.
Title Page
Abstract Introduction
Conclusions References
Tables Figures
◭ ◮
◭ ◮
Back Close
Full Screen / Esc
Printer-friendly Version Interactive Discussion
Discussion
P
a
per
|
Discussion
P
a
per
|
Discussion
P
a
per
|
Discussion
P
a
per
|
which may also influence the region’s inorganic carbon chemistry and could therefore be responsible for the observed trends. Additional decades of sampling may be needed in order to be able to distinguish with certainty between natural variability and secular trends (Henson et al., 2010). Furthermore, the precision of predicted pH may not be
sufficient to detect the subtle differences between natural variability and anthropogenic
5
trends.
5 Conclusions
This study gives new insights into the spatial and temporal variability of the WAP inor-ganic carbon system and its main physical and biological drivers. In particular, we found that large inorganic carbon drawdown through biological production in summer caused
10
high near-shoreΩarag, despite glacial and sea-ice melt water input. Furthermore, while
summertime inorganic carbon chemistry variables do not show any long-term trends
yet, surfacepCO2 has significantly increased in spring and fall over the last 15 years,
suggesting first signs of ocean acidification in this highly dynamic and variable system. Continuation and expansion of the inorganic carbon chemistry timeseries across
15
other seasons is necessary to monitor the progression of ocean acidification, be able to distinguish between natural variability and secular trends and to better understand
synergistic effects of ocean acidification and climate change. Due to the region’s
phys-ical complexity of circulation and forcing, and strong dynamic response to climate vari-ability, we recommend development of a highly resolved biogeochemical model to
com-20
plement our observational work. Implementation of modeling studies will improve our mechanistic understanding of how interannual variability and anthropogenic climate change impact the inorganic carbon chemistry along the WAP, which is imperative to predict the potential impact on the unique WAP ecosystem.
Author contributions. Designed research: H. W. Ducklow and T. Takahashi. Field sampling and
25
BGD
12, 6929–6969, 2015Two decades of inorganic carbon
dynamics
C. Hauri et al.
Title Page
Abstract Introduction
Conclusions References
Tables Figures
◭ ◮
◭ ◮
Back Close
Full Screen / Esc
Printer-friendly Version Interactive Discussion
Discussion
P
a
per
|
Discussion
P
a
per
|
Discussion
P
a
per
|
Discussion
P
a
per
|
interpretation: C. Hauri with help from all co-authors. Wrote the paper: C. Hauri with help from S. C. Doney, T. Takahashi, and H. W. Ducklow.
Acknowledgements. We thank past and present members of the Palmer LTER program as
well as the captains and crew of the U.S. Antarctic research vessels. We are especially grateful to Richard Iannuzzi and James Conners for their support with data management. We gladly
5
acknowledge support from the National Science Foundation Polar Programs (NSF OPP-90-11927, OPP-96-32763, OPP-02-17282, OPP-08-23101, and PLR-1440435). This is Interna-tional Pacific Research Center contribution number 1117.
References
Anderson, S. P., Drever, J. I., Frost, C. D., and Holden, P.: Chemical weathering in the
fore-10
land of a retreating glacier, Geochim. Cosmochim. Ac., 64, 1173–1189, doi:10.1016/S0016-7037(99)00358-0, 2000.
Arrigo, K. R.: Phytoplankton community structure and the drawdown of nutrients and CO2 in the Southern Ocean, Science, 283, 365–367, doi:10.1126/science.283.5400.365, 1999. Arrigo, K. R.: Taxon-specific differences in C/P and N/P drawdown for phytoplankton in the
15
Ross Sea, Antarctica, Geophys. Res. Lett., 29, 1938, doi:10.1029/2002GL015277, 2002. Arrigo, K. R., van Dijken, G., and Pabi, S.: Impact of a shrinking Arctic ice cover on marine
primary production, Geophys. Res. Lett., 35, L19603, doi:10.1029/2008GL035028, 2008. Bednaršek, N., Tarling, G. A., Bakker, D. C. E., Fielding, S., Jones, E. M., and Venables, H.
J.: Extensive dissolution of live pteropods in the Southern Ocean, Nat. Geosci., 5, 881–885,
20
doi:10.1038/ngeo1635, 2012.
Bopp, L., Resplandy, L., Orr, J. C., Doney, S. C., Dunne, J. P., Gehlen, M., Halloran, P., Heinze, C., Ilyina, T., Séférian, R., Tjiputra, J., and Vichi, M.: Multiple stressors of ocean ecosystems in the 21st century: projections with CMIP5 models, Biogeosciences, 10, 6225– 6245, doi:10.5194/bg-10-6225-2013, 2013.
25
Breiman, L.: Stacked regressions, Mach. Learn., 24, 49–64, doi:10.1007/BF00117832, 1996. Burnham, K. P. and Anderson, D. R.: Model Selection and Multimodel Inference: A Practical
Information-Theoretic Approach, Springer Verlag, New York, 488 pp., 2002.
Carrillo, C. J. and Karl, D. M.: Dissolved inorganic carbon pool dynamics in northern Gerlache Strait, Antarctica, J. Geophys. Res., 104, 15873, doi:10.1029/1999JC900110, 1999.
BGD
12, 6929–6969, 2015Two decades of inorganic carbon
dynamics
C. Hauri et al.
Title Page
Abstract Introduction
Conclusions References
Tables Figures
◭ ◮
◭ ◮
Back Close
Full Screen / Esc
Printer-friendly Version Interactive Discussion
Discussion
P
a
per
|
Discussion
P
a
per
|
Discussion
P
a
per
|
Discussion
P
a
per
|
Carrillo, C. J., Smith, R. C., and Karl, D. M.: Processes regulating oxygen and carbon dioxide in surface waters west of the Antarctic Peninsula, Mar. Chem., 84, 161–179, doi:10.1016/j.marchem.2003.07.004, 2004.
Dickson, A. G.: Thermodynamics of the dissociation of boric acid in synthetic seawater from 273.15 to 318.15 K, Deep-Sea Res., 37, 755–766, doi:10.1016/0198-0149(90)90004-F,
5
1990.
Dickson, A. G. and Goyet, C.: Handbook of Methods for the Analysis of the Various Parameters of the Carbon Dioxide System in Sea Water, ORNL/CDIAC-74, 1994.
Dickson, A. G. and Millero, F. J.: A comparison of the equilibrium constants for the dissocia-tion of carbonic acid in seawater media, Deep-Sea Res., 34, 1733–1743:
doi:10.1016/0198-10
0149(87)90021-5, 1987.
Dieckmann, G. S., Nehrke, G., Papadimitriou, S., Göttlicher, J., Steininger, R., Kennedy, H., Wolf-Gladrow, D., and Thomas, D. N.: Calcium carbonate as ikaite crystals in Antarctic sea ice, Geophys. Res. Lett., 35, L08501, doi:10.1029/2008GL033540, 2008.
Dierssen, H. M., Smith, R. C., and Vernet, M.: Glacial meltwater dynamics in coastal
15
waters west of the Antarctic peninsula, Proc. Natl. Acad. Sci. USA, 99, 1790–1795, doi:10.1073/pnas.032206999, 2002.
Ducklow, H., Fraser, W., Meredith, M., Stammerjohn, S., Doney, S., Martinson, D., Sailley, S., Schofield, O., Steinberg, D., Venables, H., and Amsler, Ch.: West Antarctic Peninsula: an ice-dependent coastal marine ecosystem in transition, Oceanography, 26, 190–203,
20
doi:10.5670/oceanog.2013.62, 2013.
Ducklow, H. W., Baker, K., Martinson, D. G., Quetin, L. B., Ross, R. M., Smith, R. C., Stam-merjohn, S. E., Vernet, M., and Fraser, W.: Marine pelagic ecosystems: the West Antarctic Peninsula, Philos. Trans. R. Soc. B Biol. Sci., 362, 67–94, doi:10.1098/rstb.2006.1955, 2007. Ducklow, H. W., Clarke, A., Dickhut, R., Doney, S. C., Geisz, H., Kuan H., Martinson, D. G.,
25
Schofield, O. M. E., Stammerjohn, S. E., Steinberg, D. K., and Fraser, W. R.: The marine system of the Western Antarctic Peninsula, in: Antarctic Ecosystems: An Extreme Environ-ment in a Changing World, edited by: Rogers, A. D., Johnston, N. M., Murphy, E. J., and Clarke, A., John Wiley & Sons, Ltd., 2012.
Evans, W., Mathis, J. T., Winsor, P., Statscewich, H., and Whitledge, T. E.: A regression
mod-30
BGD
12, 6929–6969, 2015Two decades of inorganic carbon
dynamics
C. Hauri et al.
Title Page
Abstract Introduction
Conclusions References
Tables Figures
◭ ◮
◭ ◮
Back Close
Full Screen / Esc
Printer-friendly Version Interactive Discussion
Discussion
P
a
per
|
Discussion
P
a
per
|
Discussion
P
a
per
|
Discussion
P
a
per
|
Fransson, A., Chierici, M., Yager, P. L., and Smith, W. O.: Antarctic sea ice carbon dioxide system and controls, J. Geophys. Res., 116, C12035, doi:10.1029/2010JC006844, 2011. Garibotti, I., Vernet, M., Ferrario, M., Smith, R., Ross, R., and Quetin, L.: Phytoplankton spatial
distribution patterns along the western Antarctic Peninsula (Southern Ocean), Mar. Ecol.-Prog. Ser., 261, 21–39, doi:10.3354/meps261021, 2003.
5
Garibotti, I. A.: Interannual variability in the distribution of the phytoplankton standing stock across the seasonal sea-ice zone west of the Antarctic Peninsula, J. Plankton Res., 27, 825–843, doi:10.1093/plankt/fbi056, 2005.
Garibotti, I. A., Vernet, M., and Ferrario, M. E.: Annually recurrent phytoplanktonic assemblages during summer in the seasonal ice zone west of the Antarctic Peninsula (Southern Ocean),
10
Deep-Sea Res., 52, 1823–1841, doi:10.1016/j.dsr.2005.05.003, 2005.
Glover, D., Jenkins, W., and Doney, S.: Modeling Methods for Marine Science, 1st ed., Cam-bridge University Press, New York, 571 pp., 2011.
Goldman, J. and Brewer, P. G.: Effect of nitrogen source and growth rate on
phytoplankton-mediated changes in alkalinity, Limnol. Oceanogr., 25, 352–357,
15
doi:10.4319/lo.1980.25.2.0352, 1980.
Green, S. E. and Sambrotto, R. N.: Plankton community structure and export of C, N, P and Si in the Antarctic Circumpolar Current, Deep-Sea Res., 53, 620–643, doi:10.1016/j.dsr2.2006.01.022, 2006.
Hales, B. and Takahashi, T.: Mesoscale biogeochemical responses to iron fertilization in the
20
upper layers of the Southern Ocean Iron Experiment areas, J. Geophys. Res., 117, C01018, doi:10.1029/2011JC006956, 2012.
Hauri, C., Friedrich, T., and Timmermann, A.: Abrupt onset and prolongation of aragonite un-dersaturation events in the Southern Ocean, submitted, 2015.
Henson, S. A., Sarmiento, J. L., Dunne, J. P., Bopp, L., Lima, I., Doney, S. C., John, J., and
25
Beaulieu, C.: Detection of anthropogenic climate change in satellite records of ocean chloro-phyll and productivity, Biogeosciences, 7, 621–640, doi:10.5194/bg-7-621-2010, 2010. Johnson, K., Sieburth, J. M., Williams, P. J. leB, and Brändström, L.: Coulometric total carbon
dioxide analysis for marine studies: automation and calibration, Mar. Chem., 21, 117–133, doi:10.1016/0304-4203(87)90033-8, 1987.
30
BGD
12, 6929–6969, 2015Two decades of inorganic carbon
dynamics
C. Hauri et al.
Title Page
Abstract Introduction
Conclusions References
Tables Figures
◭ ◮
◭ ◮
Back Close
Full Screen / Esc
Printer-friendly Version Interactive Discussion
Discussion
P
a
per
|
Discussion
P
a
per
|
Discussion
P
a
per
|
Discussion
P
a
per
|
shelf of central Oregon using multi-parameter relationships with hydrographic data, Geophys. Res. Lett., 36, L24601, doi:10.1029/2009GL040778, 2009.
Kim, T.-W., Lee, K., Feely, R. A., Sabine, C. L., Chen, C.-T. A., Jeong, H. J., and Kim, K. Y.: Pre-diction of Sea of Japan (East Sea) acidification over the past 40 years using a multiparam-eter regression model, Global Biogeochem. Cy., 24, GB3005, doi:10.1029/2009GB003637,
5
2010.
Kwok, R.: Spatial patterns of variability in Antarctic surface temperature: connections to the Southern Hemisphere Annular Mode and the Southern Oscillation, Geophys. Res. Lett., 29, 1705, doi:10.1029/2002GL015415, 2002.
Martinson, D. G., Stammerjohn, S. E., Iannuzzi, R. A., Smith, R. C., and Vernet, M.: Western
10
Antarctic Peninsula physical oceanography and spatio–temporal variability, Deep-Sea Res., 55, 1964–1987, doi:10.1016/j.dsr2.2008.04.038, 2008.
Martiny, A. C., Pham, C. T. A., Primeau, F. W., Vrugt, J. A., Moore, J. K., Levin, S. A., and Lomas, M. W.: Strong latitudinal patterns in the elemental ratios of marine plankton and organic matter, Nat. Geosci., 6, 279–283, doi:10.1038/ngeo1757, 2013.
15
McNeil, B. I. and Matear, R. J.: Southern Ocean acidification: a tipping point at 450-ppm atmo-spheric CO2, Proc. Natl. Acad. Sci. USA, 105, 18860–18864, doi:10.1073/pnas.0806318105, 2008.
Mehrbach, C., Culberson, C. H., Hawley, J. E., and Pytkowicz, R. M.: Measurement of the ap-parent dissociation constants of carbonic acid in seawater at atmospheric pressure, Limnol.
20
Oceanogr., 18, 897–907, doi:10.4319/lo.1973.18.6.0897, 1973.
Meredith, M. P., Venables, H. J., Clarke, A., Ducklow, H. W., Erickson, M., Leng, M. J., Lenaerts, J. T. M., and van den Broeke, M. R.: The Freshwater System West of the Antarctic Peninsula: spatial and temporal changes, J. Climate, 26, 1669–1684, doi:10.1175/JCLI-D-12-00246.1, 2013.
25
Montes-Hugo, M., Doney, S. C., Ducklow, H. W., Fraser, W., Martinson, D., Stammerjohn, S. E., and Schofield, O.: Recent changes in phytoplankton communities associated with rapid re-gional climate change along the western Antarctic Peninsula, Science, 323, 1470–1473, doi:10.1126/science.1164533, 2009.
Montes-Hugo, M., Sweeney, C., Doney, S. C., Ducklow, H., Frouin, R., Martinson, D. G.,
Stam-30
BGD
12, 6929–6969, 2015Two decades of inorganic carbon
dynamics
C. Hauri et al.
Title Page
Abstract Introduction
Conclusions References
Tables Figures
◭ ◮
◭ ◮
Back Close
Full Screen / Esc
Printer-friendly Version Interactive Discussion
Discussion
P
a
per
|
Discussion
P
a
per
|
Discussion
P
a
per
|
Discussion
P
a
per
|
Redfield, A.: The biological control of chemical factors in the environment, Am. Sci., 3, 205–221, 1958.
Rubin, S. I., Takahashi, T., Chipman, D. W., and Goddard, J. G.: Primary productivity and nutri-ent utilization ratios in the Pacific sector of the Southern Ocean based on seasonal changes in seawater chemistry, Deep-Sea Res., 45, 1211–1234,
doi:10.1016/S0967-0637(98)00021-5
1, 1998.
Rysgaard, S., Glud, R. N., Lennert, K., Cooper, M., Halden, N., Leakey, R. J. G., Hawthorne, F. C., and Barber, D.: Ikaite crystals in melting sea ice – implications forpCO2 and pH levels in Arctic surface waters, The Cryosphere, 6, 901–908, doi:10.5194/tc-6-901-2012, 2012.
10
Rysgaard, S., Søgaard, D. H., Cooper, M., Pućko, M., Lennert, K., Papakyriakou, T. N.,
Wang, F., Geilfus, N. X., Glud, R. N., Ehn, J., McGinnis, D. F., Attard, K., Sievers, J., Dem-ing, J. W., and Barber, D.: Ikaite crystal distribution in winter sea ice and implications for CO2 system dynamics, The Cryosphere, 7, 707–718, doi:10.5194/tc-7-707-2013, 2013.
Saba, G. K., Fraser, W. R., Saba, V. S., Iannuzzi, R. A., Coleman, K. E., Doney, S. C., Ducklow,
15
H. W., Martinson, D. G., Miles, T. N., Patterson-Fraser, D. L., Stammerjohn, S. E., Steinberg, D. K., and Schofield, O. M.: Winter and spring controls on the summer food web of the coastal West Antarctic Peninsula., Nat. Commun., 5, 4318, doi:10.1038/ncomms5318, 2014. Sarmiento, J. L. and Gruber, N.: Ocean Biogeochemical Dynamics, Princeton University Press,
Princeton, NJ, 528 pp., 2006.
20
Schofield, O., Ducklow, H. W., Martinson, D. G., Meredith, M. P., Moline, M. A., and Fraser, W. R.: How do polar marine ecosystems respond to rapid climate change?, Science, 328, 1520–1523, doi:10.1126/science.1185779, 2010.
Shadwick, E. H., Rintoul, S. R., Tilbrook, B., Williams, G. D., Young, N., Fraser, A. D., Marchant, H., Smith, J., and Tamura, T.: Glacier tongue calving reduced dense water
forma-25
tion and enhanced carbon uptake, Geophys. Res. Lett., 40, 904–909, doi:10.1002/grl.50178, 2013.
Shadwick, E. H., Tilbrook, B., and Williams, G. D.: Carbonate chemistry in the Mertz Polynya (East Antarctica): biological and physical modification of dense water outflows and the export of anthropogenic CO2, J. Geophys. Res. Ocean., 119, 1–14, doi:10.1002/2013JC009286,
30
BGD
12, 6929–6969, 2015Two decades of inorganic carbon
dynamics
C. Hauri et al.
Title Page
Abstract Introduction
Conclusions References
Tables Figures
◭ ◮
◭ ◮
Back Close
Full Screen / Esc
Printer-friendly Version Interactive Discussion
Discussion
P
a
per
|
Discussion
P
a
per
|
Discussion
P
a
per
|
Discussion
P
a
per
|
Smith, D. A., Hofmann, E. E., Klinck, J. M., and Lascara, C. M.: Hydrography and circu-lation of the West Antarctic Peninsula Continental Shelf, Deep-Sea Res., 46, 925–949, doi:10.1016/S0967-0637(98)00103-4, 1999.
Smith, R. C.: Variability of primary production in an Antarctic marine ecosystem as estimated using a multi-scale sampling strategy, Integr. Comp. Biol., 41, 40–56,
5
doi:10.1093/icb/41.1.40, 2001.
Smith, R. C. and Stammerjohn, S. E.: Variations of surface air temperature and sea-ice extent in the western Antarctic Peninsula region, Ann. Glaciol., 33, 493–500, doi:10.3189/172756401781818662, 2001.
Smith, R. C., Martinson, D. G., Stammerjohn, S. E., Iannuzzi, R. A., and Ireson, K.:
10
Bellingshausen and western Antarctic Peninsula region: pigment biomass and sea-ice spatial/temporal distributions and interannual variabilty, Deep-Sea Res., 55, 1949–1963, doi:10.1016/j.dsr2.2008.04.027, 2008.
Stammerjohn, S., Massom, R., Rind, D., and Martinson, D.: Regions of rapid sea ice change: an inter-hemispheric seasonal comparison, Geophys. Res. Lett., 39, L06501,
15
doi:10.1029/2012GL050874, 2012.
Stammerjohn, S. E., Martinson, D. G., Smith, R. C., and Iannuzzi, R. A.: Sea ice in the western Antarctic Peninsula region: spatio-temporal variability from ecological and climate change perspectives, Deep-Sea Res., 55, 2041–2058, doi:10.1016/j.dsr2.2008.04.026, 2008a. Stammerjohn, S. E., Martinson, D. G., Smith, R. C., Yuan, X., and Rind, D.: Trends in
20
Antarctic annual sea ice retreat and advance and their relation to El Niño–Southern Oscillation and Southern Annular Mode variability, J. Geophys. Res., 113, C03S90, doi:10.1029/2007JC004269, 2008b.
Steinacher, M., Joos, F., Frölicher, T. L., Plattner, G.-K., and Doney, S. C.: Imminent ocean acid-ification in the Arctic projected with the NCAR global coupled carbon cycle-climate model,
25
Biogeosciences, 6, 515–533, doi:10.5194/bg-6-515-2009, 2009.
Stone, M.: Cross-validatory choice and assessment of statistical predictions, J. Roy. Stat. Soc. B. Met., 36, 111–147, 1974.
Suess, E., Balzer, W., Hesse, K. F., Müller, P. J., Ungerer, C. A., and Wefer, G.: Calcium carbon-ate hexahydrcarbon-ate from organic-rich sediments of the antarctic shelf: precursors of glendonites,
30