Electroactive Properties and
Biological Applications of Electrospun
PVDF Polymer
Dissertation submitted to the University of Madeira in fulfillment of the requirements for the degree of Master in Nanochemistry and Nanomaterials
by Xiang Yao
Work developed under the supervision of Professor Dr. Pedro Filipe Duarte Louzeiro Pires and co-supervised by Professor Dr. Helena Maria Pires Gaspar Tomás
Faculdade de Ciências Exatas e de Engenharia, Centro de Química da Madeira,
Campus Universitário da Penteada,
i
DECLARATION
I hereby declare that this thesis is the result of my own work, is original and was written by me. I also declare that its reproduction and publication by Madeira University will not break any third party rights and that I have not previously (in its entirety or in part) submitted it elsewhere for obtaining any qualification or degree. Furthermore, I certify that all the sources of information used in the thesis were properly cited.
Funchal, 14th of October 2016
ii
ACKNOWLEDGEMENTS
I would like to express my gratitude to all those who helped me during the writing of this thesis.
My deepest gratitude goes first and foremost to Professor Pedro Pires, my supervisor, for his constant encouragement and guidance. He has walked me through all the stages of my research and writing of this thesis. Without his consistent and illuminating instruction, this thesis could not have reached its present form.
I would like to express gratitude to Professor Helena Tomás, who led me into the world of cells. She gave me all the support to needed in the cell tests.
I also owe special gratitude to Ana Olival, who gave me strong support during cells cytotoxicity that I have done. Thank you for your patience with me who did not know anything in the beginning. Moreover, I learn from you what responsibility is.
Thanks to the SEM characterizations supported by textile college in Donghua University in Shanghai China. I also appreciate the help from Wuhan Textile University in Wuhan China for supporting the rotational rheometer (Kinexus, Malvern Instruments Ltd) and electrospinning apparatus (SS-3556H, Beijing Ucalery tech Co.Ltd).
I would like to thank all members of the Molecular Materials Research Group (MMRG) of Centro de Química da Madeira (CQM) for all the support and friendship.
This master project was supported by Fundação para a Ciência e a Tecnologia
iii
CONFERENCE CONTRIBUTIONS
April 2016 – Oral Presentation:
iv
ABSTRACT
PVDF is a piezoelectric polymer, exhibiting direct and inverse piezoelectric effect, with leading electroactive properties. This material is interesting for building energy transmission and harvesting systems, converting mechanical energy into electrical energy, such as electrospun PVDF sensors. However, only a few reports have shown inverse piezoelectric effect of electrospun PVDF.
In this project the electrospinning technique was used to prepare PVDF nanofiber mat scaffolds for tissue engineering. The main objective is the preparation of electroactuated devices for mechanical stimulation of cells.
Crystal phase ratios and morphology of the PVDF fiber mats were characterized by attenuated total reflectance Fourier transform infrared (FTIR/ATR) spectroscopy and scanning electron micrograph (SEM). For a better understanding of the differences between polar and non-polar PVDF, and of the effect of the electric field on the fibers’ composition, quantum mechanics and molecular dynamics calculations were performed. Several devices were prepared from assemblies of PVDF fiber meshes and conductive ink electrodes, with different geometries. The devices’ electrical impedances were measured as a function of frequency. Finally, the in vitro biocompatibility of the PVDF fiber meshes was tested.
The results revealed that electrospinning parameters have significant effects on the crystal phase ratio and structure. As it was expected, the electrical impedance of PVDF decreased with the increase of β crystal phase ratio, as required for the piezoelectric behaviour of the PVDF fibers. The results also illustrated that the impedance of PVDF fibers mesh assemblies changed with varying shape, thickness, the geometric alignment of the fibers and the distance between conductive ink electrodes.
The molecular simulations were able to predict the α to β phase change which results on partially poled fibers. In vitro cytocompatibility tests of PVDF scaffolds shown that PVDF fibers were not cytotoxic to the NIH/3T3 cells which meant PVDF fiber scaffolds can be used for cell stimulation.
v
RESUMO
O PVDF é um polímero piezoelétrico, que exibe o efeito piezoelétrico direto e indireto. Este material é interessante para construção de sistemas para conversão ou captação de energia mecânica para energia elétrica, tais como sensores baseados em fibras preparadas por electrospinning. No entanto, têm sido reportados poucos trabalhos sobre o efeito piezoelétrico inverso de fibras de PVDF.
Neste projeto, utilizou-se a técnica de electrospinning para preparar estruturas constituídas por tapetes de nanofibras de PVDF, para engenharia de tecidos. O objetivo principal é a preparação de dispositivos eletroatuados para estimulação mecânica de células.
A morfologia e a razão entre estruturas cristalinas dos tapetes de fibras de PVDF foram caracterizados por espectroscopia de infravermelho por transformada de Fourier – reflectância total atenuada (FTIR/ATR) e microscopia eletrónica de varrimento (SEM). Para uma melhor compreensão das diferenças entre o PVDF polarizado e não-polarizado, assim como o efeito do campo elétrico na composição das fibras, realizaram-se cálculos de mecânica quântica e dinâmica molecular. Foram preparadas várias montagens de tapetes de fibras de PVDF em elétrodos de tinta condutora, com diversas geometrias. As impedâncias elétricas dos dispositivos foram medidas em função da frequência. Finalmente, foram realizados testes in vitro para atestar a biocompatibilidade das fibras de PVDF.
Os resultados demonstram que os parâmetros operacionais do electrospinning têm efeitos significativos na estrutura das fibras e na estrutura cristalina. Como se esperava, a impedância elétrica do PVDF decresce com o aumento da fase cristalina α, condição necessária para o comportamento piezoelétrico das fibras. Os resultados também ilustram a dependência que a impedância, dos dispositivos com fibras de PVDF, apresenta em função da forma, espessura, alinhamento das fibras e distância entre elétrodos.
As simulações moleculares conseguiram prever a mudança de fase α para β, que resultam em fibras com polarização parcial. Os testes de citocompatibilidade in vitro, demonstraram que os tapetes de fibras de PVDF não apresentam efeitos citotóxicos para as células NIH/3T3, o que significa que os dispositivos de fibras de PVDF podem ser utlizados para estimulação de células.
vi
CONTENTS
DECLARATION ... i
ACKNOWLEDGEMENTS ... ii
CONFERENCE CONTRIBUTIONS ... iii
ABSTRACT ... iv
RESUMO ... v
CONTENTS... vi
LIST OF FIGURES ... ix
LIST OF TABLES ... xii
LIST OF FORMULAS ... xiii
LIST OF ABBREVIATIONS ... xv
CHAPTER 1-INTRODUCTION ... 1
1.1 PVDF ... 1
1.1.1 Crystalline phase structure of PVDF ... 1
1.1.2 Piezoelectric effects of PVDF ... 4
1.2 Electrospinning process ... 6
1.3 The progresses in Electrospinning PVDF nanofibers ... 7
1.3.1 Normal electrospinning for PVDF nanofibers ... 7
1.3.2 Near-field electrospinning for PVDF fibers ... 8
1.3.3 Effect of experimental electrospinning parameters on PVFD nanofibers ... 10
vii
1.5 Electrical properties of PVDF ... 15
1.5.1 Impedance principle and modeling ... 15
1.5.2 The progress in studing impedance of PVDF ... 17
1.6 The biological applications of PVDF fibers ... 21
1.7 Innovation and objectives ... 22
CHAPTER 2
–
MATERIALS AND METHODS ... 24
2.1 Reagents and equipment ... 24
2.2 Electrospinning PVDF fibers ... 25
2.3 Preparation of PVDF fibers electroactuator ... 27
2.4 Electrical modeling for PVDF electroactuator ... 29
2.5 Preparation for cells cytotoxicity ... 29
2.6 Characterization... 31
2.7 Computational modeling ... 32
CHAPTER 3
–
RESULTS AND DISCUSSION ... 34
3.1 The effect of solvent composition on fiber morphology ... 34
3.2 Rheological properties of spinning solutions ... 35
3.3 The effect of applied voltage on fiber morphology ... 39
3.4 The effect of needle diameter on fiber morphology ... 40
3.5 The effect of solution flow rate on fiber morphology ... 41
3.6 The effect of collector rotating speed on fiber morphology ... 42
3.7 The effect of polymer concentration on crystal phase structure .. 43
3.8 The effect of applied voltage on crystal phase structure ... 46
3.9 The effect of needle diameter on crystal phase structure ... 48
3.10 The effect of spinning speed on crystal phase structure ... 50
3.11 The effect of rotating speed on crystal phase structure ... 51
3.12 The effect of length on device impedance ... 53
3.13 The effect of width on device impedance ... 58
3.14 Fitting between experimental data and electrical model ... 63
3.15 The effect of β phase ratio on the impedance ... 66
viii
CHAPTER 4
–
MOLECULAR MODELLING ... 69
GENERAL CONCLUSIONS ... 76
ix
LIST OF FIGURES
Fig. 1
Atomic point charges predicted by PM3 semi empirical quantum mechanics calculations for PVDF polymer chains with 8 unit cells (white, black and yellow represent hydrogen, carbon and fluorine, respectively).
2
Fig. 2
: a) full α polymer chain; b) polymer chain with mixed α and β domains; c) full β polymer chain (white, black and yellow represent hydrogen, carbon and fluorine, respectively).
3
Fig. 3 The conversion between four different crystal phases 4
Fig. 4 Schematic of direct and inverse piezoelectric effect. 5
Fig. 5 Schematic representation of an electrospinning apparatus. 7
Fig. 6 Near field electrospinning for nanogenerator. 9
Fig. 7
(a), (b) Fabrication process of PVDF nanogenerator via NFES. (c) Photo of PVDF nanogenerator on a plastic substrate. (d) SEM picture showing a suspended PVDF nanofiber with diameter of 700nm.
10
Fig. 8 Schematic of the electrospinning and in-situ poling process1. 11
Fig. 9 Absorption intensity of PVDF FTIR spectrum in wavenumber of
765 𝑐𝑚−1 and 841 𝑐𝑚−1. 13
Fig. 10
Schematic drawing of a preform drawn into a fiber along with SEM microscopy images of a piezoelectric fiber and magnification. Inset: Flexible piezoelectric-stack fiber20.
14
Fig. 11 Different geometric shapes and designs of conductive electrode. 14
Fig. 12 Equivalent circuit model of PVDF fiber meshes. 16
Fig. 13 Equivalent circuit model of a piezoelectric fiber connected to an
impedance analyzer. 17
Fig. 14 Measured (diamonds) and simulated (solid line) electrical impedance real and imaginary parts. 19 Fig. 15 The vibration amplitude at low frequency in PVDF poled and
un-poled membrane. 20
Fig. 16 Circuit model and (b) impedance spectrum; the numbers are
corresponded. 20
Fig. 17 Schematic of main objectives in this project. 23
Fig. 18 (a) and (b) 3D modeling photos in different geometric structure of
PVDF electroactuator. 27
Fig. 19 The real photo of PVDF electroactuator. 29
Fig. 20
SEM images of PVDF fibers produced with different solvent volume ratios of DMF and Acetone: (a) 8:2; (b) 6:4. The polymer composition is the same 12 wt %.
x
Fig. 21 Trending curve of characteristic viscosity in different concentrations of PVDF solutions. 36 Fig. 22 PVDF SEM photos at 2000x (left) and 4000x (right) magnification
factors: (a) 8 wt%, (b) 10 wt%, (c) 12 wt%. 38 Fig. 23 12 wt% PVDF SEM photos at different voltages: (a) 18 kV; (b) 21
kV; (c) 24 kV; (d) in 28 kV. 40 Fig. 24 PVDF SEM photos of fibers obtained with different needle
diameters: (a) 0.5 mm; (b) 0.8 mm; (c) 0.9 mm; (d) 1.2 mm. 41
Fig. 25
SEM images by changing spinning speed from 0.5ml/h to 2.0ml/h with 0.5ml/h interval. (a), (b), (c), (d) are represented by fiber meshes fabricated in spinning speed 0.5ml/h, 1.0ml/h, 1.5ml/h, 2.0ml/h respectively.
42
Fig. 26 SEM images in (a) no rotating speed and (b) 300 rpm rotating
speed. 43
Fig. 27 FTIR-ATR spectrum of PVDF in concentration of 8 %, 10 %,
12 %, 14 wt%. 44
Fig. 28 Trending curve of β crystal phase ratios by changing the PVDF
concentration. 45
Fig. 29
FTIR-ATR spectrum of PVDF fibers obtained (a) at 18, 21, 24, 28 kV spinning voltage with 12 wt% concentration and 1.2 mm spinning needle; (b) at 24, 27, 30, 33 kV spinning voltage with 8 wt% concentration and 0.9 mm spinning needle; the other parameters were the same.
47
Fig. 30 Trending curve of β crystal phase ratios by changing voltages. 48
Fig. 31 FTIR-ATR spectrum of PVDF in different needle diameters. 49
Fig. 32 Trending curve of β crystal phase ratios by changing needle
diameters. 49
Fig. 33 FTIR-ATR spectrum of PVDF fibers produced with 0.5, 1.0, 1.5, and 2.0 mL/h flow rates. 50 Fig. 34 Trending curve of β crystal phase ratios by changing spinning
speed. 51
Fig. 35 FTIR-ATR spectrum of PVDF in different rotating speed. 52
Fig. 36 Trending curve of β crystal phase ratios by changing rotating speed 53
Fig. 37 Impedance amplitude of PVDF devices with constant width (10
mm) and variable length L. 55 Fig. 38 Impedance phase shift of PVDF devices with constant width (10
mm) and variable length. 55 Fig. 39 Impedance values at the low and high frequency limits. 56
Fig. 40 Specific impeditivity of the PVDF devices with constant width (10 mm) and variable length. 58 Fig. 41 Impedance amplitude of PVDF devices with constant length (1
xi
Fig. 42 Impedance phase shift of PVDF devices with constant length (1 mm) and variable width. 59 Fig. 43 Impedance values at the low and high frequency limits. 60
Fig. 44 Specific impeditivity of the PVDF devices with constant length (1 mm) and variable width. 60 Fig. 45 Impedance amplitude of two PVDF devices with the same length
and width: L=1 mm, W= 10 mm. 61
Fig. 46 Impedance phase shift of two PVDF devices with the same length
and width: L=1 mm, W= 10 mm. 62
Fig. 47
Nyquist plot of the resistive and reactive components of the two best PVDF devices with the same length and width: L=1 mm, W= 10 mm. The inset shows the small area around the origin.
62
Fig. 48 Plot of experimental impedance versus the simple RC model. 64
Fig. 49 Fitting trending curve of phase against frequency, blue curve represents experimental data, red curve represents modeling data 64 Fig. 50 Nyquist plot of the resistive and reactive components of the
device’s impedance and RC model. 65 Fig. 51 Apparent capacities. 65
Fig. 52 Results of cell cytocompatibility. 68
Fig. 53 Calibration of the uniform electric field. 70
Fig. 54 The total runs under a uniform electric. 71
Fig. 55
β% calculated from the molecular dynamic simulations at different
electric field values (MV.m-1). Top, all data set. Bottom, detail below 20 ps.
72
Fig. 56 Plot of the maximum β% of at the end of each MD run. 73
Fig. 57 Plot of selected data fitted with equation 19. 74
Fig. 58
Final MD run snapshots (xy projection) of the two PVDF polymer chains under selected electric field intensities (MV.m-1): (a) 0; (b) 113.65; (c) 214.68; (d) 378.85; (e) and (f) 1010.25, xy and yz projections; (g) and (h) 1262.82, xy and yz projections; (i) and (j) 2525.64, xy and yz projections. The electric field direction is along the x axis.
xii
LIST OF TABLES
Table.1 Materials 24
Table.2 Instruments 25
Table.3 Parameters of electrospinning processing 26 Table.4 Parameters of PVDF fiber electroactuator geometry: length (L)
and width (W).
28
Table.5 Parameters of PVDF film electroactuator geometry: length (L) and width (W).
28
Table.6 Different samples in culture wells plate 30 Table.7 Characteristic viscosities in different concentrations of PVDF 36
Table.8 Optimal conditions for fabricating PVDF mats 54
Table.9 Elements values of equivalent circuit with different effective length
66
Table.10 Elements values of equivalent circuit with different effective width
66
xiii
LIST OF FORMULAS
Formula.1
𝐹(𝛽) = 𝐹(𝛽)1.26𝐴 𝐴𝛽
𝛼+ 𝐴𝛽
13
Formula.2 𝑍 = 𝑍
1+𝑍𝑍2∗ 𝑍𝐶 2+ 𝑍𝐶
16
Formula.3 𝑍 = |𝑍|𝑒−𝑖ɵ= 𝑅 + 𝑖𝑋 16
Formula.4 𝑋 = 1
𝑧𝜋𝑓𝐶1
16
Formula.5 𝑍 = |𝑍|𝑒−𝑖ɵ= 𝑅 + 𝑖 1 𝑧𝜋𝑓𝐶1
16
Formula.6
𝑅 = 𝜌 ∗𝐿𝑆 16
Formula.7
𝑅 =𝜌𝑡 𝑊𝐿 16
Formula.8
𝑍𝐶𝑃𝐸(𝑓) = 𝑅𝐶𝑃𝐸
1 + 𝑗𝑓𝑓 0
18
Formula.9
𝑍𝑃(𝑉𝐷𝐹−𝑇𝑟𝐹𝐸)(𝑓) = 1
𝑗𝜀𝑝𝑆𝑝𝑡 𝑝 2𝜋𝑓
18
Formula.10 𝜀𝑝 = 𝜀𝑝′ + 𝑗𝜀𝑝′′ 18
Formula.11 𝑍0(𝑓) = 2𝑅𝑐𝑜𝑛𝑡𝑎𝑐𝑡+ 2𝑍𝐶𝑃𝐸(𝑓) + 𝑍𝑃(𝑉𝐷𝐹−𝑇𝑟𝐹𝐸)(𝑓) 18
Formula.12 ŋ
𝑠𝑝 =ŋ0ŋ− ŋ𝑠 𝑠
31
Formula.13 𝑅 = 𝑍 ∙ cos 𝜃 53
Formula.14 𝑋 = 𝑍 ∙ sin 𝜃 53
Formula.15
𝑍̅ = 𝜁̅ ∙𝑊 ∙ 𝑡𝐿 53
Formula.16
𝜁̅𝑠 = 𝜁̅𝑡 54
Formula.17
xiv Formula 18
𝑇𝑜𝑟𝑠𝑖𝑜𝑛 𝑖𝑠 {𝛽 ⇐ |𝛾 − 180°| ≥ |𝛾 − 60°| ∝ ⇐ |𝛾 − 180°| < |𝛾 − 60°|
68
Fomula 19
𝛽% = 𝐴 + (𝐴 − 𝐵)𝑒−𝑡 𝐶⁄ 73
xv
LIST OF ABBREVIATIONS
°C Celsius
AC Alternating Current
ATR Attenuated Total Reflection
BTEAC Benzyl Triethyl Ammonium Chloride
C Capacitance
CPE Conductive Plastic Electrode
DC Direct Current
DMF Dimethyl Formamide
ECM Extracellular Matrix
EDTA Ethylene Diamine Tetraacetic Acid
EIS Electrochemical Impedance Spectroscopy
F Frequency
FTIR Fourier Transform Infrared
kV kilo Voltage
L Length
MHz Megahertz
MTS a colorimetric assay for assessing cell
metabolic activity
MTT a colorimetric assay for assessing cell
metabolic activity
PAMAM Polyamidoamine Dendrimer
PBS Phosphate Buffered Saline
PLGA Polylactic-co-Glycolic Acid
PMMA Polymethyl Methacrylate
xvi
R Resistance
A Surface Area
S Solvent
SEM Scanning Electron Microscope
SP Specific
T Thickness
TrFE Trifluoroethylene
UC University of California
W Width
XTT a colorimetric assay for assessing cell
metabolic activity
Z Impedance
1
CHAPTER 1-INTRODUCTION
1.1 PVDF
1.1.1 Crystalline phase structure of PVDF
Polyvinylidene fluoride, abbreviated as PVDF, results from the polymerization of CH2 = CF2 monomers, where two hydrogen atoms of ethylene were substituted by
fluorine atoms. PVDF polymer chains exist in five different possible crystalline phases, which are represented by α, β, γ, δ, ε. Among them, α and ε are non-polar and the other three are polar. The differences arise from several possible values of the torsional angle between consecutive monomer unit cells, which results on different chain conformations 1-5. Since fluorine atoms are more electronegative than carbon and
hydrogen, they can be assigned negative point charges. Being the less electronegative, hydrogen atoms are positively charged, whereas carbon atoms are divided into positive or negative, if they are bonded to fluorine or hydrogen, respectively. This simple reasoning can be confirmed by semi empirical quantum mechanics simulations of small polymer chains, as represented in Fig 1. As a consequence, the dipole moments associated to the CH2 or CF2 groups of consecutive polymer unit cells, can totally cancel
2
Fig. 1: Atomic point charges predicted by PM3 semi empirical quantum mechanics calculations for
PVDF polymer chains with 8 unit cells (white, black and yellow represent hydrogen, carbon and
fluorine, respectively).
As shown in Fig. 2, the dipole moment in the non-polar α phase is randomly oriented, whereas in the polar β phase all dipole moments have the same orientation. In long polymer chains, different conformations can be found, between full non-polar , full polar and a mixture of and domains. The percentage of polar domains, or the ratio between polar and non-polar domains, can be expected to affect the overall electric properties and the electrostrictive behavior of a given PVDF macroscopic sample.
3
Fig. 2: a) Full polymer chain; b) Polymer chain with mixed and domains; c) Full polymer
chain (white, black and yellow represent hydrogen, carbon and fluorine, respectively).
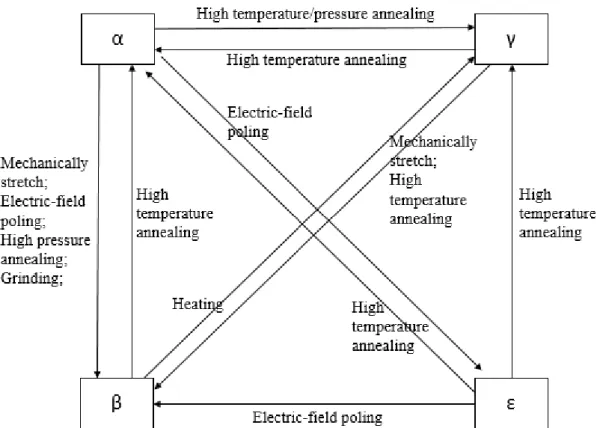
However, the different crystalline phases can be converted to each other by application of different conditions, such as temperature or pressure annealing, electric field poling, or mechanical stress, as we can see from Fig. 3 2,3,4. If no such special
conditions are used, PVDF produced under normal conditions is, usually, non-polar, because the molecular polymer chains are randomly oriented in alternate directions. For example, film casting is one of the methods to produce PVDF film, and in this case, the α phase is the main conformation. To prepare polar PVDF a significant percentage of the dipole moments must be forced to face the same direction, or the polymer chains must be stretched in some way.
Electric-field poling is the most used method for production polar PVDF films and meshes. The PVDF sample is placed between two electrodes and heated to a temperature below the glass transition to increase mobility and allow the rearrangement of torsional angles in the polymer chains. A strong electrostatic field in the kilovolt range, applied between the electrodes, forces the reorientation of intramolecular dipoles resulting on the overall polarization of the polymer chains. When the temperature is
a)
b)
4
lowered the polymer becomes frozen in the polarized state. Experimental results and our own theoretical calculations suggest the non-polar state has a slightly lower energy than the polar state. Since the random organization of dipoles in the state make it higher entropic than the ordered state, the former is expected to be thermodynamically more stable. This idea will be further elaborated in this work’s conclusions. Anyway, any factors which may impact on the final PVDF structure (film, mesh, or other), such as polymer composition and chain size, solvents or doping agents, are expected to modify its properties5.
Fig. 3: The conversion between four different crystal phases. 2,3,4
1.1.2 Piezoelectric effects of PVDF
5
main differences. First, the mechanical deformation of electrostrictive materials has a quadratic dependence from the electric field, whereas piezoelectricity is linear. As consequence of the quadratic dependence, the inversion of the electric field produces the same effect. Secondly, the mechanical deformation of piezoelectric materials produces an electric field perturbation, but the same is not valid for electrostriction. Although the two effects are different, and piezoelectricity is not typical from polymers, poled PVDF with dominant β crystalline phase does behave as a strong piezoelectric material3.
The mechanism of PVDF’s direct and inverse piezoelectric effect is shown in Fig. 4, Direct piezoelectric effect produces electric polarization as a result of applied mechanical deformation, such as stress or compression. The polarization can be interpreted as resulting from repulsion between atomic point charges of adjacent polymer chains and not from effective electric charge displacement. The inverse piezoelectric effect generates mechanical deformation as result of the polymer chains realignment under an applied electric field. For both direct and indirect effects, the polarization degree of the β crystalline phase plays an important role in determining the intensity of the piezoelectric effect6.
6
1.2 Electrospinning process
Electrospinning has been developing for decades and has attracted more and more interest from researchers in various fields, for being a convenient method for nanofiber manufacturing, of different materials, with different structures and properties6-10. The nanoscale, fine and with high specific surface area, give electrospun
nanofibers a great potential for application in biology, engineering, tissue engineering, catalysis, energy storage, electrical engineering, smart devices and so on.
Generally, as shown in Fig. 5 (a), a simple electrospinning setup just requires four necessary parts, including direct current high voltage, mental hollow needle, a syringe pump, and a grounded or negative charged collector. Wherein the mental needle has to be connected with voltage supply, giving a high electrical potential between needle and collector, resulting in charged liquid at the top of needle. The syringe pump is used to control liquid flow speed especially for low viscosity solutions. When this electrostatic force is high enough to overcome the liquids’ surface tension, the flow jet is stretched out of the needle. There is a critical point in the surface of droplet called Taylor cone. Reznik11 et al. described the shape of the Taylor cone precisely at the first
time. They believed that the shape of cone was contributed to the ratio of electrostatic repulsion to surface tension. Then the jet was elongated due to electrostatic repulsion in bended fibers, meanwhile it dries in flight because of solvents’ evaporation until deposited on collector. As the uniformity and thickness distribution result from the fibers bending instability, the morphology of fibers could be adjusted by different parameters, such as polymer components, viscosity, voltage values, collecting distance and so on.
7
well, which is considered into electrospinning setup design. The fiber productivity is close to 300 mg per hour12. Depending on recently developed electrospinning
techniques, the diameters of electrospun fibers are in range of 10 nm to 1 µm.
In this project, two electrospinning setups were used for preparing PVDF nanofibers. Fig. 5 (b) was belong to Wuhan Textile University, Fig. 5 (c) was belong to Madeira University. In principle, these two setups were the same. All the samples were characterized by same methods under the same conditions.
(a)
(b) (c)
Fig. 5: (a)Schematic representation of an electrospinning apparatus10; (b) and (c) Real apparatus.
1.3 The progresses in Electrospinning PVDF nanofibers
1.3.1 Normal electrospinning for PVDF nanofibers
8
electrospinning process, and use heat treatment process to maintain the structure of the fiber membranes. The diameter of obtained fibers was around 380 nm. The filtration efficiency of this fiber membrane to 1 μm polystyrene particles was up to 98%.
Zhe-Qin Dong et al8 prepared PVDF - PTFE composite nanofiber membranes by
electrospinning, to desalinate seawater. The fibers’ diameter was about 500 nm. Cao Jianhua et al9 made PVDF and PVDF-hexafluoropropylene copolymer blended
nanofiber electrolyte membrane, with a diameter distribution between 300-700 nm. Yuan Xiaoyan et al13 dissolved PVDF polymer in DMF and acetone mixed solvent, and
electrospun PVDF ultrafine nanofibers with 50-500 nm diameters. These fibers received a continuous heat treatment process to enhance their mechanical properties. They also prepared PVDF / polycarbonate composite ultrafine fibers with a core/sheat structure, by adding PMMA or BTEAC into the spinning solution, modifying the polymer electrolyte to form a uniform morphology and the core/sheat structure. The fibers obtained had a diameter of 300-500 nm.
1.3.2 Near-field electrospinning for PVDF fibers
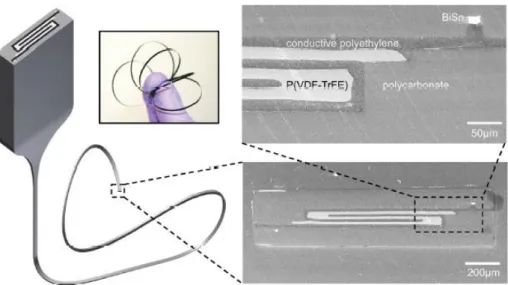
Pan, C. et al14, applied a near-field electrospinning technique to produce
9
Fig. 6: Near field electrospinning for nanogenerator13.
The advantages of near field electrospinning are on the precise control of the nanoscale fibers orientation, keeping the device as small as possible, and, at the same time, avoiding the offset of polarity between nanofibers. Another benefit of this process was that the latest and advanced near-field electrospinning technique enabled the PVDF nanofibers to be directly deposited on the device’s electrodes. This direct writing technology is convenient and precise for controlling different sizes and parameters, and also exhibits potential for mass production. Chieh et al1 in UC Berkeley also prepared
10
Fig. 7: (a), (b) Fabrication process of PVDF nanogenerator via NFES. (c) Photo of PVDF nanogenerator on a plastic substrate. (d) SEM picture showing a suspended PVDF nanofiber with
diameter of 700nm1.
To be more specific, two aluminium electrodes were placed on a plastic substrate, the space between the electrodes was in range from 500 μm to 1 mm, where the aluminium electrode is used to receive nanofibers directly. The aluminium electrodes were connected to the test equipment. Conductive silver was coated on the surface of the PVDF nanofibers, which reduced the contact resistance. They also researched the impact of different experimental parameters on the piezoelectric effect of the PVDF nanofibers, including flow speed of spinning jet, polymer solutions’ concentration, collector rotating speed, and electric-field intensity.
1.3.3 Effect of experimental electrospinning parameters on PVFD nanofibers
11
Since the electrospinning process uses an intense electrostatic field between the needle and the collector, it is a straightforward idea to use this strong electric field to convert α crystalline phase PVDF into β crystalline phase1,7,8. The poling process starts
from the jet flowing out of the needle and continues throughout the flight to the collector, with the intense electric field, stretching the dipole moments into same direction until the solvent evaporates, the polymer chain mobility decreases and the fibers land in the collector. The process depicted in Fig. 8, is named in situ poling process, because the poling and spinning occur simultaneously. The result is a fiber mesh composed of PVDF fibers with a mix of polar and non-polar domains, the ratio of the two (β/α ratio) depending upon the experimental parameters.
Fig. 8: Schematic of the electrospinning and in-situ poling process1.
However, some reports indicate that the electrospinning parameters have significant effects on the β/α ratio. For example, Shao, H. et al5 prepared PVDF
12
and other parameters. The output voltage and current correlate directly with the β/α ratio, no matter which electrospinning parameter are used. This means the β/α ratio is the sole and independent factor affecting the energy conversion efficiency of the PVDF meshes. Abolhasani, M. et al18 enhanced the PVDF piezoelectric output by adjusting
electrospinning parameters. They studied the impact of different ratios between DMF and acetone on the poling efficiency. They also found that high rotating speed of the collector enhanced the β/α ratio, because the high speed rotation favored a specific orientation of the deposited fibers. Different solvents, or differences in the volume ratio with same solvents both resulted in a big difference for fiber morphology. For example, dimethyl sulfoxide and DMF can be used as the solvents of PVDF polymer, but addition of acetone is necessary to improve the solvents volatility; the spinnability of PVDF polymer solutions is higher when the mixture of dimethyl sulfoxide and DMF has a weight ratio of 8:2 with acetone5.16. However, adding too much acetone, the fiber
morphology is inadequate, with beads forming in the fibers, because of excessively fast drying and not enough stretching. Using only DMF and acetone as solvent also results on better evaporation rate of the mixed solvents and better fiber morphology.
None of the studies on PVDF electrospinning gives a definite theoretical framework for the mechanism of to PVDF conversion, neither clarify if the conversion happens: in solution; at the Taylor cone surface; or in-flight (during the early liquid state stage or later solid state). Nevertheless, it is clear that the strong electrostatic field exerts force upon the different groups’ dipole moments, eventually triggering the spontaneous change of torsional angles to a more favorable state. This change is energetically driven, since the high / ratio is entropically disfavored, and takes advantage of the high mobility of single polymer chains during the electrospinning process and subsequent freezing in the solid fiber mesh.
13
content in PVDF solid samples by FTIR. It is the case of absorption bands at: 765 cm -1 (CH2 in-plane bending), 878 cm-1 (CH2 out-of-plane bending), 1073 cm-1 and 1182
cm-1 for α crystalline phase; 841 cm-1 (CF2 asymmetrical stretching) and 1278 cm-1 (C–
F stretching vibrations) for β phase19.
According to Lambert - Beer law, the fraction of β phase can be calculated from the following formula18.
𝐹(𝛽) = 𝐹(𝛽) 𝐴β
1.26𝐴α+𝐴β(1)
Where, 𝐴α and 𝐴β represent the absorption intensity at wavelength of 765 𝑐𝑚
-1 and 841 𝑐𝑚-1, respectively, as pictured in Fig. 918,19.
Fig. 9: Absorption intensity of PVDF FTIR spectrum in wavenumber of 765 𝑐𝑚−1 and 841 𝑐𝑚−1.
Meanwhile, according to the conversion formula between the infrared absorbance and transmittance, we can convert experimental absorbance into transmittance and calculate the ratio of β phase with Lambert-Bill formula.
1.4 Applications of PVDF for inverse piezoelectric effect
14
recently20,21. Chocat et al20 used a pre-forming heat drawing technique to produce up to
kilometer ultrafine fibers, of a PVDF and trifluoroethylene copolymer, embedded in polycarbonate, as shown in Fig. 10, for application on acoustic emission and detection. To be noted, the scope of the acoustic signal spectrum was quite wide, from tens of Hz to tens of megahertz.
As the PVDF fiber mesh is flexible, it can easily be assembled into large dimension structures such as, fabric, reticulate structures or mounted on surface electrodes. To achieve miniaturization and flexibility at the same time, electrodes with different geometric shapes can be designed, like in Fig. 11.
Fig. 10: Schematic drawing of a preform drawn into a fiber along with SEM microscopy images of a piezoelectric fiber and magnification. Inset: Flexible piezoelectric-stack fiber20.
Fig. 11: Different geometric shapes and designs of conductive electrode.
15
piezoelectric effect. It was very sensitive because of the untrafine and folded structure.
1.5 Electrical properties of PVDF
1.5.1 Impedance principle and modeling
Alternant current impedance was also called EIS (Electrochemical Impedance Spectroscopy, abbreviated as EIS). Impedance measurement was a method originally used to study frequency response in linear circuit networks, and introduced to electrochemical research. For the electrode system, a sine wave of AC voltage (current) signal produces a corresponding current (voltage) signals that can be characterized by the impedance or admittance of the electrode. Impedance spectrums generated by series of sine wave signals was named as electrochemical impedance spectroscopy.
A PVDF fiber mesh can be represented by an equivalent circuit as shown in Fig 12. When the electric signal frequency is low, such as 10 Hz, the impedance of the entire circuit is large, the electrical signal can not go through the capacitor C, only through the resistence R2. Therefore the impedance of the circuit is R1 plus R2. Tipically,
because the polymer doesn’t have charge carriers, such as free electrons, mobile ions or holes, it behaves an electrical insulator, or dielectric, and therefore resistence R2 is
very high giving a high impedance value. When the frequency increases to higher values, e.g. 1 MHz, the electrical signal can go through the capacitor C easier than through the resistence R2. Therefore the impedance of the capacitor C dominates the
16
Fig. 12: Equivalent circuit model of PVDF fiber meshes.
The total impedance of the equivalent circuit, Z, is given by:
𝑍 = 𝑍1 +𝑍𝑍22+∗𝑍𝑍𝐶𝐶 (2)
Wherein, Z is the impedance of the entire circuit, 𝑍1 is the impedance of
resistance 𝑅1 , 𝑍2 is the impedance of resistance 𝑅2 , 𝑍𝐶 is the impedance of the
capacitor C.
The complex impedance of RC circuit is:
Z = |Z|e−iɵ = 𝑅 + 𝑖𝑋 (3)
𝑋 =𝑧𝜋𝑓1𝐶 1 (4)
Wherein, Z is he impedance of the entire circuit, f is the frequency of AC signal, ɵ is the phase angle of AC signal, C1 is the capacity of the capacitor C;
So the mathematical model is:
Z=|Z|e−iɵ = 𝑅 + i 1 𝑧𝜋𝑓𝐶1 (5)
Wherein, Z is the impedance of the entire circuit, R is the entire circuit’s resistance, f is the frequency of AC signal, C1 is the capacity of the capacitor C;
To be added, resistance is related to the material’s length 𝐿 and cross sectional area 𝑆 by,
R = ρ ∗𝐿𝑆 (6)
17
Equation 7 indicated that resistance R was proportional to the length 𝐿 , inversely proportional to the surface area S. When the fiber mesh had a certain thickness
𝑡 , the resistance R is inversely proportional to the width 𝑊 . At low frequency, resistance R dominates the impedance of the circuit. R is determined by three variables, which were resistivity (resistivity ρ was independent with the length and width of the fiber mat, regardless of shape), the length, surface area. The resistivity ρ can be assumed constant for the same PVDF fiber batch. As shown in Formula.8, the whole impedance changes with the shape of the fiber mats.
1.5.2 The progress in studing impedance of PVDF
The impedance of PVDF is very important for piezoelectric efficiency. When frequency is too high, the sensitivity of PVDF energy generator is very low22-23. Noémie
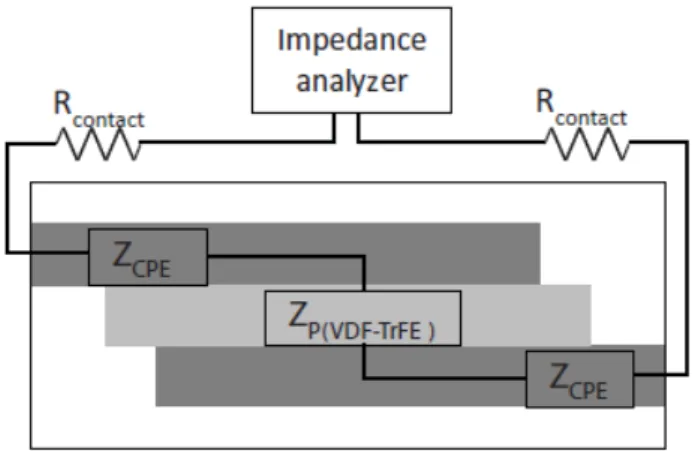
Chocat20 studied the impedance of P(VDF-TrFE) from 42 Hz to 5 MHz as shown in Fig
13. 𝑍𝐶𝑃𝐸 refers to the impedance of conductive electrode, 𝑍𝑃(𝑉𝐷𝐹−𝑇𝑟𝐹𝐸) refers to the
impedance of the piezoelectric layer of P(VDF-TrFE).
Fig. 13: Equivalent circuit model of a piezoelectric fiber connected to an impedance analyzer 20, where CPE represents constant phase element.
18
ciritical value 𝑓0, this particular value 𝑓0 was highly dependent on the preparation of
electrode polymer So they observed the effect of 𝑓0 for different samples on the
resistivity of conductive el ectrode, and arrived at the following equation:
𝑍𝐶𝑃𝐸(𝑓) =1+𝑗𝑅𝐶𝑃𝐸𝑓 𝑓0
(8)
Wherein
𝑅
𝐶𝑃𝐸was
the resistance under low frequency.less than𝑓
0.The impedance of P(VDF-TrEE) was caculated with the following equation:
𝑍𝑃(𝑉𝐷𝐹−𝑇𝑟𝐹𝐸)(𝑓) = 1
𝑗𝜀𝑝𝑆𝑝𝑡𝑝 2𝜋𝑓 (9)
𝜀𝑝 = 𝜀𝑝′ + 𝑗𝜀𝑝′′(10)
Wherein, Sp, tp and εp refered to the effective surface area, the thickness, the
dielectric constant of P(VDF-TrEE) relatively. The dielectric constant was a complex value with real and imaginary part, in this case it was treated as an constant.
The impedance of the system was equivalent to a function of the frequency f which gave an electrical model. As the electrodes were made with a conductive polymer, their impedance varies with frequency. The value of the resistor 𝑅𝑐𝑜𝑛𝑡𝑎𝑐𝑡 is constant
and does not change with frequency. So the whole impedance was given by the following equation:
𝑍0(𝑓) = 2𝑅𝑐𝑜𝑛𝑡𝑎𝑐𝑡+ 2𝑍𝐶𝑃𝐸(𝑓) + 𝑍𝑃(𝑉𝐷𝐹−𝑇𝑟𝐹𝐸)(𝑓) (11)
Fig. 14 shows the real and imaginary components, resistance and reactance, of a piezoelectric fiber with 3 cm, in which the real part is represented by the blue curve, the imaginary part represented by the red curve.
They tested a 3 cm long piezoelectric fiber and measured impedence spectrum. After fitting this model to measured data, they found 𝑅𝑐𝑜𝑛𝑡𝑎𝑐𝑡was 4 kΩ, 𝑅𝐶𝑃𝐸was 58
19
Fig. 14: Measured (diamonds) and simulated (solid line) electrical impedance real and imaginary parts20.
Furthermore, this report said the values of ε'p and ε"p were fitted with references.
It meant this model can be trusted. In conclusion, this research confirmed that the piezoelectric effect of P(VDF-TrEE) was affected by folded structure. By increasing effective area, the piezoelectric effect was improved. It made a theory and pratical foundation for large, flexible and adjusting acoustic emission and detection devices.
Darestani, D. T. et al24 from University of Queensland, prepared PVDF
20
Fig. 15: The vibration amplitude at low frequency in PVDF poled and un-poled membrane 24.
Based on Fig. 13, Furthermore, the circuits model shown in Fig. 16 is to account for the low frequency behavior, they had to use an equivalent circuit model with four elements shown in (a), and the impedance spectrum of PVDF poled membrane is shown in (b). The numbers in (b) represented the elements numbers in (a).
Fig. 16: (a) Circuit model and (b) impedance spectrum; the numbers are corresponded24.
21
1.6 The biological applications of PVDF fibers
The great development of electrospinning technology facilitates its application in various fields, such as preparing biological tissue scaffolds. It partially mimics the structure and function of natural biological extracellular matrix (ECM), promoting cell attachment and growth, because of large space and specific surface area25.26. So far,
there several natural or synthetic polymers were used for electrospining preparation of bioactive scaffolds, such as PAMMA, PLGA27-32. Some reports indicate that PVDF
nanofibers can reduce shrinkage of scar tissue and greatly reduce granuloma formation (scar tissue) 33-35.
In a recent report25, PVDF-TrEE scaffolds were prepared and cell compatibility
was studied. This report pointed that PVDF-TrEE scaffolds have a great potential in tissue engineering applications. Guo et.al studied PU/PVDF composite scaffolds prepared by electrospinning. PU (polyurethane) were thermoplastic and elastic, it was widely used in the manufacturing of prosthesis36-38. PVDF was included in a composite
with PU to increase the flexibility of the scaffold. The study characterized the PVDF crystalline phase, and the piezoelectric effect on fibroblasts cultures in vitro and in vivo. The application of this scaffold was for wound dressings. Wound healing refers to the process of wound repair in skin or other biological tissue. This process can be accelerated or facilitated by the wound dressing39-42. It also mentioned that electrical
stimulation can affect cell behaviors, such as cell growth and reproduction, differentiation and regeneration. Previous studies43-47 indicated that mechanical strain
generated by electrical stimulation of piezoelectric materials may be used to prepare biologically active surfaces. To be mentioned, electrical stimulation can promote expression and secretion of growth factors, affect cells proliferation, differentiation and regeneration48. For example, electrospun scaffold in cardiac tissue engineering
22
The cytotoxicity effect of PVDF fiber meshes on living cells reflects the biocompatibility, which is vital and fundamental in bio-engineering applications. There are several methods to evaluate the cytotoxicity. First, we can use chemical dyes, such as trypan blue to dye and mark some special structure in cells or cell membranes. Second, we can detect some metabolites’ activity in cells to demonstrate cells’ viability indirectly. Third is MTT, XTT or MTS assays, the most common method in biomedical experiments. These assays use resazurin as a reagent to dye enzymes produced by cells. As resazurin is a fluorescent dye and appears fluorescent color under infrared light, which can be used to investigate the cytotoxicity and cell viability. Resazurin is very sensitive, and the sensitivity reached 14 cells / well25.
1.7 Innovation and objectives
Electrospinning tecnique has developed intensively and is commonly used to prepare PVDF nanofibers while, simultaneouslly, converting from α phase to β phase. Most of them were used to study direct piezoelectric effect of PVDF fibers as sensors 52-57. These sensors have excellent flexibility and sensitivity. They are used for heart rate
measurement, pulse sensors, energy harvest devices and so on58-62. Efforts also have
been made on tissue engineering by tring to study the biocompatibility of PVDF nanofibers. However, judging from the different reports, the principles and parameters for preparation of PVDF electrospun nanofibers are not clear and uniform. The inverse piezoelectric effect of PVDF fibers has not been properly studied. Although PVDF nanofibers was regarded as untoxic either in vivo or in vitro , its biocompatibility is still not authorized by FDA (U.S. Food and Drug Administration).
23 1. Preparation of electrospun piezoelectric PVDF nanofibers.
2. Preparation of PVDF fiber mat assemblies on electrodes and test their electric
properties.
3. Study of inverse piezoelectric actuation of nanofiber mat assemblies. 4. Test the biocompatibility of the PVDF nanofibers.
5. Study the effect of piezoelectric actuation on living cells.
Fig. 17: Schematic of main objectives in this project.
In the first step we will use electrospinning to prepare PVDF nanofibers and study the effect of spinning parameters on the morphology and the ratio of β phase to α phase.
The second step is to prepare PVDF fiber mat assemblies on electrodes and study the impedance of PVDF nanofibers mesh in different geometric shapes and β phase ratios.
The third step is for confirming inverse piezoelectric effect at low electrical frequency.
24
CHAPTER 2
–
MATERIALS AND METHODS
2.1 Reagents and equipment
Most materials and instruments are listed in Table. 1 and Table. 2. NIH3T3 cells, which are mouse embryo fibroblasts, were obtained from sub-culturing. Cell culture petri dishes were purchased from Nunc, pipettes were obtained from GenicBio (Shanghai, China). Normal tools, like tweezers, knives, copper wires, glasses, were used for the experiments when needed. Beakers, measuring cylinders, stirrers with different specifications were washed by deionized water and dried in an oven. To be noticed, two different electrospinning apparatus were employed for preparing PVDF nanofibers. Apparatus 1 had some difficulties to adjust syringe pump, so spinning speed was considered invariant. Apparatus 2 was used to investigate the effect of the spinning speed to morphology and crystalline phase of PVDF nanofibers.
Table. 1: Materials.
Name Specification Seller
Polyvinylidene Fluoride (PVDF) FR904, Mw=600.000 Sigma N,N-dimethyl formamide (DMF) Analytical Sigma
Acetone Analytical Sigma
Electric conductive ink
Commercial Bare Conductive
Ltd
Dulbecco’s phosphate buffered saline
D5773-50L Sigma
25
Table. 2: Instruments.
Instrument Type Seller
Electrospinning apparatus 1 (Belong to Madeira
University)
FM1108-Electrospinning System
Beijing Future Material Sci-tech Co.Ltd
Electrospinning apparatus 2 (Belong to Wuhan
Textile University)
SS-3556H Beijing Ucalery tech
Co.Ltd
Electronic analytical balance
ME204E Mettler Toledo
Magnetic stirring apparatus
MR 3001 Heidolph
Rotational rheometer Kinexus Malvern Instruments Ltd
Scanning electron microscope
JSM-6510 JEOL Ltd
Fourier transform infrared spectrometer (ATR)
FTIR 4200 Perkin Elmer
Laminar flow hood Class II A/B3 NUAIRE
Incubator Autoflow IR Direct Heat CO2
NUAIRE
Inverted optical microscopy
CK40 OLYMPUS
Microplate reader VICTOR3™ PerkinElmer
Tissue culture test plates Gamma sterilized Orange Scientific
2.2 Electrospinning PVDF fibers
26
independently and separately, to be dissolved by magnetic stirring for 24 h. The result was the preparation of PVDF polymer solutions with mass-volume concentrations ranging from 2% to 20%, with intervals of 2% concentration. Spinning voltage was set from 18 kV to 32 kV; collector distance was always 15 cm; the rotating collector’s speed was controlled with an electric motor, between 0 and 300 rpm, to obtain fibers with different orientations; spinning speeds were set with polymer liquid solutions flowing at 0.5 ml/h, 1.0 ml/h, 1.5 ml/h, 2.0 ml/h, 3.0 ml/h, using a digitally controlled injection syringe pump; diameters of metal needle tips were 0.5, 0.8, 0.9 and 1.2 mm. Temperature and humidity inside the spinning chamber were maintained within 28 to 30 ℃ and 40% to 50%, respectively.
Table. 3: Parameters of electrospinning processing.
Parameters Values
Polymer concentration (wt%) 0, 2, 4, 6, 8, 10, 12, 14, 16, 18, 20
Applied voltage (kV) 18 to 32
Needle diameter (mm) 0.5, 0.8, 0.9, 1.2
Spinning speed (ml/h) 0.5, 1.0, 1.5, 2.0
Rotating speed (rpm) 0, 100, 200, 300
27
2.3 Preparation of PVDF fibers electroactuator
To be noticed, electrical conductive ink was used as for preparation of electrodes on the glass plates. The conductive ink was chosen as an easy and cheap alternative to gold or silver sputtering, for which we didn’t have the appropriate equipment. The viscous conductive ink is water based and its exact composition is a commercial secret. A secondary objective, for using the conductive ink, was the future prospect of using inkjet printing for the electrode material deposition, directly on the polymer fiber mats.
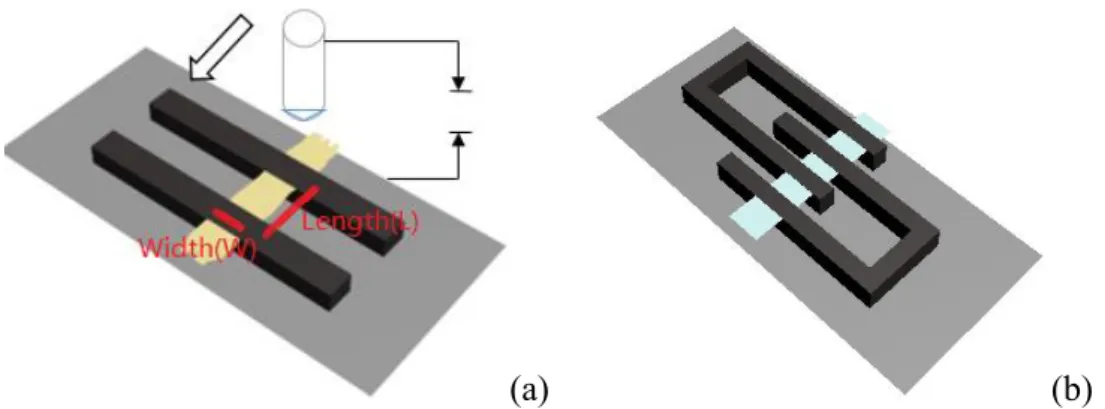
First, the conductive ink was applied on 76 by 26 mm glass slides and allowed to dry; then we cut them into strip electrodes with 1, 2, 4,or 8 mm spacing; the width of the strip electrodes was 5 mm, thickness was estimated to be constant. The electrodes were completed with thin copper wires, bonded to the ink strips with more conductive ink. These electrodes were used as substrates of the PVDF fiber mats. The contact between the fibers and the electrodes was done with a thin layer of fresh conductive ink, covered on top in order to enhance the connection and reduce contact resistance. Fig.18 (a). and Fig.18 (b) shows the two possible structures of PVDF fiber electroactuator. Fiber mesh was suspended between the conductive electrodes.
(a) (b)
Fig. 18: (a) and (b) 3D modeling photos in different geometric structure of PVDF electroactuator.
28
After preparing 1, 2, 4, 8 mm spacing folded conductive electrode substrate, we sticked the 1x11, 12x2, 14x5, 18x10 mm sizes of PVDF fiber meshes on the surface of the electrodes in such way that the fibers’ The orientation should be perpendicular to the parallel direction of the electrode. At last a uniform layer of conductive ink was used to guarantee a gppd contact between the fibers and the electrodes and waited to be dried completely. The specific parameters were in the table. 4.
Table. 4: Parameters of PVDF fiber electroactuator geometry: length (L) and width (W).
L(mm) W(mm)
1 10
2 10
4 10
8 10
By the same way, we sticked the 11x1, 11x2, 11x5,11X10 mm sizes of PVDF fiber meshes on the surface of substrate with 1 mm spacing electrode. The other operation was the same. The specific parameters are in the table. 5.
Table. 5: Parameters of PVDF film electroactuator geometry: length (L) and width (W).
L(mm) W(mm)
1 1
1 2
1 5
1 10
29
Fig. 19: The real photo of PVDF electroactuator.
2.4 Electrical modeling for PVDF electroactuator
According to the Formula 5, we set up an equivalent circuit model. In this model, at low electrical signal frequency, such as 10 Hz, the impedance of the entire circuit was very high. At such low frequency, the electrical signal can not go through capacitor C, and therefore the impedance of the circuit was dominated by resistance R2; When
the frequency increased to 100 kHz, the electrical signal can easily go through the capacitor C, thus the impedance of the circuit was zero.
2.5 Preparation for cells cytotoxicity
30
Under sterile conditions, all the samples were put into petri dishes with 70% volume concentration of ethanol for 5 min, then immersed in PBS solution for half hour to remove residual ethanol. After twice repetition, the samples were put into 24*6 wells culture plates, carefully to make sure they fitted in the bottom of the wells. The culture wells plate was marked as indicated in Table.6.
Table. 6: Different samples in culture wells plate.
Control PVDF PLGA/PVDF PLGA
A01 B01 C01 D01
A02 B02 C02 D02
A03 B03 C03 D03
The NIH/3T3 cells, which named by mouse fibroblasts cell line in cells culturing, were cultured in culture medium and were maintained at 37 ◦C, 5% CO2 in
cell culture petri dish, waiting for inoculation. The culture medium was refreshed every 2 days. Meanwhile we placed the cells culture petri dish under the microscope at 10,000 magnifications to observe the cells morphology and make sure the cells were alive. Then we removed the culture medium and added 1 mL PBS to wash. After several times, we removed all PBS and added 1 mL trypsin, then the petri dish was put back into the incubator for 5 minutes. After adding another 1 mL culture medium, we took 20 μL solution and diluted them into 100 μL. A small amount of dilution was added on the slide, and observed under the optical microscope for cell counting, which allowed us to estimate the total number of cells. Finally, 1 mL of cell culture was added to each previously prepared well, immersing the fiber samples; each culture well received approximately 50000 cells. The culture plate was put in the incubator with labels for 1 and 3 days respectively.
31
2.6 Characterization
In the electrospinning process, the viscosity and rheological properties of the spinning solution has a great influence on the fiber forming and morphology. Before preparation of PVDF fiber meshes, PVDF spinning solutions with different concentrations were tested by Kinexus rheometer to characterize rheological properties and characteristic viscosity. To be more specific, different PVDF solutions were coated onto a fitted metal plate in the rotational rheometer (Kinexus, Malvern Instruments Ltd). Related and characteristic viscosities were recorded automatically under shear stress from 0 Pa to 120 Pa and shear rate from 0.10 s-1 to 100 s-1 at room temperature 25 ℃.
We also tested solvent viscosity and defined it as
ŋ
𝑆.
After collecting raw data, we calculated relative viscosity by the formula:ŋ
𝑠𝑝=
ŋ0ŋ−ŋ𝑆 𝑆 (12)17Wherein
ŋ
0 refers to zero-shear viscosity which were obtained from raw dataat Newtonian region;
ŋ
𝑆 represents the pure solvent viscosity;ŋ
𝑠𝑝 is the specificviscosity which physically characterizes the effect of the polymer on the solution viscosity.
After electrospinning all the nanofiber mesh samples, small cuts were separated for scanning electron microscopy testing. The small cuts were stacked on the surface of carbon conductive paste, then coated with gold powder by JFC 1600 auto fine coater to increase conductivity so that electrons can impinge samples easily. Using the model JSM-6510 scanning electron microscope, the fibers’ morphology was observed. The acceleration voltage of the SEM system was 15 KV. Fiber diameter was measured through image processing software (ImageJ).
FTIR was used to confirm the PVDF composition and also to estimate the /
32
PVDF fibers prepared under different conditions. FTIR-ATR apparatus revealed to be suitable for powder and fibrous samples, sample preparation is simple and easy to operate, test process is fast and results are reliable.
The impedance characterization of the fibers-on-electrodes assemblies was done with an electrochemical workstation, PARSTAT 2263 Advanced Electrichemical System.
At last, a MTT assay was conducted to evaluate the viability of NIH3T3 cells in PVDF fiber meshes. Microplate reader (PerkinElmer VICTOR3™) was used to analysis the cells viability.
2.7 Computational modeling
In order to understand the differences between and phase PVDF, as well as the mechanism behind the transition from to , we performed several molecular modeling studies. Single short polymer chains with 8, 16 and 64 monomer units were separately built, in both perfect and conformations. All molecules were geometrically optimized with the PM3 semiempirical quantum mechanics method, as implemented in HyperChem 8.010 for Windows. The shorter chains, with just 8 monomer units, were also optimized with ab initio quantum mechanics, using a simple 6-31G* basis set, as implemented in Spartan 1.1.4. All simulations were performed on a Windows based laptop with an Intel Core i5-2410M CPU at 2.30 GHz. The quantum mechanics allowed the energy and atomic point charge calculations, which are essential for the response to the external electric field, but even the semiempirical method is too slow for a useful molecular dynamics implementation with multiple polymer chains. Therefore, for the molecular dynamics (MD) study under an external electric field, the AMBER99 force field was the choice and software used was HyperChem 8.010 for Windows.
33
and intensity can be user defined, but its intensity is given in arbitrary units. For the purpose of our study, a simple method using the acceleration of a test charge allowed us to find a conversion factor from those arbitrary units to a more convenient SI unit of volt per meter.
Because the atomic point charges calculated with the PM3 method are very dependent on the conformation and would not be valid throughout the MD study, we decided to use the Gasteiger-Marsili algorithm63 to calculate fixed atomic point charges.
The implementation of Gasteiger’s partial equalization of orbital electronegativities
was done in Microsoft Excel with our own code written in Visual Basic (VBA). For the MD study, two type, 64 monomer units long, polymer chains with
Gasteiger charges were duplicated and allowed to equilibrate in vacuum at a temperature of 500 K for 500 ps and then at 100 K for the same period. This resulted in a ball shaped particle with an approximate diameter of 3 nm and roughly 17% type units. Further MD simulations were performed at 100 K for a 200 ps period, with different values of external electric field. For each simulation run, the number of monomer units with the or conformation was recorded and used to estimate the /
34
CHAPTER 3
–
RESULTS AND DISCUSSION
3.1 The effect of solvent composition on fiber morphology
Since the polymer solution’s solvent can affect the electrospinning process, we tested two different mixtures of DMF and acetone with volume ratios, respectively 8:2 and 6:4. The morphology of the electrospun fibers was observed with SEM as can be seen in Fig. 20. We concluded that when the DMF/acetone volume ratio was 8:2, the lower acetone content resulted on lower volatility in the jet, leading to traces of solvent in the deposited fibers and the formation of relatively large polymer droplets. When the DMF/acetone volume ratio was 6:4, the fiber droplets disappeared, the spinning process was more continuous and the PVDF fiber meshes were easily prepared. So we chose 6:4 as DMF/acetone volume ratio for subsequent experiments. Although we didn’t do any experimental verification, we can reasonably speculate that excess acetone would result on faster solvent evaporation and formation of fibers with larger diameter, which would not be desirable.
(a) (b)
35
3.2 Rheological properties of spinning solutions
To investigate the effect of the polymer solution’s intrinsic properties on morphology of electrospun fibers, we prepared a series of solutions with different concentrations and manufactured the corresponding nanofiber meshes under constant external conditions, like applied voltage, needle diameters and collecting distance.
Generally, from the viewpoint of materials’ properties, the polymer solution’s viscosity is considered the most important parameter in the formation of electrospun fibers. We can explain the effect of viscosity properties of polymer solutions on the electrospinning process, by using polymer chains entanglement17. In this molecular
model, there exists a critical concentration which dictates the electrospinning behavior of the solution, i.e. the polymer solution must have concentration higher than the critical value. First, when the solution concentration is lower than the critical concentration, it means polymer chains are not entangled enough and solution is too dilute for proper electrospinning and formation of nanofibers will be unsuccessful. Second, when the solution concentration is close to the critical concentration, which is called semi-entangled state, there is a higher probability to form nanofibers in the process of electrospinning. But if the polymer chains are not sufficiently entangled, it is easy to form some beads or droplets. Third, when the solution concentration is higher than the critical concentration, polymer chains are sufficiently entangled and this is called concentrated state. In this regime, the successful formation of nanofibers is much easier, without obvious beads. However, there is also a limited concentration range, because when polymer chains are far way entangled, it is very hard to stretch them and form fibers, which means the solution will not be able to cast a jet and thus the electrospinning is impossible.
36
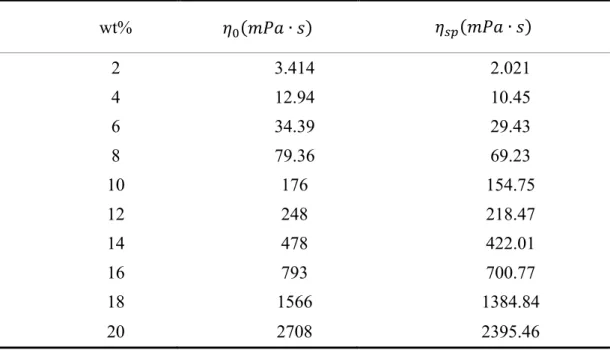
Table. 7: Characteristic viscosities in different concentrations of PVDF.
wt% 𝜂0(𝑚𝑃𝑎 ∙ 𝑠) 𝜂𝑠𝑝(𝑚𝑃𝑎 ∙ 𝑠)
2 3.414 2.021
4 12.94 10.45
6 34.39 29.43
8 79.36 69.23
10 176 154.75
12 248 218.47
14 478 422.01
16 793 700.77
18 1566 1384.84
20 2708 2395.46
We plotted the specific viscosity against polymer solution concentration in Fig. 21 and defined the critical concentration as 8 wt%. The plot was divided in three areas corresponding to the untangled state, semi-entangled state, and concentrated state.
Fig. 21: Trending curve of characteristic viscosity in different concentrations of PVDF solutions.
37
We found that, when the polymer concentration was below the critical value of 8 wt%, neither fibers nor beads were obtained, since the solution was too dilute and the polymer chains were in the untangled state. When the polymer concentration went above the critical concentration, the electrospinning process generated obvious beads along with the fibers. This effect is different from the one observed with the solvent’s volatility and, in this case, according to the polymer chain entanglement model, the solution exhibits the semi-entangled state and the low viscosity, which, associated to the high surface tension, favors the formation of beads and the polymer chains do not stretch completely under the applied electric field.
When the polymer concentration increased to 10 wt%, we could observe that the beads started to disappear from the fiber mesh. In this case the balance between high viscosity and not so high surface tension allow the polymer jet to stretch under the electric force, leading to better formed fibers. Nevertheless, the semi-entangled state still allowed some bead formation.
Once the polymer solution reached 12 wt%, we could consider that the concentrated state, or entangled state, had been achieved, since the SEM images no longer show beads and the fibers were more uniform. This is the adequate regime for electrospinning, provided the viscosity doesn’t become too high, in which case the fluid flow in the needle becomes too difficult. The fiber morphology observed in the SEM images confirm the entanglement model description.
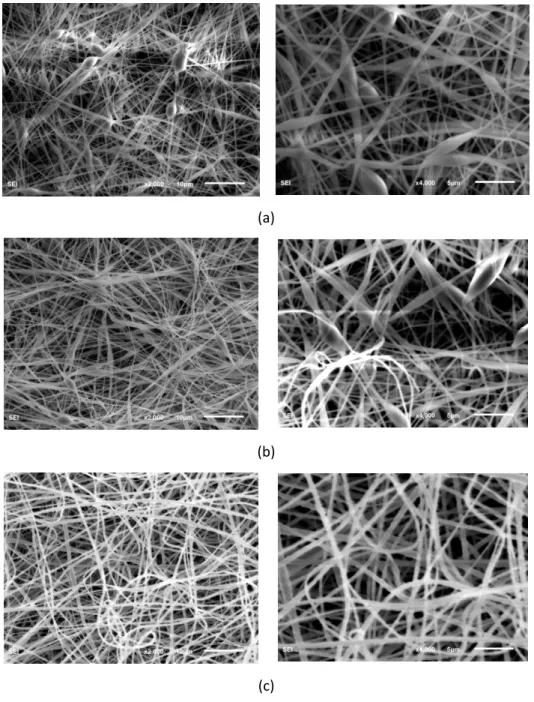
38
images, at 12 wt%, our fibers exhibited quite homogenous thickness, below 500 nm. At 8 and 10 wt% the fibers’ thickness was more disperse and beads larger than 1 m was common. In following experiments, we always choose 12 wt% as experimental concentrations.
(a)
(b)
(c)
Fig. 22: PVDF SEM photos at 2000x (left) and 4000x (right) magnification factors: (a) 8 wt%, (b) 10