AMTD
5, 8223–8240, 2012On the effect of moisture on the
detection of turbulence
R. Wilson et al.
Title Page
Abstract Introduction
Conclusions References
Tables Figures
◭ ◮
◭ ◮
Back Close
Full Screen / Esc
Printer-friendly Version Interactive Discussion
Discussion
P
a
per
|
Dis
cussion
P
a
per
|
Discussion
P
a
per
|
Discussio
n
P
a
per
|
Atmos. Meas. Tech. Discuss., 5, 8223–8240, 2012 www.atmos-meas-tech-discuss.net/5/8223/2012/ doi:10.5194/amtd-5-8223-2012
© Author(s) 2012. CC Attribution 3.0 License.
Atmospheric Measurement Techniques Discussions
This discussion paper is/has been under review for the journal Atmospheric Measurement Techniques (AMT). Please refer to the corresponding final paper in AMT if available.
On the e
ff
ect of moisture on the detection
of tropospheric turbulence from in situ
measurements
R. Wilson1, H. Luce2, H. Hashiguchi3, M. Shiotani3, and F. Dalaudier1
1
Laboratoire Atmosph `eres, milieux, observations spatiales (LATMOS), UMR8190, CNRS/INSU – UPMC Univ Paris 06, 75005, Paris, France
2
Univ. du Sud Toulon-Var, 83957, La Garde Cedex, France
3
Research Institute for Sustainable Humanosphere, Kyoto University, Uji, Japan
Received: 16 October 2012 – Accepted: 4 November 2012 – Published: 8 November 2012 Correspondence to: R. Wilson ([email protected])
AMTD
5, 8223–8240, 2012On the effect of moisture on the
detection of turbulence
R. Wilson et al.
Title Page
Abstract Introduction
Conclusions References
Tables Figures
◭ ◮
◭ ◮
Back Close
Full Screen / Esc
Printer-friendly Version Interactive Discussion
Discussion
P
a
per
|
Dis
cussion
P
a
per
|
Discussion
P
a
per
|
Discussio
n
P
a
per
|
Abstract
The present note addresses the detection of turbulence based on the Thorpe (1977) method applied to an atmosphere where saturation of water vapor occurs. The detec-tion method proposed by Thorpe relies on the reordering in ascending order of a mea-sured profile of a variable conserved through adiabatic processes (e.g. potential
tem-5
perature). For saturated air, the reordering should be applied to a moist-conservative potential temperature,θm, which is analogous to potential temperature for a dry (sub-saturated) atmosphere. Here, θm is estimated from the Brunt-V ¨ais ¨al ¨a frequency
de-rived by Lalas and Einaudi (1974) in a saturated atmosphere. The application to bal-loon data shows that the effective turbulent fraction of the troposphere can dramatically
10
increase when saturation is taken into account. Preliminary results of comparisons with data simultaneously collected from the VHF Middle and Upper atmosphere radar (MUR, Japan) seem to give credence to the proposed approach.
1 Introduction
Several studies dealing with the application of the Thorpe (1977) method for detecting
15
turbulence from balloon data were recently published by Clayson and Kantha (2008); Nath et al. (2010); Alappattu and Kunhikrishnan (2010); Balsley et al. (2010); Kantha and Hocking (2011). The Thorpe method consists in sorting in ascending order the measured profile of potential temperature (in the atmosphere), or potential density (in the ocean or lakes), so as to obtain a reference profile that is stable everywhere. This
20
reference profile corresponds to the minimum in potential energy reachable from mea-surements. The differences in the measured and sorted profiles are expected to be related to overturning events due to turbulence, giving rise to (static) instabilities or to stirring.
In practice, instrumental noise can produce spurious overturns, especially in regions
25
AMTD
5, 8223–8240, 2012On the effect of moisture on the
detection of turbulence
R. Wilson et al.
Title Page
Abstract Introduction
Conclusions References
Tables Figures
◭ ◮
◭ ◮
Back Close
Full Screen / Esc
Printer-friendly Version Interactive Discussion
Discussion
P
a
per
|
Dis
cussion
P
a
per
|
Discussion
P
a
per
|
Discussio
n
P
a
per
|
they are not carefully appreciated. This topic was thoroughly addressed by, e.g. Ferron et al. (1998); Johnson and Garrett (2004); Gargett and Garner (2008) for applications to oceans, and by Wilson et al. (2010, 2011) for applications to the atmosphere.
The Thorpe sorting must be applied to vertical profiles of a conservative quantity through adiabatic processes. In ocean, the Thorpe sorting is applied to potential
den-5
sity profiles measured by Conductivity Temperature Depth (CTD) sensors. These pro-files are retrieved from temperature, pressure and salinity measurements. In a humid (but unsaturated) atmosphere, the Thorpe sorting is applied to potential temperature profiles. For an atmosphere where water vapor reaches saturation, upward motions im-ply water condensation and then release of latent heat, making the air parcels warmer
10
than for a dry adiabatic expansion. Consequently, the static stability in a saturated air is always lower than the static stability in a subsaturated air. As a result, a saturated layer can be unstable but erroneously interpreted as stable if assumed to be dry. Therefore, the Thorpe sorting should be applied to profiles of a conservative quantity taking both states of the atmosphere into account: saturated or subsaturated. An effective potential
15
temperature should depend on the saturation mixing ratio where air is saturated. This quantity somehow plays a role similar to salinity in the oceans.
The present note first aims at explaining how to tackle the problem of air saturation effects when applying the Thorpe sorting to tropospheric data. The impact of saturation on turbulence detection is then evaluated by applying algorithms described by Wilson
20
et al. (2011) to profiles measured by radiosondes. The identification of the mechanisms generating the observed turbulence is out of the topic of the present note but could be the issue of future works.
A field campaign was conducted at Shigaraki MU Observatory (Japan) in September 2011. Thirty six Vaisala RS92SGP radiosondes launched during night time (in order
25
AMTD
5, 8223–8240, 2012On the effect of moisture on the
detection of turbulence
R. Wilson et al.
Title Page
Abstract Introduction
Conclusions References
Tables Figures
◭ ◮
◭ ◮
Back Close
Full Screen / Esc
Printer-friendly Version Interactive Discussion
Discussion
P
a
per
|
Dis
cussion
P
a
per
|
Discussion
P
a
per
|
Discussio
n
P
a
per
|
2 The moist-conservative potential temperatureθm
When the atmosphere is dry, or not saturated (the effect of water vapor being negligible in the free atmosphere), the potential temperature θ (K) is a conservative variable during reversible adiabatic processes. Its expression at altitudezi is calculated from the relation:
5
θ(zi)≡θ[i]=T[i]
P
0
P[i]
R/cp
(1)
where T[i] (K) and P[i] (hPa) are the temperature and pressure at level zi, P0= 1000 hPa is the pressure at the reference level. From a practical point of view, the di-rect calculation ofθfrom Eq. (1) is equivalent to the integration of the empirical vertical gradient of potential temperature, i.e.:
10
θ[i]=θ[0]+ i−1 X
k=0
∂θ
∂z
k
∆z=θ[i−1]+
∂θ
∂z
i−1
∆z (2)
wherez0 is the altitude of the ground level, and ∆z the (constant) vertical sampling
of the measurements. The vertical gradient of potential temperature at levelzk is esti-mated from:
∂θ
∂z
k
=θ[k+1]−θ[k]
∆z . (3)
15
Because the squared Brunt-V ¨ais ¨al ¨a frequency for dry air is defined by Nd2[k]= g
θ[k] dθ
dz
k (where g is the gravitational acceleration, approximated as a constant), Eq. (4) can be written as:
θ[i]=θ[i−1]
1+Nd2[i−1]∆z
g
AMTD
5, 8223–8240, 2012On the effect of moisture on the
detection of turbulence
R. Wilson et al.
Title Page
Abstract Introduction
Conclusions References
Tables Figures
◭ ◮
◭ ◮
Back Close
Full Screen / Esc
Printer-friendly Version Interactive Discussion
Discussion
P
a
per
|
Dis
cussion
P
a
per
|
Discussion
P
a
per
|
Discussio
n
P
a
per
|
Nd2can also be expressed as a function of temperatureT and the dry adiabatic lapse rateΓd=
g cp:
Nd2=g
T
∂T ∂z
+ Γd
. (5)
For saturated (cloudy) air, Durran and Klemp (1982) and Emanuel (1994) showed that the precise condition for static instability is determined by the sign of the square of the
5
so-called moist Brunt-V ¨ais ¨al ¨a frequency rather than by the sign of ∂θe
∂z , whereθeis the
equivalent potential temperature.Nm2 is given by (Lalas and Einaudi, 1974; Durran and
Klemp, 1982):
Nm2 ≈g
T
∂T
∂z
+ Γm 1+
LVqs
RT
− g
1+qw
dq
w
dz
(6)
whereLVis the latent heat of vaporisation of liquid water or ice, approximately constant
10
for the temperatures met in the lower atmosphere.qw=qL+qsis the total water mixing
ratio whereqLis the liquid water or ice mixing ratio andqsis the saturation mixing ratio. In Eq. (6),Γm is the moist saturated lapse rate (Durran and Klemp, 1982):
Γm= Γd(1+qw)× "
1+cpvqsc+cwqL
p +
γL2Vqs
cpRT2
1+qγs
#
−1
(7)
wherecpv and cw are the specific heats for water vapor and liquid (or ice) water,
re-15
spectively and γ≈0.622. As assumed by Durran and Klemp (1982), and because of the lack of information about the saturation mixing ratio in the clouds, we set (dqw/dz)≈(dqs/dz).
For detecting convective instabilities in saturated air, Nd2 must be replaced by Nm2.
The vertical integration of Eq. (4) with Nm2 instead of N 2
d provides a moist potential
AMTD
5, 8223–8240, 2012On the effect of moisture on the
detection of turbulence
R. Wilson et al.
Title Page
Abstract Introduction
Conclusions References
Tables Figures
◭ ◮
◭ ◮
Back Close
Full Screen / Esc
Printer-friendly Version Interactive Discussion
Discussion
P
a
per
|
Dis
cussion
P
a
per
|
Discussion
P
a
per
|
Discussio
n
P
a
per
|
temperature, θm, It slightly differs from other moist potential temperatures reviewed
by Durran and Klemp (1982), but appears to be convenient for applying the Thorpe method in a saturated atmosphere.
The Thorpe sorting is thus applied to a “composite potential temperature” profile (hereafter notedθ∗) computed from Eq. (4), by using N
2
d for subsaturated air, andN 2 m
5
for saturated air. Of course,θ∗does not refer to a conservative quantity throughout the
overall profile. It is rather defined as a thermodynamic variable which is adapted for applying the Thorpe sorting.
3 Identification of the saturated regions
The calculation ofθ∗ requires first to identify the saturated regions using relative hu-10
midity (RH) profiles measured by radiosondes. As described by, e.g. Miloshevich et al. (2004), the relative humidity measured by the radiosondes is calculated with respect to liquid water. For heights above the freezing point, saturation over ice must be ad-dressed. The saturation pressure of water over ice,ei, can be estimated from the
em-pirical expression given by Murphy and Koop (2005) (and references therein):
15
ei(T)=exp
28.9074−6143.7
T
(8)
whereT is in K andei in Pa. Expression (8) is valid for negative temperatures down to−80◦C. For heights above the freezing point, the measured RH should be multiplied
byew/eiso that RHsat=100 %. For estimatingew, we used the Goff-Gratch equation
recommended by the World Meteorological Organization (Goff, 1957).
20
In practice, accurate measurements of humidity are difficult (e.g. Nash et al., 2010) and values of RH vary around the saturation thresholds in clouds. Various systematic (dry) biases were identified for Vaisala radiosondes and corrections by software were proposed by e.g. Miloshevich et al. (2004, 2009). Nevertheless, a number of cloud layers would not be detected if the aforementioned criterion was strictly used. Empirical
AMTD
5, 8223–8240, 2012On the effect of moisture on the
detection of turbulence
R. Wilson et al.
Title Page
Abstract Introduction
Conclusions References
Tables Figures
◭ ◮
◭ ◮
Back Close
Full Screen / Esc
Printer-friendly Version Interactive Discussion
Discussion
P
a
per
|
Dis
cussion
P
a
per
|
Discussion
P
a
per
|
Discussio
n
P
a
per
|
methods based on comparisons with other instruments were proposed by e.g. Wang and Rossow (1995); Poore and Rossow (1995); Zhang et al. (2010). These empirical methods are evolving with the improvements of the humidity sensors.
In order to appreciate the impact of saturation on the detection of turbulence, we applied the empirical method recently proposed by Zhang et al. (2010) (hereafter
5
noted Z2010) for detecting clouds from Vaisala RS92SGP radiosondes. Drawing upon a method described by Wang and Rossow (1995), Z2010 selected atmospheric layers as saturated if they satisfy the two following conditions (among other refinements that we did not consider for simplicity):
min(RH)≥RHmin everywhere, and max(RH)≥RHmax somewhere, (9) 10
where RH is computed with respect to ice ifT <0◦C. RHminand RHmaxare two
thresh-olds on RH. While Wang and Rossow (1995) used constant threshthresh-olds (RHmin=84 % and RHmax=87 %), Z2010 defined thresholds decreasing with altitude, from 95 %
(92 %) to 80 % (75 %), respectively. The clouds detected from their thresholds were shown to be quite consistent with the results of observations from remote sensing
15
techniques (e.g. Fig. 7 of Z2010).
It must be noted that the derivations ofNd2 and Nm2 are made for dry and saturated
airs separately. These theoretical derivations fail to express the stability at condensa-tion levels and at cloud edges (i.e. at the limit between clear and saturated airs). It is assumed that this problem will not significantly affect our results.
20
4 Results
A field campaign was conducted during September 2011 at the Shigaraki MU Obser-vatory (34.85◦N, 136.10◦E, Japan). MUR was continuously operated in range-imaging mode using frequency diversity devoted to improve its range resolution, e.g. (Luce et al., 2006). The carrier frequency of MUR is 46.5 MHz so that it is mainly sensitive to
25
AMTD
5, 8223–8240, 2012On the effect of moisture on the
detection of turbulence
R. Wilson et al.
Title Page
Abstract Introduction
Conclusions References
Tables Figures
◭ ◮
◭ ◮
Back Close
Full Screen / Esc
Printer-friendly Version Interactive Discussion
Discussion
P
a
per
|
Dis
cussion
P
a
per
|
Discussion
P
a
per
|
Discussio
n
P
a
per
|
scale) even in presence of clouds or weak precipitations (say, less than 10 mm h−1). Therefore, small-scale refractivity turbulence can be monitored by MUR in both clear air and cloudy conditions.
Depending on the anisotropy of the refractive index irregularities at the Bragg scale, VHF radar echoes can strongly depend on the zenith angle of the radar beam direction,
5
and, to a less extent, to the azimuth (e.g. Worthington et al., 1999; Hirono et al., 2004). A weak dependence of echo power with the radar beam direction strongly suggests that isotropic turbulent scatter is the dominant radar backscattering mechanism (e.g. R ¨ottger and Liu, 1978). This property is important for the present context as we shall see later.
10
In addition, in situ data from 59 RS92G Vaisala radiosondes (thirty six during night periods) were gathered at the observatory in support of the radar observations. The Vaisala processing software can provide both raw and processed data at a frequency sampling of 1 Hz and 2 Hz, respectively. For our purpose, the raw data were used and re-processed using methods described by Wilson et al. (2011). The rms value of
15
the noise level on the temperature measurements wasσN∼3×10
−2
K. In addition, the balloons were underinflated so that most profiles were obtained at a vertical resolution of 3–5 m only (instead of 10 m or more for the standard processed profiles sampled at 2 Hz). A similar method has already been used by Balsley et al. (2010) for boundary layer observations.
20
4.1 Case study
As an illustration, Fig. 1 displays the vertical profiles of temperature (Fig. 1a), relative humidity over liquid and ice (Fig. 1b) andθandθ∗(Fig. 1c) for flight 52 (26 September
2011, 02:38 LT). Saturation over ice was likely to occur in the height range 5.5–12 km despite the fluctuating behavior of the RH profiles, close to or above 100 %. A thick
25
AMTD
5, 8223–8240, 2012On the effect of moisture on the
detection of turbulence
R. Wilson et al.
Title Page
Abstract Introduction
Conclusions References
Tables Figures
◭ ◮
◭ ◮
Back Close
Full Screen / Esc
Printer-friendly Version Interactive Discussion
Discussion
P
a
per
|
Dis
cussion
P
a
per
|
Discussion
P
a
per
|
Discussio
n
P
a
per
|
zone was also identified from meteorological charts and high levels of humidity were diagnosed from NCEP data re-analysis above the altitude of∼6.0 km (not shown).
As expected, the stability is reduced (with respect to dry air conditions) in the height ranges where air is assumed to be saturated (5.5–12 km) (Fig. 1c). The vertical gradi-ents ofθandθ∗profiles will only differ in the regions where saturation occurs. Indeed, 5
the two profiles in dry regions are parallel (or superimposed) before a saturated layer is met, i.e. below the altitude of 5.7 km in Fig. 1c.
Figure 2 show the overturning events selected from the θ and θ∗ profiles (a and
b, respectively). The top panels of Fig. 2 show the Thorpe displacements (m) for the selected turbulent layers according to the criterion described by Wilson (2010). The
10
bottom panels show the corresponding Thorpe lengths, LT (m), estimated for each
event. The decrease of stability is such that a large fraction of the cloud above the altitude of 6.0 km is detected as turbulent.
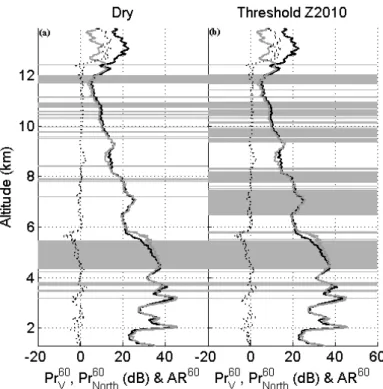
Figure 3 displays the corresponding vertical profiles of MUR echo powerP averaged over 60 min during the balloon flight and corrected from the ranger attenuation effects
15
(i.e.P ×r2) in dB (arbitrary levels) measured with the vertical beam and the northward beam titled 10◦ offzenith. The radar aspect ratio, defined as PVert/PNorth (dB) is also
shown. The gray rectangles show the selected overturning regions fromθandθ∗
pro-files (Fig. 3a, b, respectively). The radar echo power propro-files exhibit smooth fluctuations and are similar at vertical and oblique incidences in the height range 4.0–12.0 km
con-20
sistent with nearly isotropic turbulence. The results obtained from θ(dry) profile only show sparse and thin overturning regions in the saturated layer (6–12 km). The same analysis from theθ∗ profile rather reveals several deep turbulent layers within this
sat-urated (cloudy) region. The vertical extent of these layers is consistent with the extent of saturated region and with the isotropy of the smooth radar echo power profiles. This
25
result is thus a strong indication that the use ofθ∗profile is more relevant than the use
AMTD
5, 8223–8240, 2012On the effect of moisture on the
detection of turbulence
R. Wilson et al.
Title Page
Abstract Introduction
Conclusions References
Tables Figures
◭ ◮
◭ ◮
Back Close
Full Screen / Esc
Printer-friendly Version Interactive Discussion
Discussion
P
a
per
|
Dis
cussion
P
a
per
|
Discussion
P
a
per
|
Discussio
n
P
a
per
|
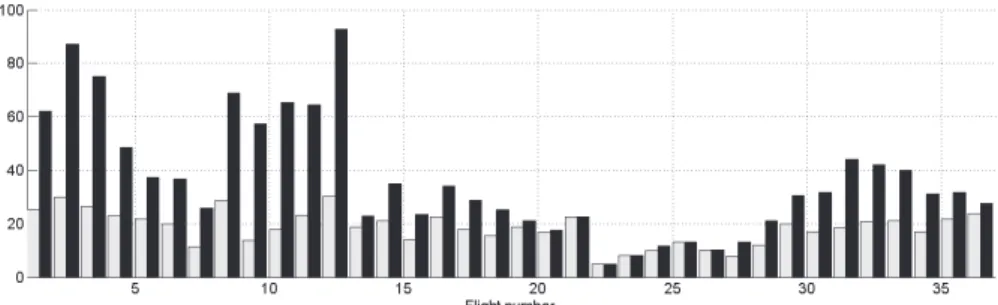
4.2 Statistics
Statistical results from the data collected from the 36 flights performed during night periods are shown in Fig. 4. The turbulent fractions, i.e. the ratios of total depths of the regions selected as turbulent to the depth of the overall troposphere are displayed. The gray and black bars show the turbulent fractions for each flight by assuming a dry
at-5
mosphere and by including the saturation effects, respectively. In average, the turbulent fraction reaches 34.2 % of the troposphere when saturation is taken into account. It is only 18.6 % if the overall troposphere is assumed to be dry. However, the total number of selected events in theθ∗ profiles is less than in theθprofiles (854 instead of 1044)
because some of them merged together and are thus deeper: the mean and median
10
depths are 223 m and 81 m, instead of 99 m and 60 m, respectively.
Because saturation frequently occurred during the 12 first flights, the dry air hypoth-esis would lead to a strong underestimate of the turbulent fraction of the troposphere. This fraction can exceed 80 % when saturation is taken into account (see flights 2 and 12) but is less than 30 % when assuming a dry air. After the 12th flight, the troposphere
15
became drier (i.e. almost no cloud) and little or no difference was found between the turbulent fractions. After the 31st flight, the turbulent fractions increase when including saturation effects due to the passage of a moist upper level front (not shown).
5 Summary and conclusions
The present note aimed to demonstrate the need for including the effects of air moisture
20
when detecting temperature turbulence in the troposphere from in situ (balloon) mea-surements by using the Thorpe method. The effect of saturation was not considered in any previous work on the topic. Since the Thorpe method is based on sorting the profile of a conservative (and monotonic) variable, our study suggests that the relevant variables are the potential temperature,θ, for subsaturated air and a moist potential
25
AMTD
5, 8223–8240, 2012On the effect of moisture on the
detection of turbulence
R. Wilson et al.
Title Page
Abstract Introduction
Conclusions References
Tables Figures
◭ ◮
◭ ◮
Back Close
Full Screen / Esc
Printer-friendly Version Interactive Discussion
Discussion
P
a
per
|
Dis
cussion
P
a
per
|
Discussion
P
a
per
|
Discussio
n
P
a
per
|
the moist Brunt-V ¨ais ¨al ¨a frequency defined by Lalas and Einaudi (1974) and demon-strated to be accurate by Durran and Klemp (1982). An empirical method proposed by Zhang et al. (2010) was applied for determining the saturated layers from Vaisala RS92 radiosonde measurements. Air saturation reduces static stability with respect to dry air (the well-known conditional instability) so that small-scale turbulence triggered
5
by convective or dynamic instabilities is more likely to develop in clouds. As a matter of fact, small-scale turbulence is commonly observed in both stratiform or cumuliform clouds (e.g. Houze, 1993). Therefore, as expected, the detected turbulent fraction of a (cloudy) troposphere is significantly larger if saturation effects are properly taken into account when applying the Thorpe method.
10
Acknowledgements. Financial support for the stay of two authors (R. Wilson and H. Luce) was provided by RISH during the field campaign. Part of this work was carried out during the stay of H. luce at RISH founded by the National Institute of Information and of Communications Technology (NICT, Japan). Radiosondes were founded by LATMOS.
The publication of this article is financed by CNRS-INSU.
15
AMTD
5, 8223–8240, 2012On the effect of moisture on the
detection of turbulence
R. Wilson et al.
Title Page
Abstract Introduction
Conclusions References
Tables Figures
◭ ◮
◭ ◮
Back Close
Full Screen / Esc
Printer-friendly Version Interactive Discussion
Discussion
P
a
per
|
Dis
cussion
P
a
per
|
Discussion
P
a
per
|
Discussio
n
P
a
per
|
References
Alappattu, D. P. and Kunhikrishnan, P. K.: First observations of turbulence parameters in the troposphere over the Bay of Bengal and the Arabian Sea using radiosonde, J. Geophys. Res., 115, D06105, doi:10.1029/2009JD012916, 2010. 8224
Balsley, B., Kantha, L., and Colgan, W.: On the use of Slow Ascent Meter-Scale (SAMS)
Ra-5
diosondes for observing overturning events in the free atmosphere, J. Atmos. Ocean. Tech., 27, 766–775, 2010. 8224, 8230
Clayson, C. A. and Kantha, L.: On turbulence and mixing in the free atmosphere inferred from high-resolution soundings, J. Atmos. Ocean. Tech., 25, 833–852, 2008. 8224
Durran, D. R. and Klemp, J.: On the effects of moisture on the Brunt–V ¨ais ¨al ¨a frequency, J.
10
Atmos. Sci., 39, 2152–2158, 1982. 8227, 8228, 8233
Emanuel, K.: Atmospheric Convection, Oxford University Press, New York, 1994. 8227 Ferron, B., Mercier, H., Speer, K., Gargett, A., and Polzin, K.: Mixing in the Romanche fracture
zone, J. Phys. Oceanogr., 28, 1929–1945, 1998. 8225
Gargett, A. E. and Garner, T.: Determining Thorpe scales from ship-lowered CTD density
pro-15
files, J. Atmos. Ocean. Tech., 25, 1657–1670, 2008. 8225
Goff, J.: Saturation pressure of water on the new Kelvin temperature scale, T. Am. Soc. Heat. Vent. Eng., 63, 347–354, 1957. 8228
Hirono, M., Luce, H., Yamamoto, M., and Fukao, S.: Horizontal maps of echo power in the lower stratosphere using the MU radar, Ann. Geophys., 22, 717–724,
doi:10.5194/angeo-22-717-20
2004, 2004. 8230
Houze, R. A. J.: Cloud Dynamics, Academic Press, San Diego, California, 1993. 8233
Johnson, H. L. and Garrett, C.: Effect of noise on Thorpe scales and run lengths, J. Phys. Oceanogr., 34, 2359–2372, 2004. 8225
Kantha, L. and Hocking, W.: Dissipation rates of turbulence kinetic energy in the free
atmo-25
sphere: MST radar and radiosondes, J. Atmos. Sol.-Terr. Phy., 73, 1043–1051, 2011. 8224 Lalas, D. and Einaudi, F.: On the correct use of the wet adiabatic lapse rate in stability criteria
AMTD
5, 8223–8240, 2012On the effect of moisture on the
detection of turbulence
R. Wilson et al.
Title Page
Abstract Introduction
Conclusions References
Tables Figures
◭ ◮
◭ ◮
Back Close
Full Screen / Esc
Printer-friendly Version Interactive Discussion
Discussion
P
a
per
|
Dis
cussion
P
a
per
|
Discussion
P
a
per
|
Discussio
n
P
a
per
|
Luce, H., Hassenpflug, G., Yamamoto, M., and Fukao, S.: High-resolution vertical imaging of the troposphere and lower stratosphere using the new MU radar system, Ann. Geophys., 24, 791–805, doi:10.5194/angeo-24-791-2006, 2006. 8229
Miloshevich, L. M., Paukkunen, A., V ¨omel, H., and Oltmans, S. J.: Development and validation of a time-lag correction for vaisala radiosonde humidity measurements, J. Atmos. Ocean.
5
Tech., 21, 1305–1327, 2004. 8228
Miloshevich, L. M., V ¨omel, H., Whiteman, D. N., and Leblanc, T.: Accuracy assessment and correction of Vaisala RS92 radiosonde water vapor measurements, J. Geophys. Res., 114, D11305, doi:10.1029/2008JD011565, 2009. 8228
Murphy, D. and Koop, T.: Review of the vapour pressures of ice and supercooled water for
10
atmospheric applications, Q. J. Roy. Meteor. Soc., 131, 1539–1565, 2005. 8228
Nash, J., Oakley, T., V ¨omel, H., and Wei, L.: WMO intercomparison of high quality radiosonde systems, Tech. Rep. instruments and observing methods, Report No. 107, World Meteoro-logical Organization, 2010. 8228
Nath, D., Venkat Ratman, M., Patra, A. K., Krishna Murthy, B. V., and Bhaskar Rao, S. V.:
15
Turbulence characteristics over tropical station Gadanki (13.5◦
N, 79.2◦
E) esti-mated using high-resolution GPS radiosonde data, J. Geophys. Res., 115, D07102, doi:10.1029/2009JD012347, 2010. 8224
Poore, K. D., Wang, J., and Rossow, W.: Cloud layer thicknesses from a combination of surface and upper-air observations, J. Climate, 8, 550–568, 1995. 8229
20
R ¨ottger, J. and Liu, C. H.: Partial reflection and scattering of VHF radar signals from the clear atmosphere, Geophys. Res. Lett., 5, 357–360, 1978. 8230
Thorpe, S. A.: Turbulence and mixing in a Scottish Lock, Philos. T. R. Soc. Lond. A, 286, 125– 181, 1977. 8224
Wang, J. and Rossow, W.: Determination of cloud vertical structure from upper-air observations,
25
J. Appl. Meteorol., 34, 2243–2258, 1995. 8229
Wilson, R., Luce, H., Dalaudier, F., and Lefr `ere, J.: Turbulent patch identification in potential density/temperature profiles, J. Atmos. Ocean. Tech., 26, 977–993, 2010. 8225
Wilson, R., Dalaudier, F., and Luce, H.: Can one detect small-scale turbulence from stan-dard meteorological radiosondes?, Atmos. Meas. Tech., 4, 795–804,
doi:10.5194/amt-4-795-30
AMTD
5, 8223–8240, 2012On the effect of moisture on the
detection of turbulence
R. Wilson et al.
Title Page
Abstract Introduction
Conclusions References
Tables Figures
◭ ◮
◭ ◮
Back Close
Full Screen / Esc
Printer-friendly Version Interactive Discussion
Discussion
P
a
per
|
Dis
cussion
P
a
per
|
Discussion
P
a
per
|
Discussio
n
P
a
per
|
Worthington, R. M., Palmer, R. D., and Fukao, S.: Letter to the Editor: Complete maps of the aspect sensitivity of VHF atmospheric radar echoes, Ann. Geophys., 17, 1116–1119, doi:10.1007/s00585-999-1116-z, 1999. 8230
Zhang, J., Chen, H., Li, Z., Fan, X., Peng, L., Yu, Y., and Cribb, M.: Analysis of cloud layer struc-ture in Shouxian, China, using RS92 radiosonde aided by 95 GHz cloud radar, J. Geophys.
5
AMTD
5, 8223–8240, 2012On the effect of moisture on the
detection of turbulence
R. Wilson et al.
Title Page
Abstract Introduction
Conclusions References
Tables Figures
◭ ◮
◭ ◮
Back Close
Full Screen / Esc
Printer-friendly Version Interactive Discussion
Discussion
P
a
per
|
Dis
cussion
P
a
per
|
Discussion
P
a
per
|
Discussio
n
P
a
per
|
−60−50−40−30−20−10 0 10 2
4 6 8 10 12 14
Temperature (°C)
Altitude (km)
20 40 60 80 100 120 2
4 6 8 10 12 14
RH (%)
300 320 340 360 380 2
4 6 8 10 12 14
0 (K) 2011/09/26 from 02:38 , Flight 52 Relative Humidities Potential temperatures
RH_ice
RH_liq theta_d theta_*
AMTD
5, 8223–8240, 2012On the effect of moisture on the
detection of turbulence
R. Wilson et al.
Title Page
Abstract Introduction
Conclusions References
Tables Figures
◭ ◮
◭ ◮
Back Close
Full Screen / Esc
Printer-friendly Version Interactive Discussion
Discussion
P
a
per
|
Dis
cussion
P
a
per
|
Discussion
P
a
per
|
Discussio
n
P
a
per
|
−600−400−200 0 200 400 600 2
4 6 8 10 12
310 320 330 340 350 360
0 100 200 300 2
4 6 8 10 12
Thorpe Length (m) (a)
Altitude (km)
Altitude (km)
Dry Atmosphere : LR52
Thorpe Displacements (m)
Potential temperature (K)
300 310 320 330 340
0 50 100 150 200 250 300 350 2
4 6 8 10 12
Altitude (km)
Potential temperature (K)
Thorpe Length (m) 300
Moist Atmosphere : LR52 (b)
−600−400−200 0 200 400 600 2
4 6 8 10 12
Altitude (km)
Thorpe Displacements (m)
AMTD
5, 8223–8240, 2012On the effect of moisture on the
detection of turbulence
R. Wilson et al.
Title Page
Abstract Introduction
Conclusions References
Tables Figures
◭ ◮
◭ ◮
Back Close
Full Screen / Esc
Printer-friendly Version Interactive Discussion
Discussion
P
a
per
|
Dis
cussion
P
a
per
|
Discussion
P
a
per
|
Discussio
n
P
a
per
|