Gaze Behavior in One-Handed Catching and
Its Relation with Interceptive Performance:
What the Eyes Can't Tell
Benedetta Cesqui1,2*, Maura Mezzetti3, Francesco Lacquaniti1,2,4, Andrea d'Avella1,5
1Laboratory of Neuromotor Physiology, IRCCS Santa Lucia Foundation, Rome, Italy,2Centre of Space Bio-medicine, University of Rome Tor Vergata, Rome, Italy,3Department of Economics and Finance, University of Rome Tor Vergata, Rome, Italy,4Department of Systems Medicine, Neuroscience Section, University of Rome, Tor Vergata, Rome, Italy,5Department of Biomedical Sciences and Morphological and Functional Images, University of Messina, Messina, Italy
Abstract
In ball sports, it is usually acknowledged that expert athletes track the ball more accurately than novices. However, there is also evidence that keeping the eyes on the ball is not al-ways necessary for interception. Here we aimed at gaining new insights on the extent to which ocular pursuit performance is related to catching performance. To this end, we ana-lyzed eye and head movements of nine subjects catching a ball projected by an actuated launching apparatus. Four different ball flight durations and two different ball arrival heights were tested and the quality of ocular pursuit was characterized by means of several timing and accuracy parameters. Catching performance differed across subjects and depended on ball flight characteristics. All subjects showed a similar sequence of eye movement events and a similar modulation of the timing of these events in relation to the characteris-tics of the ball trajectory. On a trial-by-trial basis there was a significant relationship only be-tween pursuit duration and catching performance, confirming that keeping the eyes on the ball longer increases catching success probability. Ocular pursuit parameters values and their dependence on flight conditions as well as the eye and head contributions to gaze shift differed across subjects. However, the observed average individual ocular behavior and the eye-head coordination patterns were not directly related to the individual catching perfor-mance. These results suggest that several oculomotor strategies may be used to gather in-formation on ball motion, and that factors unrelated to eye movements may underlie the observed differences in interceptive performance.
Introduction
Vision is a major source of information for fast and accurate interceptive movements like catching or hitting a flying ball. By bringing and keeping the image of a moving target on the fovea, eye movements allow gathering salient information on the ball trajectory from high a11111
OPEN ACCESS
Citation:Cesqui B, Mezzetti M, Lacquaniti F, d'Avella A (2015) Gaze Behavior in One-Handed Catching and Its Relation with Interceptive Performance: What the Eyes Can't Tell. PLoS ONE 10(3): e0119445. doi:10.1371/journal.pone.0119445
Academic Editor:Francesco Di Russo, University of Rome, ITALY
Received:April 10, 2014
Accepted:January 30, 2015
Published:March 20, 2015
Copyright:© 2015 Cesqui et al. This is an open access article distributed under the terms of the
Creative Commons Attribution License, which permits unrestricted use, distribution, and reproduction in any medium, provided the original author and source are credited.
Data Availability Statement:All relevant data are within the paper and its Supporting Information files.
acuity vision of its spatial landmarks. Such information is often critical for the control of
inter-ceptive task [1–5]. A growing body of studies indicates that the eyes and the hand can be
guid-ed by common sources of visual information on the properties of the ball trajectory such as speed, angular velocity, distance, rate of expansion, and, if the ball bounces, as in cricket or
ten-nis, the angle of incidence [5–8]. Likewise, the same representation of the object motion is
thought to underlie the control of both effectors [5,6,9]. The picture emerging from these
studies is that targeted eye movements often precede hand movements and subserve their con-trol. It is then unsurprising that the quality of vision can influence ball catching performance. For instance, if vision is disrupted by occlusion of parts of the ball trajectory, catching
perfor-mance deteriorates with increasing duration of the occlusion [10–13]. Because of substantial
sensorimotor processing delays, tracking fast targets is not always possible [14,15] and
correc-tive saccades and peripheral vision are often exploited to overcome this limit and pick up
rele-vant information on the ball trajectory [1,16,17]. Notice that processing of target information
in peripheral vision may be misleading as it alters the perceived speed of the object and can
in-troduce movement biases [18,19]. In fact, several studies have reported decreasing catching
performance with increasing ball speed [20–22].
How vision contributes to the control of the interceptive action is debated [7,8,23,24]. One
possibility is that visual cues about the temporal and spatial characteristics of the target trajec-tory and prior knowledge about the target dynamics allow an accurate extrapolation of its mo-tion. Gaze behavior may reflect the ability to anticipate changes in the visual scene and to predict the future position of the target. Another possibility is that motion execution is updated
continuously based on a combination of optical cues (see [8] for a review), guiding the hand
to-ward target interception (so called prospective control). According to this second view, eye movements may provide a measure of the quality of the visual information and efference copy
used to guide the action [15,25,26]. Several studies have shown that target foveation allows a
continuous monitoring of target speed and direction [27,28], as well as other trajectory
fea-tures [8]. Such information is crucial for the visual control of the hand [7,27,29] and for
ad-justing the initial motor plan on the way toward the catch zone [27,28].
Irrespective of the specific strategy which is hypothesized to underlie target interception, it is often assumed that eye movements are informative of the accuracy of the control processes (whether predictive or prospective), and thus are related to the subject's skill in the interceptive
task [1,3]. In line with this expectation, several experiments investigating oculomotor
strate-gies in different ball sports, such as cricket [3,4,30], baseball [1], juggling [31–33], volleyball
[34], soccer [16], and tennis [35–38], have indeed reported differences in gaze tracking
perfor-mance across subjects of different expertise. For example, Land and McLeod [3] observed that
a key feature of the oculomotor behavior of cricket batsmen is represented by a saccade at the bounce point, which is crucial for the evaluation of the post-bounce trajectory. These authors reported that an expert athlete used the information acquired immediately after ball release to predict the bounce event more accurately and more in advance than an amateur player and a naive player. The expert player was then able to pursue the ball after the bounce longer than the other two players. In another study, professional baseball athletes facing fast ball trajecto-ries kept their eyes on the ball longer and with faster smooth pursuit eye movements than less
expert players [1]. Similar differences in gaze behavior between players with different expertise
were also observed in volleyball [34].
However, whether accurate gaze tracking of the ball throughout its motion is required to perform successful interceptive movements is still controversial. It is worth noting that the ma-jority of the studies on the relationship between ocular pursuit and interceptive performance have related gaze behavior only to the skill level or the expertise of the subjects, whereas the de-pendence of hitting/catching success in individual trials on the quality of eye tracking has not Competing Interests:The authors have declared
been investigated to our knowledge. In fact, there is evidence that ball tracking may vary in
du-ration and quality across subjects of the same skill level [2,34,36,37,39] or, vice versa, the
abil-ity at picking up visual information may not be very different between expert and novice
players [36,40–42]. Moreover, a recent study has shown that several cricket batsmen, taken
from a population of 13 sub-elite players of the same skill level, barely foveated the ball, and yet
succeeded in the task execution [2]. Similarly, it has been shown that interceptive performance
is not impaired if visual acuity is degraded by myopic blur [43]. Others studies reported that
novice players attempted to view the ball constantly throughout its trajectory, in contrast with
expert players [35]. Recently, it has also been observed that the exact targeting of the bounce
point in cricket is not mandatory for the extraction of post-bounce ball flight characteristics, if memory from previous trials or expectation of the physical properties of the ball are also
ex-ploited [4]. In summary, these contrasting results suggest that the role of accurate ball tracking
for successful completion of interceptive tasks needs further investigation.
In the present study, we explored whether keeping the eyes on the ball is crucial for good performance in a one-handed catching task. In particular, we investigated the relationship be-tween the quality of visual tracking and catching success on a trial-by-trial basis. Nine subjects were asked to catch a flying ball projected from a distance of 6 m and arriving at a reachable po-sition without bouncing on the floor. Thus, our task did not require accurate prediction of the
bounce point as observed in cricket or tennis [30,35,36,44]. Different ball flight conditions
specified in terms of flight duration and ball arrival height were obtained by setting different
ball initial velocities with a custom made launching system [45]. This approach allowed testing
ball trajectories which involved different levels of catching and tracking difficulty. In fact, the flight conditions with the highest ball speeds were quite challenging for catching and tracking
[1,22,46]. The quality of ocular pursuit was characterized by means of several timing and
ac-curacy parameters. Moreover, because it has been recently shown that elite cricket batters
cou-ple head rotation to ball movement [30], we also investigated the relative role of the eye and
head contribution to ball tracking. Finally, because our previous study of a similar catching
task had revealed a large inter-individual variability in arm kinematics [20], we wondered
whether such variability could be due to differences in the subject-specific ability at gathering and using salient environmental information sources. Here we expanded and complemented this analysis by also examining whether catching performance was related to different individ-ual gaze tracking behaviors.
Materials and Methods
Participants
Nine right handed subjects (6 males and 3 females, labeled S1to S9), between 22 and 42 years
old (30 ± 6, mean ± SD) participated in the study. Two of them were the first and last author of
the study (S6and S8respectively). All subjects had normal or corrected to normal vision, were
informed about the procedure and the aims of the study, which was approved by the Ethical Review Board of the Santa Lucia Foundation, and gave their written informed consent to par-ticipate to the experiment.
The task and apparatus
The experimental task was similar to the one reported in a previous study [20]. Briefly,
partici-pants were asked to catch a ball projected by means of a dedicated launching apparatus [45]
while standing at a distance d = 6 m (Fig. 1 A). Eight different ball flight conditions obtained
by the combination of four mean flight durations (T1= 0.55 s, T2= 0.65 s, T3= 0.75s, T4= 0.85
were tested. In particular, nominal Z1and Z2were adjusted according to the shoulder height of
the subject (Hsh):Z1=Hsh-0.3m,Z1=Hsh+ 0.3m.
The different ball trajectories resulted from a combination of different initial values of the vertical and horizontal velocities and corresponded to different azimuth and elevation angles
and angular velocities throughout the flight.Fig. 1Bshows elevation angles and angular velocity
traces in each flight condition, illustrating the ideal gaze paths of a stationary catcher tracking
the approaching ball accurately. In the Z1conditions, ball elevation angle first increased and
then decreased. In the Z2conditions, instead, as the ball landed behind the subject, elevation
angle increased throughout the entire flight. Ball speed ranged within the [9–14] m/s interval.
These ranges have already been tested in similar previous studies [21,22] and they have been
found to be demanding for the perceptual-motor system. Vision of the launcher orientation
was impeded by a large big screen in front of the launching machine [45], hence preventing
an-ticipation of the initial ball velocity. Finally, as several sources of random variability affected
the ball acceleration and release in our launching apparatus [45], the initial velocity of the ball
slightly varied across trials in the same T-Z condition. Thus, in our setup the ball arrival height
had a standard deviation of approximately 20 cm [45].
Data acquisition
Prior to the beginning of the experimental session, the launching apparatus was calibrated
ac-cording to a procedure described in a previous report [45]. During the experiment, the eye
pupil position was recorded at 250 Hz using a head-mounted video-based binocular eye tracker (EyeLink II, SR Research, Ltd., Mississauga, Ontario, Canada). The spatial position of several
Fig 1. Experimental apparatus, ball trajectories, and marker placement.(A) Subjects were standing at a distance of 6 m in front of a screen with a hole through which balls were projected by a launching apparatus positioned behind the screen. (B) Ball trajectories in spatial and in gaze coordinates for the different experimental conditions examined in the present study. The different T-Z condition are shown in different colors. Solid thick lines represent the Z2
conditions, thin lines represents Z1conditions. Top Panels: horizontal (x) and vertical (z) spatial coordinates over time of the average ball trajectory for each
block, and the corresponding azimuth and elevation gaze coordinates (rightmost column); the dashed line in the z(t) plot represents the subject eyes height. Bottom Panels: horizontal (x) and vertical (z) spatial velocities of the average ball trajectory for each block, and the corresponding azimuth versus elevation gaze velocities (right most column). (C) Vicon markers placement on the Eyelink helmet. (D) Vicon markers placement on the subject upper trunk.
markers placed on the subject’s body and head, and the position of the ball throughout its en-tire flight were tracked at 100 Hz using a motion capture system (Vicon-612, Vicon Motion
Systems Ltd. UK). Head markers were attached on the EyeLink helmet as reported inFig. 1C:
left front head (LFHD, i.e. M3), left back head (LBHD), right front head (RFHD, i.e. M2), and
right back head (RBHD, i.e. M1). Markers were also positioned on the skin overlying the
epi-condylus lateralis (RELB) and on the right forearm (RFRA) as shown inFig. 1D. The wrist
po-sition (RW) was estimated by averaging the popo-sition of two additional markers (RWRU, RWRR), placed at the extremity of a stick (21 cm) taped on the subject wrist in correspondence to the mid-point between the ulnar styloid and radial styloid processes. In addition, the coordi-nates of the center of the launcher hole and the orientation of the screen were also estimated by
means of three markers placed on the screen surface (Fig. 1A). Markers coordinates were
re-ferred to a right handed calibration frame placed on the floor at 6 m distance from the launch
plane (i.e. theworld coordinate frame), as shown inFig. 1A. A consumer-grade PAL mini-DV
video camera was used to film the subjects during the entire experimental session.
Experimental protocol
For each flight condition subjects performed one block of 10 trials, for a total of 8 blocks. If the ball accidentally touched the ceiling of the laboratory or the boundaries of the exit hole on the screen, the launch was repeated. The order of the blocks was randomized across subjects. Prior to the beginning of each session, a few launches with different initial conditions were carried out for task familiarization. Each trial started with an auditory cue to alert the subject of a new launch. After a time interval randomly varying between 1 and 5 seconds to avoid auditory an-ticipation, the experimenter inserted the ball inside the launching machine and the ball was launched.
Gaze orientation in space was estimated by combining the measurement of eye orientation in the head provided by the eye tracker, and the measurement of head position and orientation in space obtained with the Vicon motion capture system. The detailed description of the
proce-dure is reported elsewhere [47]. Prior to the beginning of the launch session, subjects
per-formed a calibration session required for the extraction of the geometrical parameters of the mapping between the pupil image, as measured by the eye tracker, and gaze coordinates in space. Subjects were asked to gaze at a Vicon marker located on the edge of a stick that was
slowly moved by the experimenter within the subject’s field of view. The procedure was
repeat-ed at the beginning and at the end of the catching experiment. Additionally, to prevent gaze error estimation caused by accidental slippages of the tracker over the subject head, a drift
cor-rection procedure was applied [47]. With the exception of S4and S7, all other subjects
per-formed a drift correction trial at the end of each block, which consisted in fixating a marker located on the bottom border of the exit hole of the launching system (i.e. the REF marker in
Fig. 1A). The recorded data were then used to estimate the slippage, and hence to correct the
geometrical parameters extracted with the initial calibration of the system. In the case of S4and
S7the correction was carried out by assuming that the subjects were looking at the exit hole of
the launching system when the trial started.
Data analysis
Subject's catching performance was evaluated considering the percentage of successful catches. In particular, each trial was classified as caught if the ball was captured by the hand and non-caught otherwise. Kinematic data from the Vicon markers were digitally low-passed filtered (25 Hz cutoff frequency, zero-lag FIR filter) and differentiated to obtain the first- and
several parameters. Ball launch time was defined as the instant at which the ball passed through the screen. Impact time was computed as the instant at which the distance between the ball tra-jectory and the plane passing for the RWRU, RWRR and RFRA markers reached its minimum. Flight duration was defined as the time interval between the launch time and the impact time.
A trial was not included in the analysis if: 1) the subject initiated the movement before the ball was projected in space by the launching system (2.2 ± 1.3, mean ± SD, trials excluded with-in the entire session, averaged across subjects); 2) the position of the markers on the head was too noisy or was not reconstructed by the Vicon system for too many frames to allow the Vicon software to accurately interpolate its trajectory (10.7 ± 4.6 trials); 3) the ball was not re-constructed (2.7 ± 1.4 trials) because it exceeded the tracking volume of the Vicon system (i.e. about 7.5m×3m×3m in our case).
Gaze, eye, and head coordinates
The calibration parameters were used to extract the gaze-in-space orientation angles from the EyeLink-II and the Vicon head markers recordings. In addition, a diagnostic analysis was car-ried out for each trial to assess which drift correction trial between those recorded respectively at the beginning and at the end of each block gave the best reconstruction outcomes. This pro-cedure ensured high accuracy and precision in the estimation of gaze angles throughout the en-tire experiment. In particular, for this experiment the estimation of azimuth and elevation angles had an accuracy of 0.07° on average, always better than 0.39°, and a precision of 0.49° average, and always better than 0.80°.
In the following, we will refer togazeandeyecoordinates as the azimuth (θ) and elevation
(φ) angles expressed: a) with respect to the world coordinate frame centered in the eye (i.e. gaze
coordinates:θandφ); b) with respect to a head-fixed coordinate frame system centered in the
eye (i.e. eye coordinates:θeandφe) [47]. Theheadcoordinates are the azimuth and elevation
angles expressed with respect to the head pose defined while the subject looks straight ahead at a far target at eye height (the primary position) by means of the position of three non-collinear
points on the helmet (i.e head coordinatesθhandφh).
In brief, eye coordinates express the rotation of the eye inside the orbit, head coordinates ex-press the head position and orientation in space, and gaze coordinates take into account the
head position and orientation in space and express the gaze shift with respect to theprimary
position. In particular:
y¼yeþyh; φ¼φeþφh ð1Þ
The position of the ball, tracked with the Vicon motion capture system, was also converted ingaze coordinates(i.e.,θbandφb). These angles represent the ideal gaze orientation that a
catcher would have if he/she was perfectly tracking the ball.
Different filter cut-off frequencies were applied to the EyeLink-II data depending on the specific analysis being performed. For the purpose of extracting calibration and correction pa-rameters for the estimation of gaze orientation in space, pupil coordinates recorded with the EyeLink-II system and positions of the target and head markers collected with the Vicon sys-tem were digitally low-pass filtered respectively at 25 Hz and 15 Hz cutoff frequency (zero-lag
FIR filter) as specified in [47]. For the purpose of the saccade identification and analysis, the
EyeLink-II raw data were filtered with a 50 Hz cutoff frequency. The calibration parameters were used to compute gaze in eye coordinates. Data were then differentiated to obtain the first-and second-order derivatives. Saccades were identified, using the left eye coordinates, based on
a combination of threshold criteria for acceleration and velocity as specified in [48]. Briefly,
the complete saccadic trajectory was determined by finding the peaks and troughs of the eration within the interval in which the threshold criteria was exceeded. If the use of the accel-eration threshold failed to identify a saccade that could be detected by visual inspection, a second pass was made in which a velocity threshold of 30°/s was applied. For each trial we quantified the number of saccades and, for each saccade and for both the azimuth and the
ele-vation angles, several parameters were computed. The saccade amplitude (AS) was defined as
the difference between the final and the initial orientation of the eye. The saccade onset or
la-tency time (LTS) corresponded to the time the saccade was initiated (see above) with respect to
the time of ball launch. Similar to other studies [49], saccades were divided in two groups: the
first saccade was used for the characterization of the initial oculomotor response, while the
re-maining saccades were used to characterize the pursuit phases [15]. Hereafter, we will refer to
the latter group as catch-up saccades. Finally for the purposes of the analysis of gaze tracking features (see below) the EyeLink-II raw data were low pass filtered with a 15Hz cut-off
frequen-cy in accordance to [50]. All analyses were performed on the left eye data.
Gaze tracking features
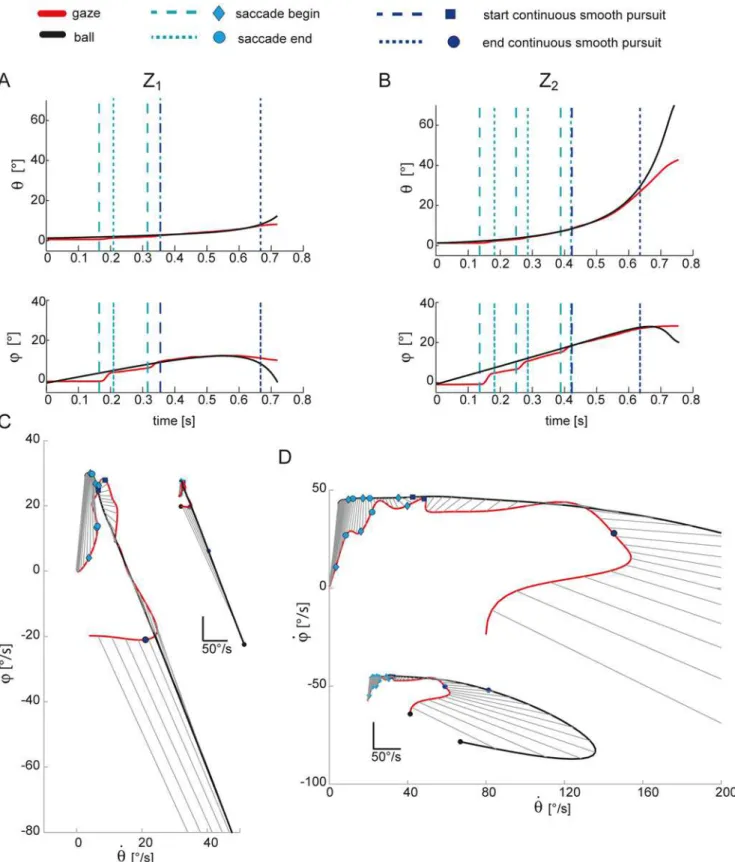
Representative examples of gaze and ball trajectories are reported inFig. 2for one subject (S9).
Panels A and B show the azimuth and the elevation gaze coordinates of the left eye (eye, red
lines) and of the ball (ball, black lines) in the T3condition, for a low Z1(panel A) and a high Z2
(panel B) launch. As in previous studies [3–5,31,51,52], eye movements were characterized
by a combination of smooth pursuit and saccades. Thus, the analysis carried out in the present study aimed at characterizing these two types of eye movements and their synergy during visu-al tracking. To this aim, eye and bvisu-all gaze coordinates were extracted using the cvisu-alibration
pa-rameters as specified in [47], and then differentiated. Pursuit quality was evaluated by means of
accuracy and timing parameters.
Pursuit accuracy parameters quantified the gaze error during tracking. They included:
i. the positional error:
PEðtÞ ¼ k~peðtÞ ~pbðtÞk ð2Þ
where~peðtÞand~pbðtÞare the eye and ball gaze orientation vectors at timet, whose
compo-nents are respectively the horizontal and vertical angles in the (θ,φ) plane.
ii. the saccadic gain (GS), i.e. the actual saccade gaze shift amplitude divided by its desired
value, that is the difference between the ball position (expressed in gaze coordinates) at the end and the beginning of the saccadic movement.
Gs¼
k~peðLTsþMTSÞ ~peðLTsÞk
k~pbðLTsþMTSÞ ~pbðLTsÞk
ð3Þ
Pursuit timing parameters quantified the duration of the different type of pursuit move-ments (i.e. smooth pursuit and catch-up saccades) throughout the ball flight, and were defined as follows:
Fig 2. Representative example of eye and ball gaze position and velocity including saccades.(A) Gaze coordinates of the ball (red lines) and the left eye (black lines) are shown for one trial relative to the T3Z1condition for one subject (S9). Azimuth and elevation trajectories are plotted up to the impact
event; cyan vertical dotted lines bound the saccadic intervals and define the catch-up phase tracking; blue dotted lines bound the interval of CT phase; (B) gaze coordinates of the ball and the left eye in on trial in the T3Z2condition. (C) scatter plots of the gaze speed in azimuth against gaze speed in elevation for
with respect to the target motion [15]. They are likely to be present at pursuit initiation [53]. Once the oculomotor system anticipates target motion by predicting its next state, the posi-tional error decreases and hence the probability of observing a catch-up saccade become very low. Thus, the faster subjects are at predicting the current ball motion, the shorter the
CUS phase is [15]. We also evaluated the normalized value of the CUS duration, CUSn,
ob-tained by dividing the duration of the CUS phase by the ball flight duration.
ii. The duration of continuous tracking (CT) phase, i.e. the pursuit time interval in which catch-up saccade generation is inhibited and the ball is foveated continuously. As shown in
Fig. 2the typical eye movement patterns observed in this task include an initial CUS phase in which subjects tracked the ball with a combination of pursuit and catch-up saccade movements, followed by a continuous tracking up to a point where the ball was no longer pursued (no-tracking-phase, NT). Thus, the CT duration was computed by considering the time interval from the end of the CUS up to the last sample in the gaze trajectories before
ball impact in which PE<3°. The dark blue dashed lines inFig. 2(top and middle rows)
bound this interval.
iii. The total duration of smooth pursuit (SP), i.e. the duration of the intervals within the CUS and CT intervals in which the target was foveated. Here we assumed that subjects could
have followed the ball with an eccentricity of a few degrees to the fovea [15,25]. Thus, the
SP duration was computed eliminating the saccadic movements from the eye movement patterns and then considering the number of samples (i.e. the time interval) in which PE<3°.
Two additional parameters were used to assess the quality of ball tracking: tracking gain (Gain) and delay (TAU). Tracking gain is often used in behavioral studies of smooth pursuit. Tracking delay quantified the timing accuracy of the pursuit. It is worth noting that the present experiment was carried out in unrestrained head movement conditions. Here, because the
ve-locity of the target was high (Fig. 1) and exceeded the eye velocity saturation threshold (60°/s
[1]), ball tracking was achieved with combined eye and head movements. Thus, the analysis
was carried out on gaze coordinates instead of eye coordinates. These quality parameters were computed as follows:
i. The tracking gain (Gain) was computed as the component of the gaze velocity vector (~ve) in
the direction of the ball velocity vector (~vb, in gaze coordinates):
Gain¼~ve~vb
j~vbj
2 ð4Þ
ii. The time delay (TAU) was defined as the lag of the gaze position with respect to the position
of the ball. To evaluate its value we used the same approach reported in [54]. In particular
for each time samplet, we minimized the error function defined as:
EðtÞ ¼ j~peðtÞ ~pbðt tÞj þ~veðtÞð1 dircosÞ ð5Þ
where dircos is the extent to which the gaze velocity was aligned with the velocity of the ball, Saccadic events are represented by cyan circles (saccade start) and diamond (saccade end); blue square represent the end of the catch-up phase, the magenta circle the end of the smooth pursuit phase, and black circles the impact event.
and it is computed as follows:
dircos¼ ~veðtÞ ~vbðt tÞ
j~veðtÞ ~vbðt tÞj
ð6Þ
We allowedτto vary within [–200, 200] ms range.
The TAU and Gain pursuit parameters were evaluated during the smooth pursuit time intervals.
Head contribution to gaze
Head movements were analyzed to assess their contribution to the gaze tracking across subjects
and experimental conditions. By definition (seeEquation 1), the orientation angles describing
gaze in space are the sum of corresponding head and eye orientation angles [47] and any given
gaze shift amplitude and direction could be obtained by infinite combinations of the two. We wondered whether the different performance levels observed across our subjects in the catching task could be related to different eye-head coordination strategies as suggested in a recent
study of elite cricket players [30]. To this aim, we quantified the fraction of gaze shift due to a
change in head orientation:
DHn
W ¼
Wmaxh gaze Wlaunchh
Wmaxgaze Wlaunch ð7Þ
DHn
φ¼
φmaxh gaze φ launch h
φmaxgaze φlaunch ð8Þ
whereWmaxh gazeandφmaxh gazeare, respectively, the azimuth and the elevation coordinates in
corre-spondence of the maximum gaze excursion (i.e.φmaxgaze), whileWlaunch
h andφ
launch
h are the azimuth
and the elevation coordinates at launch. The closer to 1 is the parameter the higher is its
contri-bution to the gaze. In the case of the eye coordinates,DEn
WandDEφnparameters were computed
according to the same expression substituting head with eye coordinates. It is worth noting
that theDEn
W;φandDH
n
W;φmust sum to 1 according toEquation 1.
Statistical Analysis
A binary response variable Y was used to describe catching success, i.e.Yij= 1 if the i-th subject
caught the ball at the j-th trial,Yij= 0otherwise. The j-th trial was characterized by a specific
flight duration (Tk, k = [1, 2, 3, 4]), ball arrival height (Zh, h = [1, 2]), and repetition number
within each block.
As a first analysis, the association between catching success and experimental conditions (i.e. 4 flight durations and 2 ball arrival heights) was investigated (TEST 1). To this aim, Gener-alized Linear Mixed Models (GLMM) were fitted to allow both fixed (i.e. the T-Z experimental
conditions) and random (i.e. the subjects) effects to be appropriately accounted [55,56]. In
particular, we implemented the following model:
Yij ¼b
0þbTtjþbZzjþ"ijþmi ð9Þ
where
• Yijis a latent response variable, assumed to have a Gaussian distribution, linked to the
expected value of the latent variableE(Yij) is the inverse of the standard normal cumulative
distribution (F) of the response probability:
EðYij Þ ¼
F 1½PðYij¼1Þ ð10Þ
• εijandμiare the error terms, which represent respectively the variability within (εij) and
be-tween subjects (μi).
• tjandzindicate respectively flight duration and ball arrival height of the j-th trial relatively
to the i-th subject; in particulartj= Tk, with k = [1, 2, 3, 4] andzj= Zh, with h = [1, 2]. Use of
tjandzjas categorical variables were also investigated.
A second analysis (TEST 2) was performed to assess the dependence of several pursuit qual-ity parameters on the ball flight characteristics, taking into account differences between indi-vidual subjects. Each of the pursuit parameters was considered the dependent variable in a
Linear Mixed Model (LMM) [57–59] that takes into account both fixed effects (flight duration
and ball arrival height) and random effects (subject). A similar analysis was used in a previous
study [20]. As the assessment of which model fits best such random effects structure is a
deli-cate issue [58,60,61], we report the complete procedure adopted for each parameter in the
Ap-pendix. This analysis allowed testing whether the average values of a parameter varied across subjects and experimental conditions.
We then investigated the relation between catching performance and pursuit quality param-eters. As a first explorative analysis, the following model was evaluated:
Yij ¼b
0þbTtjþbZzjþbvvijþ"ijþmi ð11Þ
where thevijis the specific parameter under consideration. However, due to the collinearity
be-tween the predictorsvij,tijandzijobserved for the majority of the pursuit parameters evaluated
in TEST 2 (see theResultssection), such model could not reliably assess a dependence of the
catching performance on pursuit parameters. Thus, two different models were evaluated (TEST 3 and TEST 4).
We first assessed whether catching performance could be predicted from pursuit quality pa-rameters separately in each T-Z condition (TEST 3). In particular, we wanted to assess both the effect of pursuit quality parameters on the response variable on a trial-by-trial basis, taking into account the different average pursuit parameter of each individual, and the relation between the response variable and the individual average pursuit parameter. Data from all subjects in each experimental condition were fitted using the following Generalized Linear Mixed Model (GLMM):
Yij ¼b
0þbvðvij viÞ þgiðniÞ þ"ijþmi ð12Þ
whereYijis the latent response variable defined above for the i-th subject and for the j-th trial
in the TkZhexperimental condition;vijis the parameter under consideration,viis its average
value over the trials in the TkZhcondition of the i-th subject, andεijandμiare error terms (see
above). For each subject theðvij viÞindependent variable represents the variation of the
pa-rameter from its subject-specific mean in the TkZhexperimental block, and thus it evaluates
the relation between the ocular feature ad the catching response once the individual average
distribution is taken into account; we will refer to this term as thevariationterm. If theβvis
sig-nificant, it means that there are differences in thevijvalue across caught and non-caught trials.
Thev
parameter is related to catching performance; we will refer to this term as thewithin-subject av-erage term. If theγcoefficient is significant it means that the different catching performances of
individual subjects depends on their specific ocular behaviors.
We then further investigated the relation between pursuit quality parameters and catching performance in all experimental conditions after removing the dependence of pursuit parame-ters on T and Z (TEST 4). Data from all subjects and all experimental conditions were fitted
using the following GLMM [62]:
Yij ¼b
0þbvresrijþ"ijþmi ð13Þ
whererijare the residuals of the mixed model linear regression for the specific featurev(TEST
2, see also theAppendix):
rij¼vij ^vij ð14Þ
This approach allows to control the partial effect of the variation ofvijthat affects the
re-sponse variable Y directly. The maximum likelihood estimation was used tofit the mixed
mod-els in accordance to [58].
Finally, we investigated whether improvements in the eye tracking and catching perfor-mance were achieved later in each block (TEST 5), by extending the TEST 1 and TEST 2 analy-ses. In particular, we evaluated whether the inclusion of the trial number inside each block as a predictor ameliorates the LMM and GLMM models fit quality. To this aim, we compared the model structure extrapolated in TEST 1 or in TEST 2 separately for each parameter with a
sec-ond model which included also the trial number parameter (AICntrial). For instance in the case
of TEST 1 we considered the model:
Yij ¼b
0þbTtjþbZzjþbntrialnjþ"ijþmi ð15Þ
where njindicates the trial number of the of the j-th trial relatively to the i-th subject. Similarly
in the case of TEST 2, we added theβntrialnjterm, to the model that was selected for the specific
parameter (seeResultssection). The two models were then compared according to the AIC test
as described in the Appendix. Statistical analyses were performed in the R software environ-ment (R developenviron-ment Core team (2011). R foundation for statistical computing, Vienna.
ISBN:3-900051-07-0 URLhttp://www.Rproject.org) with thelme4package (lme4: Linear
mixed-effects model using S4 classes. R package version 1.0–5http://RAN.R-project.org/
package = lme4). Multiple comparisons of means (i.e. Tukey Contrasts) were also performed withmultcomparepackage.
Results
Catching performance differs across subjects and depends on ball flight
characteristics
The subjects enrolled in the experiment showed broadly varying levels of catching
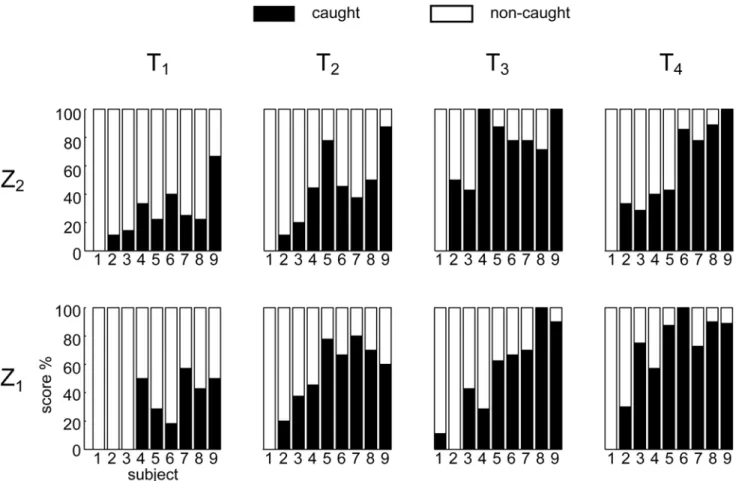
perfor-mance.Fig. 3reports the percentage of caught balls in all the experimental conditions. Subjects
were ordered according to their average success rate (i.e. the total number of the caught balls
divided by total number of launches), from the lowest (i.e. S1, 2% of successful trials) to the
highest values (S9, 80% of successful trials). For all subjects, catching success depended on ball
flight characteristics. The statistical analysis (TEST 1, using GLMM) showed a significant fixed
effect of the flight duration T on the response variable Y (Table 1).
In particular, catching success increased significantly as T increased (T:βT>0, pT<0.01),
given the relation between flight duration and ball approaching speed (Fig. 1, panel B, first col-umn and second row), success rate decreased as speed increased, in accordance with previous
studies [22,46]. Post-hoc tests revealed that there were significant differences in performance
between T1and the other flight duration conditions (p<0.01 for all the comparison), and
be-tween T2and T4conditions. The T1experimental conditions were the most challenging for all
subjects: with the exception of S9, who showed a success rate slightly below 60%, all other
par-ticipants caught less than 40% of the balls (Fig. 3). Tracking the ball in these conditions
re-quired the highest azimuth and high elevation gaze angular velocities. Notably, S1and S2were
unable to catch most of the balls, independently of the speed. In particular S1succeeded only
once throughout the entire experiment, while S2succeeded only in 14 trials.
General characteristics of gaze behavior during catching
All subjects showed a similar sequence of eye movement events. In the first part of the trial, i.e.
30–60% of the total duration, they tracked the ball with a combination of pursuit and catch-up
saccades (CUS phase). Afterwards, they continuously tracked the ball without saccades (CT phase), up to a point before impact in which they no longer tracked the ball (no-tracking, NT
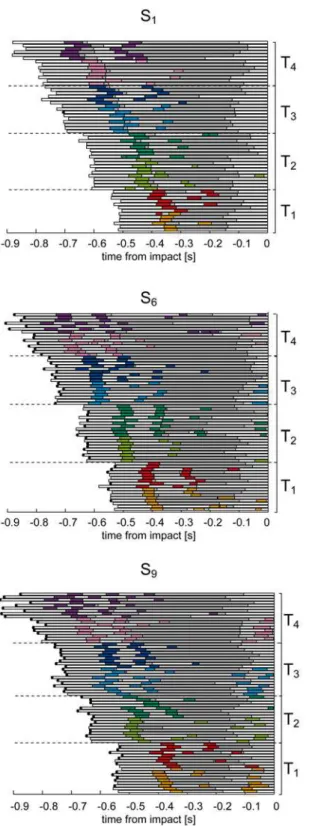
phase).Fig. 4illustrates all the eye movement events recorded in three subjects (S1, S6and S9).
Each row of the raster plots shows the eye movement timeline in one trial of the experimental session, including saccadic events (colored bars, with color identifying different flight
Fig 3. Percentage of caught and non-caught trials in all the experimental T-Z conditions.Subjects are ordered according to their average catching success rate (i.e. the total number of the caught balls divided for total number of launches) from the lowest (i.e. S1) to the highest values (S9).
conditions), foveal vision intervals (gray bars), and periods in which the subject did not track the ball (white bars). No-tracking intervals were distributed throughout the flight, and in par-ticular: (1) at the beginning of each trial, while the subject looked at the exit hole of the launch-ing system; (2) between consecutive catch-up saccades, whenever a positional error
accumulated during pursuit and exceeded the threshold of 3° (seeMethods); (3) at the end of
the trial (NT phase), some instants before impact, when additional information on the ball
mo-tion presumably could no longer influence hand guidance toward the future impact point [11]
due to visual processing and command transmission delays [63]. Occasionally, a saccade was
also triggered at the end of the trial prior to impact (see the raster plot for S9inFig. 4),
particu-larly in the case of low launches. In most cases, subjects re-directed the gaze toward the launch-ing system, while in a few cases they looked the hand at impact.
These representative subjects give an overview of the general characteristics of gaze behavior observed in this experiment. The average (mean ± SE) values of the timing of different eye movement events in all experimental conditions (columns) is reported for each subject (rows)
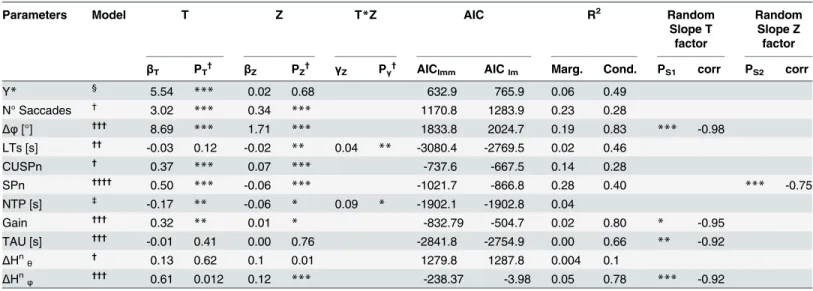
Table 1. Result from fitted Y*response function for TEST 1 analysis (first row), and from the different eye movement parameters (LMM analysis), for TEST 2.
Parameters Model T Z T*Z AIC R2 Random
Slope T factor
Random Slope Z factor
βT PT† βZ PZ† γZ Pγ† AIClmm AIClm Marg. Cond. PS1 corr PS2 corr
Y* § 5.54 *** 0.02 0.68 632.9 765.9 0.06 0.49
N° Saccades †
3.02 *** 0.34 *** 1170.8 1283.9 0.23 0.28
Δφ[°] †††
8.69 *** 1.71 *** 1833.8 2024.7 0.19 0.83 *** -0.98
LTs [s] †† -0.03 0.12 -0.02
** 0.04 ** -3080.4 -2769.5 0.02 0.46
CUSPn †
0.37 *** 0.07 *** -737.6 -667.5 0.14 0.28
SPn ††††
0.50 *** -0.06 *** -1021.7 -866.8 0.28 0.40 *** -0.75
NTP [s] ‡
-0.17 ** -0.06 * 0.09 * -1902.1 -1902.8 0.04
Gain ††† 0.32
** 0.01 * -832.79 -504.7 0.02 0.80 * -0.95
TAU [s] †††
-0.01 0.41 0.00 0.76 -2841.8 -2754.9 0.00 0.66 ** -0.92
ΔHn
θ † 0.13 0.62 0.1 0.01 1279.8 1287.8 0.004 0.1
ΔHnφ ††† 0.61 0.012 0.12 *** -238.37 -3.98 0.05 0.78 *** -0.92
The second column reports the model selected for the specific parameter under analysis (see below for the symbol legend). The subsequent columns report the regression coefficients (β) and p-values (p) of thefixed factors (flight time T, ball arrival height Z) and their interaction term (when significant). The sixth column reports the AIC values computed including the random factor (AIClmm) and without it (AIClm). If AIClmm<AIClmthe inclusion of the
random factor (i.e. subject) is justified, indicating that the particular eye movement parameter varies across subjects. The seventh column reports the marginal and the condition R2coef
ficient of the regression. Finally the two rightmost columns show the significance of the by-subject adjustment of the slope relatively to both the T factor (ps1), and the Z factor (ps2), and the correlation between the two random parameters (intercept and slope for each
factor).
*: p_value<0.05; **: p_value<0.01; ***: p_value<0.001.
§(GLMM)Model type Y
ij*=β0+βTtj+βzzj+εij+μi;
†
(LMM) Model type (LMM) vij=β0+βTtj+βzzj+ S0i+εij;
††(LMM) Model type: v
ij=β0+βTtj+βzzj+γtjzj+ S0i+εij;
†††(LMM) Model type: v
ij=β0+ (βT +Sli)tj +βzzj+ S0i+εij;
††††
(LMM) Model type: vij=β0+βTtj+ (βz +S2i)zj+ S0i+εij;
‡(LM) Model type: v
ij=β0+βTtj+βzzj+γtjzj+εij
Fig 4. Time course of eye movement events for three subjects of different catching skill level.Raster plots of eye movement timeline are shown for all the trials collected during the experimental sessions. Data are aligned to the impact time. Colored bars represent saccades: the different T-Z conditions are color coded as reported inFig. 1. The different time conditions are bounded by the dashed black lines. Gray bars represent the intervals in which the target was foveated (i.e. PE<3°). White bars represent the intervals in which the subject was not tracking the ball. The black dots at the end of each bar indicate caught trials.
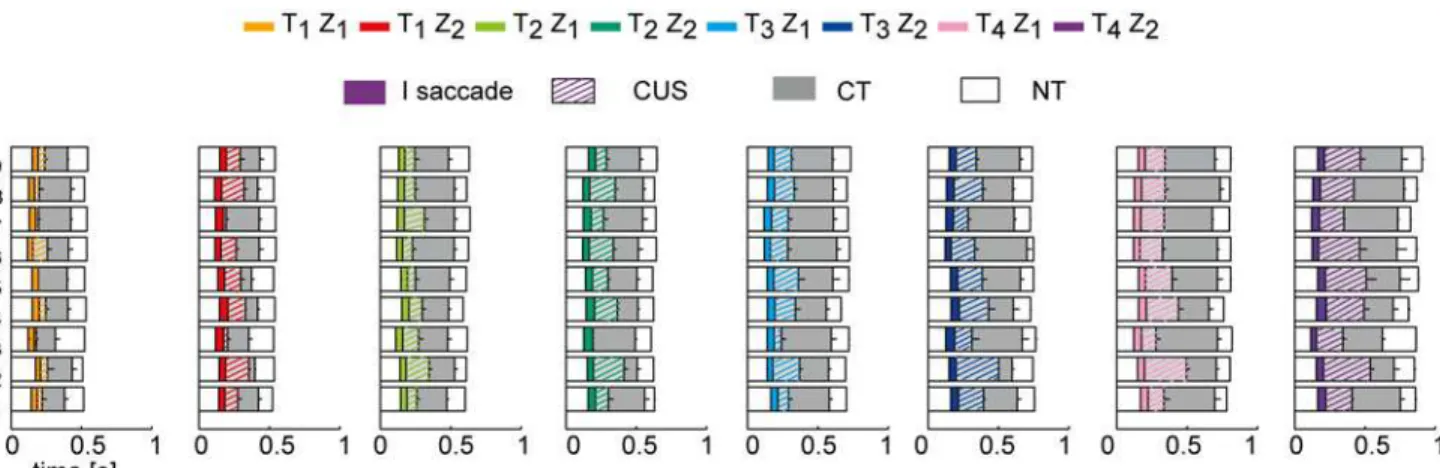
inFig. 5. Overall, we observed both differences and similarities in gaze behavior across subjects. Differences were mainly related to the subject-specific distributions of the pursuit quality and timing parameters, and will be described later in this section. Similarities were found in the modulation of the timing of eye movement events (i.e. the first saccade latency, the beginning and the end of CUS and the CT phases) in relation to the ball trajectory characteristics. For in-stance, in all the subjects as flight duration increased, the duration of the CUS phase (striped
colored bars inFig. 5) and of the CT phase (gray bars) expanded, while the CUS phase was
lon-ger and the CT phase shorter in the Z2conditions than in the Z1conditions. We analyze in
de-tail the dependence of the eye movement parameters on the ball flight conditions in the next subsection.
Gaze behavior depends on ball flight characteristics
Ball flight duration and arrival height affected both the timing and accuracy of ocular pursuit. In our experiment longer ball flights and higher ball arrival heights corresponded also to higher
initial ball elevation velocities, as shown inFig. 6(top row) where the relation between flight
duration and elevation angular velocity at launch is reported. We performed a LMM analysis (TEST 2) to assess the relationship between eye movement parameters and flight conditions. The results of the analysis of the number of saccades, the latency and amplitude of the first sac-cade, the duration of CUS and SP phases, the tracking gain and delay are summarized in
Table 1.
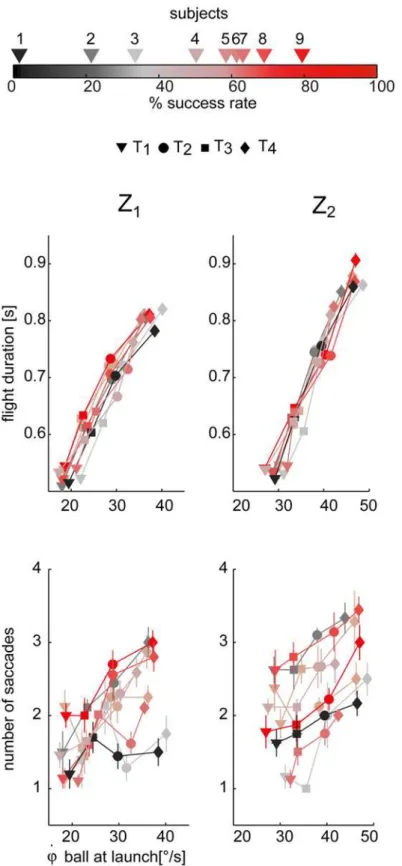
The number of saccades triggered throughout the flight (Fig. 6, bottom panel, data are
illus-trated separately for the two Z conditions) increased with both flight duration and ball arrival height (βT>0,βZ>0, pT<0.01, pZ<0.01). Moreover, during the CUS phase, every single
catch-up saccade reduced the gaze positional error accumulated during pursuit. In this respect,
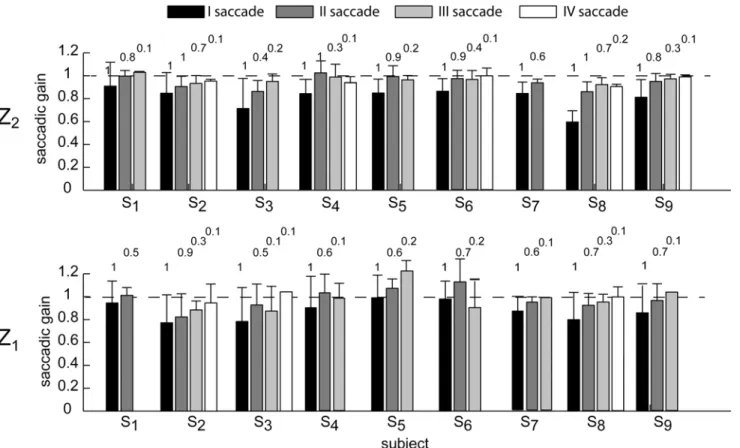
Fig. 7shows the average distribution of the saccadic gain across flight duration conditions for each subject, illustrated separately for the two ball arrival heights. On average, the gain in-creased at each subsequent saccade, being close to 1 at the end of the CUS phase.
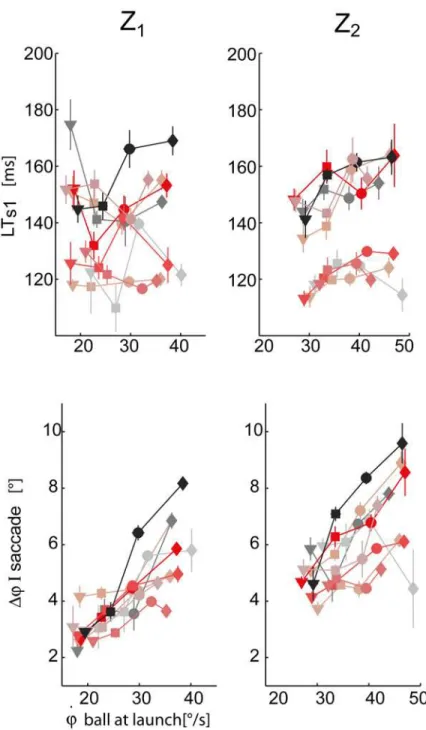
The initial oculomotor response was characterized by the latency time (LTs1) and the
ampli-tude (Δφ) of the first saccade (Fig. 8).
Fig 5. Eye movement event timeline for each subject averaged across trials in all the experimental conditions.Distribution of the eye movement events for each subjects (rows) averaged across trials of each experimental condition (mean±SE; SE represent by the black lines inside the bars). The different T-Z conditions are reported in different columns. Colored bars represent the average duration of the first saccadic movement; striped colored bars represent the average CUS duration. Gray bars represent the average CT duration. White bars at the beginning and at the end of the raster plots represent respectively the latency time LTsand the NT interval.
The interaction term between the T and Z fixed effects was significant (p<0.01) in the case
of LTs1. In fact, depending on the ball arrival height, there was a different dependence of LTs1
on flight duration. For example, in the Z2condition (high) LTs1increased as the ball flight
du-ration increased, while in the Z1condition (low) LTs1showed a more variable behavior (see
Fig. 8top panels). In the case of high launches subjects appeared to initiate pursuit in advance
when facing faster balls (i.e. T1and T2conditions) with respect to slower conditions (i.e. T3
and T4conditions). The amplitude of the first saccade was also modulated by ball flight
condi-tions (Fig. 8bottom panels). Subjects significantly increased the amplitude as flight duration
and ball arrival height increased (βT>0,βZ>0, both significant). In fact, longer and higher
ball trajectories presented also higher initial elevation angular velocities (Fig. 6), which in turn
led to larger initial saccadic movements. For this reason data in Figs8,9, and10are plotted
against the initial ball gaze elevation velocity. Differences across subjects were also observed in the distribution of these parameters. They will be described below in a dedicated subsection.
Pursuit performance was characterized by timing and accuracy parameters (seeMethods).
In order to assess the relationship of the CUS and SP pursuit phases on the ball flight the figure, and it is shaded ranging from black to red depending on subject average score (i.e. the total number of the caught balls total number of launches). Bottom panel: mean number of saccades throughout the trial.
doi:10.1371/journal.pone.0119445.g006
Fig 7. Saccadic gain average distribution across flight duration conditions.The error bar plots show the saccadic gain for respectively the first, the second, the third, and the forth saccade of each subject enrolled in the experiment. Data are averaged across the four flight duration conditions (mean±SE), and are illustrated separately for the Z2(top row) and Z1(bottom row) ball arrival height conditions. Saccades triggered at end of the trial were excluded from
this analysis. The numbers on top of each bar represent the percentage of occurrence of respectively the II, III, and IV saccadic event computed for each subject by pulling together data from the same Z conditions. The first saccade had an occurrence of 100%.
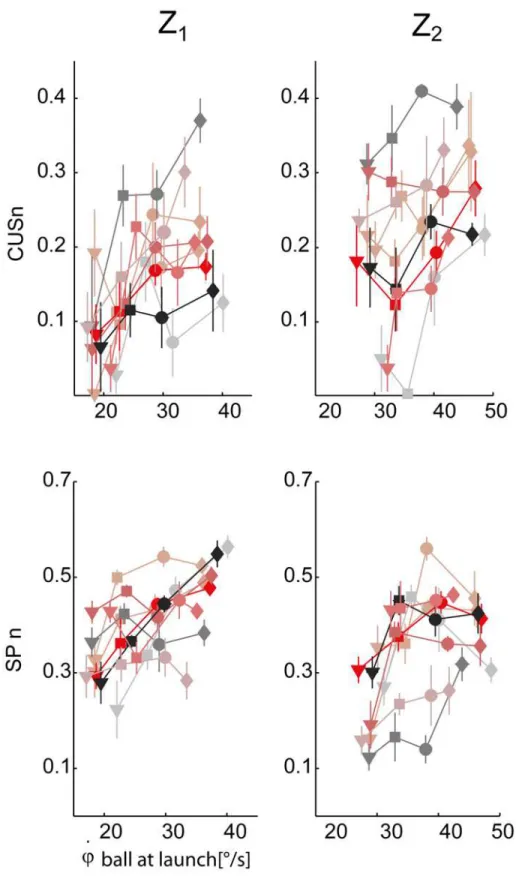
conditions, the statistical analysis (TEST 2) was carried out on their values normalized by the
ball flight duration, i.e. the CUSn and the SPn parameters (seeMethods).Fig. 9shows the
scat-ter plot of the CUSn (top panel) and SPn (middle panels) values averaged across the trials of each experimental condition (block) for each subject. The CUSn parameter significantly in-creased as T and Z values inin-creased (βT>0,βZ>0, pT<0.01, pz<0.01). Post-hoc tests Fig 8. First saccade characteristics.Top panel: first saccade latency times averaged across the different T-Z conditions (mean±SE) are plotted with respect to the initial vertical angular ball velocity at launch. Data are illustrated separately for the two different arrival heights (right column: Z2, left column: Z1). The different
subjects and the four different flight duration conditions are coded as inFig. 6. Bottom panel: amplitude of the first saccade.
Fig 9. Pursuit timing parameters variation across experimental conditions.Top row: catch-up saccade phase normalized durations (CUSn, mean±SE for each TZ condition) are plotted with respect to the initial vertical angular ball velocity values. Data are illustrated separately for the two different arrival heights (right column: Z2, left column: Z1). Bottom row: smooth pursuit normalized duration (SPn). The different subjects
and the four different flight duration conditions are coded as inFig. 6.
revealed significant differences between T1and all the other flight time conditions, and
be-tween T2and T4conditions. The SPn parameter, which assesses the total duration of
continu-ous tracking throughout the entire flight, significantly increased as flight time increased (βT>
0, pT<0.01), but it was lower in the case of Z2conditions with respect to Z1(βZ<0, pz<
0.01). Post-hoc tests revealed that all comparisons were statistically significant, with the
excep-tion of the T2-T3pair. Overall pursuit duration, given by the sum of the CUS and SP, increased
Fig 10. Pursuit accuracy parameters variation across experimental conditions.Top row: smooth pursuit gain parameter averaged for each subject and experimental condition (mean±SE) is plotted with respect to the initial vertical angular ball velocity at launch. Data are illustrated separately for the two different arrival heights (right column: Z2, left column: Z1). Bottom row: the eye-ball positional lag parameter (TAU). The
different subjects and the four different flight duration conditions are coded as inFig. 6.
not only because the flight time duration increased, but also because subjects were able to track the ball for a larger fraction of the its flight interval. The quality of tracking during pursuit was assessed by mean of the Gain and the TAU parameters (average values over the SP duration)
shown inFig. 10.
The pursuit gain changed across the ball flight durations, and, in particular, it increased as T
increased (βT>0, pT<0.01). Post-hoc tests indicated that these differences were mainly
as-cribed to the T1condition which was significantly different from the others. Significant
differ-ences were also observed between low and high launches (pz<0.05). Gain was higher in low
launches than in high launches. Finally, the TAU parameter, i.e. the time lag between the ball
and the gaze, was not influenced by the T and Z factors (pT= 0.41, pZ= 0.76).
In summary, in the longest flight duration conditions, the ball was foveated longer and
more accurately. The T1conditions were the hardest to track, while on average no significant
differences were observed between the T3and T4conditions both in the SPn and CUSn
dura-tions and in the gain parameter. These results, together with the observation that also catching performance increased with longer flight durations (TEST 1), may suggest that there is a direct
relation between the accuracy and the duration of ball tracking and the subject’s performance
in accordance with previous studies [3]. However, both the increase in catching probability
and the increase in smooth pursuit duration may be due to a common dependence on ball
flight duration (and hence ball speed,Fig. 1) and not to a direct relation between the two
vari-ables. To assess the existence of such relationship we considered the dependence on catching performance on pursuit parameters separately in each flight condition (TEST 3) and in all conditions after taking into account the dependence of each parameter on flight conditions (TEST 4).
Gaze behavior in relation to catching performance
To assess the relationship between pursuit parameters and catching performance we first pooled data from all subjects together and we compared the average values of each parameter
over all caught and non-caught trials in each flight condition (Fig. 11).
To determine the significance of the resulting differences, we fitted the dependence of the
response variable Yon both the deviation of the value of each parameter in each individual
trial from its subject-specific average and on the subject-subject average with a GLMM (TEST
3, seeMethods). In fact, differences could be due to variations of the pursuit parameter related
to different catching success probability (i.e. thevariation terminEquation 13) but also to
dif-ferent average values of the parameter in subjects with difdif-ferent average catching performance
(i.e. thewithin-subject average terminequation 13). Differences between score groups (i.e.
caught and non-caught trials) were not significant for CUSn and Gain in all the eight T-Z
ex-perimental conditions (Fig. 11, top panel, leftmost column). Similar results were observed also
for TAU (with the exception of the T2Z2condition). Significant differences between score
groups were observed for SPn in the fastest ball flight conditions. In particular, the normalized duration of smooth pursuit was significantly longer in caught than in non-caught trials in the
two T2conditions and in the T1Z1condition. Then, to assess whether the relation between the
pursuit parameters and the catching performance shown separately on each flight condition (TEST 3) was valid across conditions, after taking into account the subject-specific dependence of each pursuit parameters on the flight conditions, we fitted the dependence of the response
variable Yon the residuals of the regression of the pursuit parameters on the flight conditions
(TEST 4). Thus, we tested the effect of the variation of each pursuit parameter on the response
variable Ybeside its subject-specific dependence on the ball flight characteristics, evaluated
Fig 11. Eye movement parameters averages in caught and non-caught trials.The distribution (mean±SE across subjects) between caught (black bars) and non-caught (white bars) trials, of respectively CUSn, SPn, Gain, TAU and the head contribution parameters (azimuthθand elevationφ) is reported for each T-Z experimental condition. The difference between the two score groups are indicated by the asterisks when present. Significance code:*thevariation termin TEST 3 was significant;†thewithin-subject average termwas significant.
Yas shown by the significant slope coefficient of the GLMM model (β
SP= 5.34, pSP<0.01).
No significant slope coefficients were observed for the rest of the pursuit parameters analyzed in this study.
Overall these results show that catching performance was mainly related to the ability of tracking the ball for a longer time.
Different pursuit strategies across subjects
The analyses described above showed a relationship between some of the pursuit parameters and both ball flight characteristics and catching performance. For example in TEST 2 we re-ported that both the SPn, the CUSn, and the Gain parameters presented higher values in the
case of the slower flight conditions (T3and T4), which were indeed characterized by a larger
number of successful trials with respect to the faster conditions (see TEST 1). Next, we tested whether the relationships between pursuit parameters and ball flight conditions (T and Z) sig-nificantly differed across individuals. For each parameter, we compared a linear model (LM) relating the pursuit parameter to T and Z for all subjects and a linear mixed model (LMM)
in-cluding in addition a subject-specific random effect factor (TEST 2, seeMethodsand
Appen-dix). The models were compared taking into account their complexity with an AIC test: if
AIClmm<AIClm, the inclusion of the random factor was justified providing evidence for
sig-nificant differences in pursuit strategy across subjects. Moreover, depending on the LMM
model selected for the specific pursuit feature under analysis (seeAppendixandTable 1), we
were able to assess the contribution of the random effect to the inter-individual variability. For instance, a subject-specific intercept in the LMM model indicates that the subjects differs on the average value of a specific pursuit parameter while a subject-specific slope indicates a differ-ence in the dependdiffer-ence of a pursuit parameter on a ball flight parameter (T and Z).
Subject-specific eye movement characteristics were present since the beginning of the
pur-suit. Significant differences across the subjects were found in the LTs1parameter (AIClmm<
AIClm,Table 1). For instance S3, S6, S7, and S8showed a shorter LTs1than the other subjects
(Fig. 8, top row), while S1showed a longer LTs1. Inter-individual variability was also observed
in the modulation of the amplitude of the first saccade in the different flight conditions. Such difference was captured by an adjustment of the intercept and of the slope of the T factor
(p<0.01) on an individual basis. In particular, S1showed the highest saccade amplitude range
(Fig. 8, middle panels). This subject fixated the exit hole of the launching system longer and then triggered a large initial saccade arriving almost on the target as shown by the high values
of the saccadic gain for the first saccade inFig. 7(black bar). On the contrary, subjects S8
pre-sented the smallest saccade amplitude range across subjects. Instead of using a single saccadic
displacement, S8triggered a second smaller corrective saccade after the first saccade. In line
with this strategy, the saccadic gain distribution reported inFig. 7showed that, in the case of
S8, the gain of the first saccade was much smaller than the gain of the first saccade of the other
subjects, while the gain of the second saccade was comparable to the gain of the first saccade of the other subjects. This behavior was particularly evident for high ball arrival heights and long flight durations (i.e. T2-Z2, T3, and T4conditions).
The number of saccades triggered throughout the trial differed significantly among subjects (AIClmm<AIClm,Table 1). For instance, S2, S4, S6, S8, and S9presented a larger number of
sac-cadic events with respect to the rest of participants (Fig. 6bottom panel). The opposite trend
was observed in the case of S1who showed the smallest number instead. In the case of S8, this
result was related to the presence of the corrective saccades triggered at the beginning of
pur-suit. In the case of S9and S6in the Z1conditions, it was due to the presence of an additional
and S4the large saccades number was explained by the longer CUS phase duration with respect
to the rest of the participants (Figs.5and9).
Marked difference across subjects were found at the level of the CUSn and the SPn
parame-ters (AIClmm<AIClm,Table 1). However these difference were mainly related to S2, S3, and S4.
In particular, S3and S4presented the opposite behavior with respect to S2, and showed the
smallest CUSn and the highest SPn parameters values (seeFig. 5, bottom panels, andFig. 9).
Notably by repeating the AIC test on a subset of data excluding S2,S3, and S4, we found that
the random factor was not significant anymore in the case of the SPn parameter (AIClmm=
-611.65 and AIClm= -620.81).
Further evidence for inter-individual variability was provided by the analysis of the smooth
pursuit, the Gain, and the TAU parameters (Table 1and Figs.10and12). For instance, S2and
S4presented the worst tracking performance: the average values of the gain during pursuit
were the lowest in all conditions; the TAU parameter, which quantify the eye-ball positional
lag, was the highest. Subject S3and S7, by contrast, tracked the ball with highest pursuit gain
values that in some conditions, i.e. T1Z1, T2Z2and T2Z4, were on average larger than 1,
respec-tively 1.01 ± 0.23, 1.06 ± 0.05, 1.02 ± 0.03. Subject S9presented poor tracking performance in
the T1Z1and T2Z1conditions as shown by the lower average gain values, i.e. 0.7 ± 0.16. These
ranges were comparable with those presented by subjects presenting the worst performance,
i.e. S1, S2and S3, respectively 0.76 ± 0.19 in those experimental conditions (Fig. 10). A
represen-tative example of the general patterns of the tracking gain from all the trials and the subjects in
the T2conditions is reported inFig. 12. Finally, according to the AIC criteria, differences across
subjects were not significant for the NT duration parameter (AIClmm>AIClm,Table 1).
Sub-jects stopped looking at the ball on average 0.12 ± 0.05 s (mean ± SD) before impact.
In summary, we found that the dependence of all the pursuit parameters on the flight condi-tions was different across subjects, indicating the existence of individual pursuit strategies.
Individual gaze tracking behavior in relation to catching performance
We wondered whether the subjects-specific gaze tracking behaviors described in the previous paragraph were also associated to the individual ability at catching the ball. This information
was captured by thewithin-subject average termin TEST 3 (seeMethods). We expected that
subjects with more accurate gaze tracking presented also higher catching success rates, at least for the SPn parameter in accordance to the outcomes from TEST 3 and TEST 4
reported above.
With the exception of the Gain parameter in the T4Z1condition (TEST 3:γ= 13, pγ=
0.025) and the TAU parameter in the T1Z2condition (γ= -31.9, pγ= 0.04), thewithin-subject
average termin TEST 3 was not significant in the case of the all other pursuit features and ball flight conditions evaluated in this analysis. Hence, the results from the present analysis do not support the hypothesis that superior interceptive performance of a subject is due to his/her su-perior visual information.
Effect of practice on catching performance and gaze behavior
As subjects performed blocks of trials with the same ball flight characteristics, we assessed whether the trial number within each block affected the dependence of catching performance and ocular pursuit parameters on flight duration and arrival height. We thus extended the GLMM model of the dependence of the response variable on flight characteristics (TEST 1) and the LMM model of the dependence of ocular pursuit parameters (TEST 2) including the trial number in a block as a fixed effect (TEST 5). The inclusion of the trial number improved
Fig 12. Representative examples of the gain patterns.Data from all the participants and the trials in the T2
practice on catching performance (βntrial= 0.1 and pntrial<0.001). However, repeating the test
on subsets of data including only the fastest (i.e. T1and T2) or the slowest (i.e.T3and T4) ball
flight conditions, we observed that the effect of the trial number was significant only in the fast-est conditions (T1T2: pntrial= 0.006; T3T4:pntrial= 0.246). Interestingly in the case of T1and T2
conditions, the significant trial number effect was due only to the two subjects with the best
performance (i.e. S8and S9). After excluding these subjects the test was not significant anymore
(T1T2:pntrial= 0.11).
Ocular pursuit parameters did not change throughout the block. The inclusion of the trial
number in the LMM models did not improve fit quality (AIC<AICntrial) for all ocular pursuit
parameters with the exception of the tracking gain (Gain: AIC = -832.79, AICntrial= -834.69)
which increased within blocks (βntrial= 0.003, p = 0.04). However, a further analysis revealed
that this effect on the gain parameter was ascribed mainly to S3. After excluding this subject the
test was not significant anymore (Gain: AIC = -758.3, AICntrial= -755.0). Finally, the analysis
was also repeated including only data from the two fastest conditions (T1and T2), i.e. those in
which predictive mechanisms were likely to be predominant with respect to on-line control of
the movement [63]. In fact, one possibility is that in those cases adaptation in the gaze behavior
could have helped improving catching performance (see results of TEST 5 on the GLMM
model relative to the T1and T2conditions reported above). For all parameters except the initial
saccade latency time (LT1s), the inclusion of the trial number did not improve the fit
(AIC<AICntrial). The significant effect for the LT1sparameter (AIC = -1596.8, AICntrial=
-1599.9) was ascribed only to S9. After excluding this subject the test was not
significant anymore.
Eye-head coordination patterns and their relation with catching
performance
As subjects could pursue the flying ball with different combinations of eye and head move-ments, we wondered if they adopted different eye and head coordination patterns and whether differences in eye-head coordination strategies were related to differences in catching
perfor-mances.Fig. 13shows the average head and eye trajectories in the T3Z1(bottom panels) and
T3Z2(top panels) conditions for each subject (mean ± SE across trials). All the participants
ini-tiated pursuit with the head still and they used the first saccadic movement to redirect their gaze on the ball. However, different eye-head coordination patterns were observed across sub-jects and ball flight conditions during the remaining part of the ball flight.
In the case of the elevation coordinateφin the Z1condition (Fig. 13forth row), participants
showed three different behaviors. S1and S4initiated to counter-rotate the eye inside the orbit
(i.e. decreasing the eye elevation angle while the ball elevation angle is increasing) at the end of the first saccade and simultaneously they started to rotate the head towards the ball. This strat-egy required the eye to rotate in the opposite direction with respect to the head to compensate
for a head rotation larger that the gaze shift. In contrast, S5, S8and S9pursued the ball mainly
with the eye and they either maintained the head almost still (S5) or presented very small head
excursions (S8and S9). Finally, S2, S3, S6and S7showed a third type of eye-head coordination
pattern. At the end of the first saccade they pursued the ball mainly with the head and they
maintained the eye at a fixed orientation inside the orbit. In the Z2condition the head
contri-bution to gaze shift was larger than the eye contricontri-bution. With the exception of S3and S4who
and highest gain values, while all other participants presented similar pursuit gain. Notably, tracking accuracy was similar between the least skilled subject (S1) and the best catcher (S9). Moreover, no marked differences
were visible between caught and non-caught trials.
counter-rotated the eye during tracking, and S7who contributed both with the eye and the
head to the gaze tracking, the rest of the subjects maintained the eye at a fixed orientation
in-side the orbit at the end of the CUS phase, and coupled the head to the ball motion (Fig. 13
sec-ond row).
Although less marked than for elevation angles, differences across subjects in the eye-head
coordination patterns were also present for horizontal gaze tracking, i.e.θangle, in the Z1
con-dition (Fig. 13third row). For instance, some subject relied mainly on eye movements to track
the ball, i.e. S1, S2, and S5. The rest of the participants instead tracked the ball with a
combina-tion of the eye and head movements. This latter strategy was adopted by seven of the nine
sub-jects (S3—S9) in the Z2condition (Fig. 13first row), while the remaining two (S1and S2)
showed larger eye movement than head movements as in the Z1condition.
Similar strategies were also observed in the other flight duration conditions. The statistical analysis (TEST 2) carried out to assess the dependence of the fraction of gaze shift due to head
Fig 13. Inter-individual variability in the eye-head coupling.The average (mean±SE across trials) ball (black lines), gaze (red lines), head (blue lines), and eye (gray lines) azimuth (θ) and the elevation (φ) trajectories in the T3conditions are shown for all the subjects enrolled in the experiment. Top rows: Z2
condition; bottom rows; Z1condition. Trajectories are plotted up to the impact event. Dotted lines bound the pursuit interval defined as the time windows
between the end of the first saccadic event and the end of the CT phase. For the purpose of figure clarity we keep out the initial offset of both the eye and head position due to small bias with respect to the primary position defined at calibration (seeMethods).