Identification of landmines in thermal infrared
images
Jorge Leitão Pimenta, [email protected]
Academia Militar, Lisboa Instituto Superior Técnico, Lisboa Abstract - This paper explores the detection of
landmines using thermal images acquired in military context. The conditions in which the images are obtained have a direct influence on the methods used to perform the automatic detection of landmines through image processing techniques.
The proposed methodology follows two main phases: acquisition of thermal images and its processing. In the first phase, four different experiences were prepared to analyze the factors that influence the quality of the detection. In the second phase was conducted the image processing on a set of images based on classification techniques using the K-Nearest Neighbor (KNN) and Support Vector Machine (SVM) algorithms. The classification was performed on a set of features extracted from ROI’s obtained by a sliding window. A second approach was also implemented based on segmentation using thresholds.
The results achieved allow to identify factors that influence the detection of the mines: the burial depth, the presence of vegetation on the surface and the time of the day at which images were obtained.
The optimal classification was obtained with the KNN classifier with 40 features selected with Sequential Backward Selection (SBS), and using the distance metric of correlation.
Keywords: detection, landmine, KNN,
segmentation, SVM
I.
I
NTRODUCTIONhis paper presents a study on the detection of landmines using thermography. The problem of landmine clearance is current, complex and demanding due to a multiplicity of factors to consider at the time of detection. Allied to this complexity, the problem is further compounded by the constant danger of specialized engineers responsible for the landmine’s inactivation and removal. This problem results in human victims, time and money invested in demining. Furthermore, the mines also cause inaccessibility of large areas of fertile land and access that might be used regularly by the local population.
In the last decade many types of technology have been studied in the area of the physics of sensors, signal processing and robotics for the detection of landmines.
II.
B
ACKGROUNDRoughan [1] uses the fusion of two sets of images, each set corresponding to a different infrared spectral range. One range is located between − 5 �� and the other one between − ��. The obtained images allowed the extraction of features based on grayscale statistics and rotationally invariant statistics. Five classification algorithms were applied, two based on a single sensor (one for each spectral range) and three based on fusion techniques. The algorithms based on a single sensor use a threshold based on the best feature extracted in the feature extraction phase. Thus, the difference between the two algorithms that use only one sensor is the resulting threshold of the best feature extracted for each spectral range. The classification algorithms based on fusion techniques are the parzen window, fisher discrimination and logical AND of the thresholds obtained from the two spectral ranges. An improvement in performance was demonstrated by the use of fusion techniques. This approach allows the classification of landmines with 99.998% certainty.
According to Paik et. al. [2] the detection of landmines can be performed through volume effect and surface effect. The volume effect can be obtained through the temperature curve over time, which in the case of landmine presence will be different from the surrounding soil. The surface effect is a disorder in the soil resulting from the burying of a landmine. Thermal images were obtained with a sensor that detects infrared radiation in the spectral range between − 5 ��. The techniques used for the detection of landmines were: filtering, feature extraction, contrast enhancement and segmentation. As filtering is applied morphological contrast enhancement, histogram equalization e Wiener filter (for noise reduction). The next stage is the features extraction using Kitller-Young transformation (KYT). At the segmentation stage is used watershed algorithm, reaching results of approximately 70% for landmine detection and 30% of false alarm.
Padmavathi et. al. [3] considers the ambiguity of target signal due to low contrast as one of the most serious problems in landmine detection applications. The algorithms used for contours detection and noise removal that allow contrast enhancement are Gaussian and Sobel filters, respectively. The signature of a buried landmine in an infrared image depends on external factors such as weather, soil composition, solar radiation, burial depth and time. All of these factors complicate the task of segmenting the pixels of landmines from the remaining
2 pixels in an infrared image. To do the segmentation was applied the H-maxima transformation algorithm. The features of the objects are extracted from segmented regions, helping in the classification of possible landmine targets. This phase improves the accuracy rate of the classifier. The relevant features for landmine identification in infrared images are divided into statistical and structural features. The KNN classification algorithm uses these features in the classification stage, considering one class for landmine presence and other for the background. This classification allowed 100% accuracy on object that effectively were landmines and 0% of false alarm. These results are not as clear as they seem to be, because the original images (256x256 pixels) allowed the detection without processing the regions that effectively were landmines.
The methodology presented by Suganthi et. al. [4] is based in a retro propagation neural network. As neural network inputs are used texture features based on gray level co-occurrence matrix. The processing performed includes contrast enhancement, filtering, segmentation, features extraction and classification. Thus, initially a pre-processing is performed with histogram equalization and Wiener filter to improve the contrast and remove the noise, respectively. If an image smoothing is needed, it can be applied an average filter. After this stage, it is used segmentation to perform the selection of the regions of interest through a region growing algorithm. Then, feature's extraction is applied to segmented regions for further recognition and classification. The features extracted were the contrast, homogeneity, correlation and energy based on Grey Level Co-occurrence Matrix (GLCM). The classification is performed through an Artificial Neural Network (ANN) with retro-propagation using a multilayer perceptron (MLP) topology. This ANN was trained for two classes (mine and background). The results were compared through a quality metric based on the mean square error (MSE). The classification of those segmented regions allows the identification of all landmine targets and 0% detection of false alarm.
Lee [5] presents similar processing techniques to those presented by [2]. However, such processing was applied to four different case studies. The images were obtained with three different sensors. AGEMA sensor detects infrared radiation in the spectral range between − 5 ��, obtaining images with a spatial resolution of 256x256 pixels and 100% of targets detection that actually correspond to landmines. A TICM2 sensor that detects infrared radiation in the spectral range between − ��, obtaining images with a special resolution of 256x256 pixels and 50% detection of landmines installed. Finally, an Amber Galileo LWR sensor that detects infrared radiation in the spectral range between − ��, obtaining images with a special resolution of 222x140 pixels. The latter allowed the identification of all landmines installed, in an experiment that simulated a real situation, with irregularities in the soil and the presence of vegetation.
The goal of this paper is to develop and implement methods for the detection of landmines in thermal imaging based on some of the techniques mentioned above.
III.
M
ETHODSThis section includes some image processing techniques that are used in landmine detection applications. These techniques allow the optimization of landmine detection rate when thermal information is acquired. Initially were acquired thermal images which are crucial for the analysis of the several factors that influence the quality of landmine’s signatures. The data acquisition was possible only after knowing the main factors which influence the thermal imaging in such applications[6],[7],[8].
A) MINEFIELDS’CREATION
The objective on this phase is to create a set of data by performing various experiments such that on one hand will be the medium on which the image processing techniques will be tested and on the other hand, it is possible to perform an analysis of the factors which determine the quality of the resulting thermal images. In order to achieve this goal four experiments in different conditions were designed.
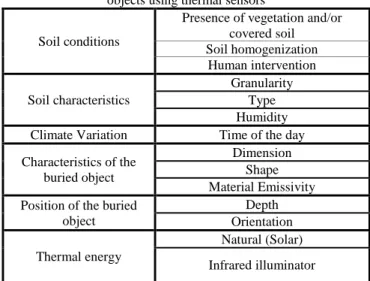
Table 1: Main factors to be considered when detecting buried objects using thermal sensors
Soil conditions
Presence of vegetation and/or covered soil
Soil homogenization Human intervention
Soil characteristics
Granularity Type Humidity
Climate Variation Time of the day
Characteristics of the buried object
Dimension Shape Material Emissivity Position of the buried
object
Depth Orientation
Thermal energy
Natural (Solar)
Infrared illuminator
Four experiments were conducted so as to be able to study some of the factors presented in table 1, with the aim of the use of multiple experiments being to reduce analytical complexity.
The different soils are considered dry as they remained within a room for several days at room temperature (approximately 24ºC). The granularity of each soil type is homogenous, so as to reduce the irregularity of the soil grains. Within each box four objects were placed that, due to their weight and sizes, were to simulate anti-personnel landmines.
The second experiment was conducted in the exterior, in the barracks of the Military Academy in Amadora. The three boxes used in experiment 1, as well as the same types of soil that were placed within each, were also used in this experiment, with two main differences: (i) the boxes had to be filled to the brim to ensure there was no shade inside, as solar movement could affect any results obtained; (ii) exterior insulation was placed next to the sides of the boxes to avoid that any heating of the wooden boxes through solar radiation also heated the soil, which might affect the detection of each buried mine. After researching different options, the thermal insulation used in the insulation of the boxes was an XPS based ROOFMATE, a material which has a thermal conductivity of around 0.034 W/mk [10], and effectively isolates the wooden boards of the boxes from the soil within. The aim of the experiment is to analyse the thermal detection capacity of each object using the same thermal sensor but for different depths.
One of the factors meant to be studied in the third experiment is the capacity of the thermal sensor to observe moved soil resulting from burying a mine. As such, this experiment was conducted using unmoved soil, one that had had no intervention for several months. By doing this, hopefully any alteration would be detected by the thermal sensor. The experiment consisted in using two minefields with varying dimensions and geometries. Field 1 consists of flat sparse vegetation, with four objects being placed on each vertex of a 1.2 by 1.2m square, with one also being placed in the centre. This field was photographed from the base of a structure and at a distance of 1.50m. In field 2 this distance is increased to 6.9m, and only two aligned objects placed 1.20m from each other are used, on soil with high dense vegetation. Images were obtained at 2m, 5m and 9.30m height, so as to be able to compare the detection capacity of the mine signatures for different image resolutions. In field 1 metallic objects and aluminium were used. The size of the square was chosen so that the objects would fit into the corners of the images so as to obtain a first position at height of 2m. Field 2 simulates a minefield of two metallic mines placed on the kerb of a route that has high dense vegetation.
In experiment 4, the minefields were designed to simulate as much as possible now-a-days scenarios. With this in mind, the experiment was elaborated by sappers (personnel specialised in mining and demining) from the Regimento de Engenharia nº1 in Portugal. Four minefields measuring 5x5m and using real mines were created, and the soil used had some vegetation and irregularities, as well as being located in a transition area. These characteristics are meant to enable a study of the capacity of the thermal sensor to detect landmines in different situations that can realistically occur. In each field five mines were installed, with one being placed in each corner and one in the centre of the minefield. Each
mine was buried by the sappers at a depth considered to be realistic.
B) MINE DETECTION
Detection of landmines through thermal infrared images is obtained through the differences in temperature and/or spectral colour between landmine pixels and those of the background. The techniques that are used for this comparison combine algorithms that follow the main phases used in pattern recognition problems solving, and include the extraction of characteristics, classification and segmentation.
1. CHARACTERISTIC EXTRACTION
In this stage characteristics that help identify mine attributes are calculated. These characteristics are calculated in regions contained in superROI’s1, designated ROI’s, which are obtained through a sliding window of varying pixels and sizes. Each ROI is a region of NxN pixels centred on the ROI's respective central pixel. Characteristics extracted are based on the intensity of the pixels and the texture, considered to be first and second order characteristics. First order characteristics are: arithmetic mean, standard deviation, maximum and minimum intensity, median, asymmetry, kurtosis, mode and interval between maximum and minimum intensity. The second order characteristics are based on Gray Level Co-occurrence Matrix (GLCM) [11]. These characteristics are based on the assumption that the textural information of an image is contained in the global spatial relation that greyscales of neighbouring pixels have with each other. Three distances (1, 2 and 3 pixels) from neighbouring pixels were used, as well as four directions (0º, 45º, 90º and 135º). From the co-occurrence matrix correlation, homogeneity, contrast and energy can be calculated.
2. CLASSIFICATION
The problem with classifying mine regions or the background is that it is binary as there are only two classes. To solve this problem, techniques involving supervised classification were used, which consist in allocating each class to a testing sample, so as to be able to determine the parameters of a classifier. K-Nearest Neighbours (KNN) and Support Vector Machine (SVM) were used. The SVM classifies the information through the calculation of the best hyper plane that separates all of the samples of one class from the samples of another class, whilst the K-Nearest Neighbours (KNN) classifier uses all of the testing samples. New samples are classified by choosing the class with the largest number of samples among the K samples closest to those of the testing samples [12].
1
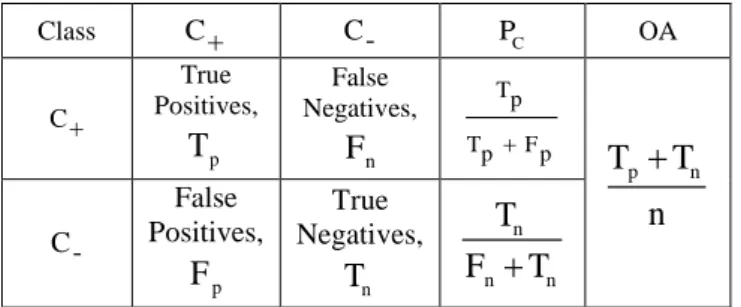
4 The parameters of the learning algorithms are ascertained through cross validation, a statistical technique used to evaluate and compare learning algorithms by dividing the samples into two parts: one that is used to teach or train the model, and one for validation. The most basic form of cross-validation is k-fold cross-validation. In this form, the samples are first divided into k equal (or approximately equal) segments. These training and validation k iterations are done sequentially so that for each iteration a different sample segment is used for validation whilst the remaining k1 are used for training. To be able to compare the efficiency of the models used by the different classifiers a confusion matrix was used which allowed to show the percentage of correct classifications for each class. table 2 shows the structure of the matrix used in binary classification.
According to table 2,
p
T is the number of samples correctly classified in class C and
p
F is the number of samples wrongly classified in class C. T
n is the number
of samples correctly ascertained in class C and F n is the number of samples wrongly ascertained in class C .
P
cis the accuracy of each class, whilst OA refers to the
overall accuracy of both classes (overall accuracy). The value n = T F F T
p n p n.
Table 2: Confusion matrix for binary classification problems.
Class C+ C- PC OA
C+
True Positives,
p
T
False Negatives,
n
F
Tp
TpFp
p n
T
T
n
C-
False Positives,
p
F
True Negatives,
n
T
n n n
T
F
T
There are some SVM classification problems where it is not possible to obtain a linear separation between the classes because of data distribution. For these problems, a class of functions, kernels, is used which allows a problem with a non-linear separation to be separated linearly through a non-linear transformation of samples within a space of larger dimensions. The kernel functions tested were: linear, Radial Basis Function (Gaussian) and polynomial.
When calculating the proximity of the KNN classifier varying metrics are used, of which the Euclidian distance is the most prevalent. However, other distance metrics are used depending on the type of samples that need classifying. Of these alternative metrics, cityblock, correlation and chebychev are according to references [13], [14] and [15] those most worth referring to.
It is also important to mention that the performance of this classifier depends considerably on the value of
k
and the distance metric that is chosen.3. SEGMENTATION
The main objective of segmentation is to divide an image into segments that have similar characteristics and properties [16]. Each pixel in the image is allocated to one of these segments.
The detection of landmines through imaging obtained through thermal infrared is made through analysing the differences in temperature and/or spectral colours between the mine pixels and the background pixels. It is therefore essential to use a segmentation technique that is based on thresholding, and is meant to only identify the regions that correspond to the mines that supposedly have a greater intensity when compared to the background.
As such, and as a solution to the problem that is detecting landmines using thermal infrared imaging, a selection method of thresholds based on greyscale histograms was used. This method aims to find the optimal cut-off point for the global threshold and is based on maximising class variance.
IV.
R
ESULTS AND DISCUSSIONThis chapter analyses the images obtained in the experiments so as to be able to extract conclusions on the factors that influence the quality of thermal infrared imaging. The results of the classification algorithms are also presented, and the performance of the classifiers and the segmentation through mine class accuracy, as a function of the number of characteristics, is also discussed. Furthermore, there is also a study of the best distance metric for the KNN algorithm as a function of the number of characteristics.
A) MINEFIELD CREATION
Four different experiments were conducted with the aim of studying factors that affect mine detection via thermal imaging. The first experiment was conducted in a room where three boxes that had objects simulating three minefields were placed. The second experiment was a replica of the first one with the difference being that it was in the exterior. The third experiment, also conducted in the exterior, aimed to study the effect of the surface using two prepared minefields, whilst in the fourth experiment four minefields were prepared but this time using real mines.
Experiment 1 was conducted in a room with the objective of simulating an exterior situation where there was no direct exposure to sunlight. All of the images were obtained at a height of approximately 2m, and the resolution of the images about 12 pixels per cm2 of terrain. Soil conditions in each box were considered constant throughout the experiment: absence of vegetation, homogenous soil, soil that was disturbed due to the burying process of different objects, and for each object at different depths. In terms of the characteristics of the soil, granularity was constant and the soil considered as dry.
The following figure shows the thermal imaging of one of the fields with the objects on the surface.
Figure 1: Box with organic soil in experiment 1, with objects on the surface (thermal imaging).
figure 1 shows that is not possible to clearly identify the edges of the objects that are on the surface. This means that the absence of relevant natural or artificial thermal vibration leads to poor object identification through its thermal signature.
Experiment 2 is a replica of the previous experiment, except that it is conducted in the exterior. This means that it is subject to natural thermal heating through solar radiation, and images for each depth used were obtained after having been in the required position for 40 minutes.
The use of the ROOFMATE thermal insulation ensured that the soil adjacent to the wooden structure did not overheat.
This experiment followed the same procedures as experiment 1. figure 2 illustrates the thermal imaging for objects at a depth of 1.5 cm. At this depth just the box with sandy soil allows the regions where the objects are buried to be cleared identified.
The soil type influences the obtained results when thermal heating is natural (solar radiation), because the boxes with organic and black soil did lead to the buried objects being identified, unlike what happened with the sand box, as illustrated in figure 2. However, this fact is not only due to the soil type but also its composition. Although all of the soils have an approximately constant granularity, the sandy soil box is the one that has the fragments that are most alike. As well as the similarity between fragment dimensions, it is also important to note that the sandy soil was also the purest as it was solely composed of sand. This contrasts with the other two boxes, in which their sand had small traces of other elements such as small stones and roots, which introduce distortion in the results that are obtained through thermal imaging.
The only object that cannot be identified is the aluminium one, due to its low emissivity. This fact
confirms the relationship between the thermal sensor and the emissivity of the materials it tries to detect.
However, in the upper left hand corner there is a temperature that is much higher than the rest of the box. The overheating in this region camouflaged the mine's heat signature leading to it not being identified. The reason for the overheating in this region is due to the direction of the wind at the time the images were obtained, as the wind was blowing from the bottom right towards the top left, and there were thermal convection transfers from one region to the other.
In experiment 3 the influence of surface vegetation was studied. This experiment was conducted in two distinct locations. The first was in terrain that had low and sparse vegetation, whilst the other had high and dense vegetation. Image resolution was also studied to try to ascertain which is the best resolution for future processing.
figure 3 refers to the first field in experiment 3 in which five elements were placed within the field, four in each corner and one in the centre.
figure 3 shows one of the images obtained in position one, at a vertical distance of 2m and at a horizontal distance of 1.5m, with an approximate resolution of 5 [píxels / cm ] . 2 The images obtained in position 2 were at a vertical distance of 5m and at a horizontal distance of 1.5m, with an approximate resolution of 2 [píxels / cm ] . Lastly, the 2 images obtained in position 3 were at a vertical distance of 9.30m and at a horizontal distance of 1.5m, with an approximate resolution of 1 [píxels / cm ] . These 2 resolutions were obtained by dividing the total number of pixels by the area of the photographed terrain, in cm2. Considering that some anti-personnel mines can reach up to 6 cm2, then for position 3 the thermal images would present heat signatures, if detected, with 6 pixels in an image with a total of 76800 pixels, which is the resolution of images obtained with the thermal camera. Based on this, detection for position 3 based on classification algorithms can be complex.
The images obtained in position 2 and 3 enable object signatures to be clearly identified, however, these zones are, in terms of the number of pixels when compared to the identifying background, far too small, and as such identification through a classifying algorithm can lead to results that do not allow regions to be clearly classified.
The aluminium objects, located in the upper left and upper right corners, appear black in the thermal imaging, indicating that they are at a much lower
Figure 2: Box with sandy soil with objects at a depth of 1.5 cm (Thermal imaging).
6 temperature than the corresponding metallic object. This fact is due to aluminium's low emissivity when compared to the other metallic objects.
Holes were then opened in the same relative position where the objects at the surface had been. This meant to test the capacity of detecting the surface effect. Below is an image obtained from position 2, chosen because of having a lower perspective effect.
Through visual inspection it is possible to clearly identify the places where the holes were opened and the objects placed in. As such, the interior is at a higher temperature than the surface, leading to its detection via the thermal sensor, as the soil has not been moved for a long time.
The area indicated by the arrow is soil that has approximately the same composition as the ones of the holes that show having a higher temperature. This is due to the opening of the holes and the removal of the soil in the same area, leading to local overheating and a thermal variance between soils of similar composition.
The objects were then placed in the holes and covered so as to be buried. They had a lower temperature when compared with parts of the surface that had not human intervention. The thermal difference between this soil and the surface is due to this soil being at a lower temperature than the surface soil. Furthermore, the composition of this soil is slightly different to the surface soil and therefore does not have the same emissivity This means that the regions were the mines were detected by the thermal sensor will be done so differently to that of the surface soil, reinforcing the contrast presented in figure 4
Images of the same fields taken 11 days after were also taken, so as to be able to reach some conclusions as to the effect of the surface. This time period was randomly chosen, however, according to references the influence of the surface is, as a rule, only perceptible between one and two months. From the images obtained of the three positions, only one referring to position 2 is shown.
The images obtained in position 1 and in position 3 do not allow the buried objects to be clearly identified. The image presented above correspond to the best result obtained during this phase. The thermal imaging shows that there are regions that have an apparent higher temperature, pointed to by the black arrows. All of the corresponding targets are visible in the thermal imaging, despite the edges not being clearly defined enough to allow an exact correspondence between the mine heat signatures and the background. This illustrated that the surface effect is detected 11 days after the objects were buried in the soil. However, as time passed these became less perceptible.
The second field aims to analyse the influence of the vegetation. In this phase the objects that are not identified are camouflaged by the vegetation. This result was the same to all three positions, meaning that mines that are camouflaged by high and dense vegetation are not identifiable via infrared thermal imaging.
In a second phase the capacity to detect the effect of the surface for this type of vegetation and for the same relative position than in the previous phase was tested. In this phase, the effect of the surface was also undetectable, leading to the conclusion that in high and dense vegetation surface effect is not identifiable via infrared thermal imaging.
In the fourth experiment four minefields were made to be as close to reality as possible. Each field was 5x5m, and had five mines in each. The terrain used had irregularities, some vegetation and human intervention. figure 6 presents the image of one of the minefields.
It is possible to visually identify in the previous minefield the mine in the centre and the mine in the lower left hand corner and which are indicated by the black arrows. The mine in the centre is on the surface and camouflaged by vegetation. The vegetation used in this camouflage is different to that used in the other regions, and this indicates that this central mine was detected due to its difference in vegetation. The second mine is also at the surface, and it is primarily metallic.
On the other hand, there are zones without vegetation that appear to have much higher temperatures in the thermal imaging than areas with vegetation. This image distortion is another factor that makes buried mine detection harder.
Figure 4: Field 1 photographed from position 2 (thermal imaging).
Figure 5: Field 1 photographed from position 2 (thermal imaging)
Images obtained with an infrared illuminator2 did not present any visual differences, when compared to those without an illuminator. Images were also obtained during two periods of the day (morning and afternoon), and it was during the afternoon that a greater range in temperatures (a bigger difference between maximum and minimum temperatures) was detected. However, due to the higher temperatures during the afternoon, the areas without vegetation had an even higher thermal signature, which overshadowed the mine's already low thermal signatures.
B) PROCEDURE FOR MINE DETECTION
In this section the results of the processing of some of the images obtained during the previously described experiments are presented. From the complete set of images obtained from all the experiments, the ones chosen were those that presented positive visual identification of the objects. This criteria is based on the fact that it is only possible to correctly identify the mine's heat signatures in the thermal imaging by using classification algorithms when these are at least partially visually identifiable.
1. SET OF EXPERIMENT DATA
From all of the images that were obtained, five that enabled mines to be visually identified were chosen. However, the heat signatures of the mines become progressively less clear so as to be able to test the applied algorithms on regions where the heat signature is not so well defined.
All of the thermal images have a dimension of 225x300 pixels. The resolution of these images corresponds to 12 pixels per cm2 of terrain.
Two classes were defined: mine and background. For these five images, nine training set superROI’s were selected, and these had a variable size as the corresponding mine areas were all different. The chosen superROI’s allow both classes to be clearly identified.
From the selected training images, 92 characteristics were calculated for each ROI. Each ROI was obtained using a 8x8 pixels window, sliding 2 pixels per iteration. Consequently, 2292 ROI's from the total superROI’s were selected. The size of the window and the number of pixels for each iteration was chosen based on various tests, and these were the specifications that gave the best results. The size of the window was also chosen according to region size that corresponded to the mine class used.
After obtaining all of the characteristics of the ROI's they were then specifically selected. So as to study the performance of the KNN classifier as a function of the parameter K and the metric used the Sequential Forward Selection (SFS) and Sequential Backward Selection (SBS) was applied. The parameters of the previously referred to learning algorithms were obtained using
2
Infrared illuminator AEGIS SuperLED Infrared has power of 90W.
fold cross-validation. The cross-validation algorithm allows the K parameter and NN classifier to be studied by having a lower value of K (between 1 and 30), which minimises general errors obtained through cross validation.
ROI's with the same parameters as the window used in the training phase were extracted from the test images. As such, and considering the 5 images to be classified, characteristics were obtained from 19200 ROI’s.
2. ANALYSIS OF THE PERFORMANCE OF THE ALGORITHMS
The analysis of the performance of the algorithms is done using confusion matrix, from which the accuracy of the classification obtained from the samples through segmentation/classification algorithms. This accuracy is calculated based on the equations indicated in table 2 from section III.A.2. The average accuracy consists of the average of the five images used during the testing phase of the classifiers.
During a first phase different distance metrics were analysed. The metrics used were: Euclidian, chebychev, correlation and cityblock. The K value of the NN classifier was automatically chosen by selecting the value that minimised the cross validation generalization error.
The maximum number of characteristics selected was defined as 40, as empirically beyond this value accuracy tends to decrease.
The analysis of the performance of mine detection using the KNN classifier and characteristics selected by SFS showed that chebychev distance metric was the one that gave the largest correct number of classifications, and for the five images, had an average accuracy of 85% for two characteristics.
On the other hand, the same analysis was applied to the performance of other metrics as a function of the number of characteristics, but now selected with SBS. Using SBS led to a maximum accuracy of approximately 90% for 40 characteristics with the correlation matrix. An interesting result is related to the accuracy obtained for two characteristics, as with SFS the accuracy for two characteristics was almost always better throughout, but with SBS the precision for two characteristics was the worst. This result suggests that the first order characteristics enable the samples to be better classified than the second order ones. This is because of the array of the obtained characteristics, as the first order characteristics were extracted before the second order ones. Given this, if the second order characteristics allowed the samples to be clearly identified, at least one second order characteristic would be chosen, but this did not happen.
In a second phase, the performance of the SVM classifier for the different kernels was evaluated. The best result was for two results, selected by SFS, with linear kernel giving an accuracy of 87%, compared to using Gaussian kernel with 35 characteristics, which gave a maximum accuracy value of 85%.
8 one that gave the best results, having had an accuracy value of 90%.
In the huge majority of cases both the KNN and the SVM classifiers had an overall accuracy above 90%. This result indicates that the percentage of false alarms to be very low.
The accuracy for two characteristics using SFS was the highest for almost all of the algorithms. In this case the two characteristics were: average pixel intensity, and correlation based on the co-occurrence matrix. The reason for this is that when representing two characteristics in a bi-dimensional space and using a linear function it was possible to separate the samples of two classes with a general low risk of error.
Lastly, the performance of the segmentation algorithm that was based on thresholds was tested.
For each image that was converted to greyscale, a threshold was automatically selected. The average performance for mine detection in the five images was 90.4%.
By comparing the results obtained using classification and segmentation algorithms, the classification algorithms performed slightly better than the segmentation algorithms. Nonetheless, the processing time for classification algorithms is far greater. Despite processing time not being a factor in civilian demining (which this methodology is for), in military demining time taken is one of the most important factors.
V.
C
ONCLUSIONSDemining is a current, complex and demanding problem because of the many factors that have to be taken into consideration during mine detection.
As well as the human toll, time, money invested in demining, mines also restrict access to large areas of terrain that could be used by the local population. It is therefore crucial that new methods are found so as to solve this global problem, both in terms of sensors and processing algorithms.
In this dissertation two areas related to mine detection were studied: thermal imaging obtained from experimental cases and minefields, and image processing based on classification and segmentation techniques. In the former four experiments were conducted, in which mine fields were set up so as to obtain a set of images that would enable the capacity to detect landmines to be studied. Among others, some factors considered in each experiment was mine depth and components, natural or artificial thermal energy, presence/absence of vegetation, and soil type, so as to be able to analyse how each factor influences mine detection in thermal imaging. In the latter, a set of images were processed using classification and segmentation techniques. The classifiers used were KNN and SVM, whilst the segmentation was based on selection of thresholds from greyscale histograms. For the KNN classifier different distance metrics were tested, and different kernels were tested for the SVM classifier, with training and test samples being obtained via the use of a sliding window.
In an initial phase experiments were conducted to confirm the influence of specific factors which, according
to references, are relevant to the quality of visually inspected thermal imaging. These factors are studied so as to better understand signal ambiguities in terms of the mines and the background. This is important because improvements that can be made to image processing are useless if the information (images) that are to be processed cannot allow visual identification. As such, a prior study of the factors that affect the quality of thermal imaging should be done before improvements are made to the image processing techniques that are frequently used to solve the problem tackled within this dissertation, that of landmine detection using infrared imaging.
From the results obtained, it was concluded that without external thermal stimulation, landmine detection is not possible as the corresponding signature is in most cases lower if not equal to the background. Equally important, however, is that the sensor measures thermal imaging as a function of emissivity. Aluminium objects gave weak heat signatures and were practically indistinguishable in the images.
Sandy soil gave better results than either black or organic soil. This is essentially because the sandy soil is more homogenous which gave images with less distortion which in turn enabled better image processing and a better classification of areas which corresponded to mine placements.
Soil influence was another factor studied, and at high environmental temperatures the heat signature emitted by the background is higher than that of the mines, making these more difficult to detect.
On the other hand, for future experiments in this field, it is noteworthy that it is vital the use of thermal insulation in experiments where wooden boxes are used to simulate a minefield. Not using insulation means that adjacent soil will contribute towards it heating excessively, mitigating the mine's heat signature making it impossible to detect.
The effect of moving the surface soil when burying a mine is clearly detected by a thermal sensor, and this feature can be an asset when detecting landmines using thermal imaging. However, when sappers place mines they follow procedures that disturb the terrain as little as possible, and this has a distinct effect on detection. According to references, an average period of two months is recommended for detecting this type of effect, whilst in the conducted experiments a period of 11 days still enabled detection. Given, however, that civilian demining typically occurs a long time after mines are installed; this type of detection becomes considerably more complex.
The presence of vegetation camouflages mine heat signatures, especially of those that are buried, making it so that they cannot be clearly identified. This is further compounded when vegetation is tall and dense. However, even with short vegetation it is common for the heat signature of some landmines to not be detected.
energy in this range is not detected by sensors in the infrared range.
In terms of image processing, segmentation algorithms had a similar performance when compared to the classification algorithms. Forty was found to be the best number of characteristics that produce the best performance when selected by SBS, and using KNN and correlation metric evaluation. In this case, the average accuracy for the five images of 91%. The overall accuracy was also above 90%, which means there were very few false alarms. This low rate of false alarms is an essential characteristic of any landmine detection algorithm.
When using SFS, the classifications obtained for two characteristics were almost always above 80%. These were the sample average and the correlation, obtained using GLCM, allowed both classes to be, with a low general error rate, to be clearly distinguished.
When characteristics of a different order were used, they gave results with higher performances. On the other hand, first order characteristics (statistics) allow mine samples to be classified with greater precision than second order characteristics (texture).
R
EFERENCES[1] D. M. Roughan, "A Comparison of Methods of Data Fusion for Land-Mine Detection," 1997.
[2] J. Paik, C. P. Lee, and M. A. Abidi, "Image Processing-Based Mine Detection Techniques: A Review," The University of Tennessee, Knoxville 2002.
[3] Dr.G.Padmavathi, Dr.P.Subashini, and M. M. Krishnaveni, "A generic Framework for Landmine detection using statistical classifier based on IR images," International Journal on Computer Science and Engineering (IJCSE), vol. 3, 2011.
[4] G. Suganthi and D. R. Korah, "Discrimination of Mine-Like Objects in Infrared Images Using Artificial Neural Network," Indian Journal of applied Research vol. 4, Dec 2014. [5] C. P. Lee, "Mine Detection Techniques Using Multiple
Sensors," Electrical and Computer Engineering, The University of Tennessee at Knoxville, 2000.
[6] R. L. v. Dam, B. Borchers, J. M. H. Hendrickx, and S.-h. Hong, "Controlled field experiments of wind effects on thermal signatures of buried and surface-laid land mines." [7] C. Santulli, "IR Thermography for the Detection of Buried
Objects: A Short Review," Electrical Engineering Department, Università di Roma – La Sapienza, Via Eudossiana 18 00184 Roma, Italy.
[8] R. L. V. Dam, B. Borchers, and J. M. H. Hendrickx, "Strength of landmine signatures under different soil conditions: implications for sensor fusion," Department of Earth and Environmental Science, USA.
[9] Tipos de solos: arenoso, argiloso, árido, orgânico, entre outros. Available: http://www.educacao.cc/ambiental/tipos-de-solos-arenoso-argiloso-arido-organico-entre-outros/ [Acceced in July 18, 2015]
[10] L. Merlin, Placa de isolamento XPS. Available: http://www.leroymerlin.pt/Site/Produtos/Construcao/Isolame nto-da-casa/Solo/15949815.aspx [Accessed in May 12, 2015] [11] B. Pathak and D. Barooah, "Texture Analysis based on the gray-level co-occurence matrix considering possible orientations," International Journal of Advanced Research in Electrical, Electronics and Instrumentation Engineering, vol. 2, September 2013.
[12] P. Horton and K. Nakai, "Better Prediction of Protein Cellular Localization Sites with the k Nearest Neighbors Classifier," American Associatioia for Artificial Intelligence, 1997.
[13] I. Saini, D. Singh, and A. Khosla, "QRS detection using K-Nearest Neighbor algorithm (KNN) and evaluation on standard ECG databases," Journal of Advanced Research, vol. 4, p. 4, 2012.
[14] T. N. Phyu, "Survey of Classification Techniques in Data Mining," Proceedings of the International MultiConference of Engineers and Computer Scientists, vol. 1, p. 730, 2009. [15] A. M. Khan, "Fast Distance Metric Based Data Mining
Techniques Using P-trees," Computer Science, 2001. [16] D. Kaur and Y. Kaur, "Various Image Segmentation
Techniques: A Review," International Journal of Computer Science and Mobile Computing, vol. 3, pp. 809 – 814, 2014.
Jorge Leitão Pimenta was born in