DNA barcoding in Atlantic Forest plants: What is the best marker
for Sapotaceae species identification?
Caio Vinicius Vivas
1, Ramiris César Souza Moraes
1, Anderson Alves-Araújo
2, Marccus Alves
3,
Eduardo Mariano-Neto
4, Cássio van den Berg
5and Fernanda Amato Gaiotto
11
Departamento de Ciências Biológicas, Universidade Estadual de Santa Cruz, Ilhéus, BA, Brazil.
2Departamento de Ciências Agrárias e Biológicas, Universidade Federal do Espírito Santo,
São Mateus, ES, Brazil.
3
Departamento de Botânica, Universidade Federal de Pernambuco, Recife, PE, Brazil.
4Instituto de Biologia, Universidade Federal da Bahia, Salvador, BA, Brazil.
5
Departamento de Ciências Biológicas, Universidade Estadual de Feira de Santana,
Feira de Santana, BA, Brazil.
Abstract
The Atlantic Forest is a phytogeographic domain with a high rate of endemism and large species diversity. The Sapotaceae is a botanical family for which species identification in the Atlantic Forest is difficult. An approach that fa-cilitates species identification in the Sapotaceae is urgently needed because this family includes threatened species and valuable timber species. In this context, DNA barcoding could provide an important tool for identifying species in the Atlantic Forest. In this work, we evaluated four plant barcode markers (matK, rbcL, trnH-psbA and the nuclear ri-bosomal internal transcribed spacer region - ITS) in 80 samples from 26 species of Sapotaceae that occur in the At-lantic Forest. ITS yielded the highest average interspecific distance (0.122), followed bytrnH-psbA (0.019), matK (0.008) andrbcL (0.002). For species discrimination, ITS provided the best results, followed by matK, trnH-psbA and rbcL. Furthermore, the combined analysis of two, three or four markers did not result in higher rates of discrimination than obtained with ITS alone. These results indicate that the ITS region is the best option for molecular identification of Sapotaceae species from the Atlantic Forest.
Keywords: internal transcribed spacer, taxonomy, tree species, tropical forest.
Received: April 29, 2014; Accepted: July 15, 2014.
Introduction
Tropical regions harbor a substantial portion of the worlds biodiversity and some of the most diverse and threatened biomes on the planet. The Atlantic Forest is the second largest tropical forest in South America, with an original coverage of ~1.5 million km2, of which only 11.4-16% remains (Ribeiroet al., 2009). The Atlantic For-est is considered a hotspot of biodiversity (Myers et al., 2000) and it is comprised of highly diverse plants, with 16,146 species recorded, of which 7,524 are endemic (Forzzaet al., 2010). Among the taxa that occur in the At-lantic Forest and have difficulties for species identification stands the Sapotaceae. This family consists of 53 genera and approximately 1,250 species with a pantropical distri-bution, most of which are found in tropical rainforests
(Pen-nington, 1990). Many Sapotaceae species provide econom-ically important products such as latex (used in the produc-tion of chewing gum), wood and fruits for human consump-tion (Pennington, 1990). Several species in this family also provide important resources for the animal biota, such as the golden-headed lion tamarin (Leontopithecus chrysomelas) that relies on some Sapotaceae species for food and shelter (Oliveiraet al., 2010).
The phenomena of supra-annual flowering and vege-tative intraspecific morphological variation mean that flower and fruit analysis is necessary for correct identifica-tion of many Sapotaceae species. However, obtaining spec-imens with intact floral structures is not always possible because of the ephemeral nature of flowers from some spe-cies (Terra-Araujo et al., 2012). Therefore, additional methods,e.g., molecular tools, need to be developed to as-sist in traditional identification. In this context, the DNA barcode, which is the use of short genomic regions that are standardized for quick, accurate species identification (He-bertet al., 2003a), has helped in molecular identification in
Send correspondence to Fernanda Amato Gaiotto. Departamento de Ciências Biológicas, Universidade Estadual de Santa Cruz, Rodovia Jorge Amado, Salobrinho, 45662-900 Ilhéus, BA, Brazil. E-mail: [email protected].
several plant groups. This method is beneficial to ecologists and conservationists by allowing for the identification of samples when the use of traditional methods would be im-possible (Hebert and Gregory, 2005).
A portion of the CO1 gene has been used successfully in the molecular identification of animal species (Hebertet al., 2003b). With regard to plant species, therbcLandmatK markers are recommended as DNA barcodes (CBOL Plant Working Group, 2009). However, these markers do not have good discriminatory power in some taxa (Duet al., 2011; Guoet al., 2011; Zhanget al., 2012); therefore, the use of additional markers, such as the nuclear ribosomal in-ternal transcribed spacer (ITS) andtrnH-psbA, is required. Liet al.(2011) proposed use of the ITS/ITS2 between re-gions that are formally recognized for their applicability in the molecular identification of seed plants, thereby high-lighting the relevance of this marker. The ITS region is a good marker for phylogenetic studies in Sapotaceae (Bartishet al., 2005; Swensonet al., 2007, 2008), and Gon-zalezet al.(2009) indicated that the ITS can be helpful in the identification of species in this family. However, the ef-ficiency of different barcode markers for the molecular identification of Sapotaceae species has not been widely tested.
In this study, we evaluated the efficiency of the plastid markersmatK,rbcLandtrnH-psbAand the nuclear ribosomal ITS region for the identification of Sapotaceae species from the Atlantic Forest.
Materials and Methods
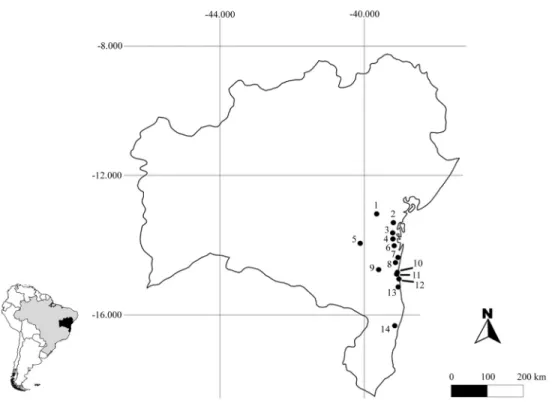
Fourteen Atlantic Forest fragments were sampled in the Brazilian state of Bahia (Figure 1). Eighty individuals representing 26 Sapotaceae species were collected (1-7 samples per species). All of the samples were identified to species level and voucher specimens were deposited in the CEPEC (Herbário do Centro de Pesquisas do Cacau) or ALCB (Herbário Alexandre Leal Costa) Herbaria (Ta-ble S1).
DNA was extracted according to the protocol estab-lished by Doyle and Doyle (1987) using approximately 50 mg of leaf tissue from each sample. Two recommended markers (matKandrbcL) and two suggested markers used as additional barcode markers for land plants (ITS and trnH-psbA) were amplified (Table 1). For PCR amplifica-tion of ITS,matKandrbcLthe reaction mixture consisted of 1x buffer (GoTaq, Promega), dNTPs (0.2 mM), primers (0.5mM each), bovine serum albumin (BSA; 0.1 mg/mL), 1 unit ofTaqDNA polymerase (GoTaq, Promega), DNA (10 ng) and ultra-pure water to a final volume of 20mL. For matK and rbcL, the following PCR program was used: 94 °C for 2 min 30 s followed by 10 cycles at 94 °C for 30 s, 56 °C for 30 s, 72 °C for 30 s and 25 cycles at 88 °C for 30 s, 56 °C for 30 s and 72 °C for 30 s with an additional cycle at 72 °C for 10 min (Elisa Suganuma pers. comm.). For the ITS region, the conditions used were: 95 °C for 5 min, fol-lowed by 35 cycles at 95 °C for 30 s, 50 °C for 30 s and 72 °C for 90 s with an additional cycle at 72 °C for 8 min
Vivaset al. 663
(Bartish et al., 2005). For trnH-psbA amplification, the PCR mix consisted of 1x buffer (GoTaq, Promega), dNTPs (0.2 mM), primers (0.5mM each), BSA (0.375 mg/mL), 1 unit ofTaqDNA polymerase (GoTaq, Promega), DNA (10 ng) and ultra-pure water to a final volume of 15mL. The PCR program consisted of 94 °C for 2.5 min followed by 35 cycles at 94 °C for 30 s, 56 °C for 30 s and 64 °C for 1 min with an additional cycle at 64 °C for 10 min. Samples that showed weak band patterns were amplified using a Top TaqMaster Mix kit (Qiagen) following the manufacturer’s recommendations and using the same amplification pro-grams described above. The PCR products were purified by precipitation with polyethylene glycol (10% PEG 8000, 2.5 M NaCl) and sequenced in both directions using a Big Dye Terminator kit, version 3.1 (Applied Biosystems, Fos-ter City, CA, USA) and an ABI 3130XL automated se-quencer.
The sequences were edited using the Staden package (Stadenet al., 1999) and submitted to GenBank (Table S1). The alignment was done using Muscle (Edgar, 2004) in conjunction with the Mega5 program (Tamuraet al., 2011). All of the sequences were examined visually for possible errors in editing and alignment, and manual adjustments were made when necessary.
The success of the PCR and sequencing was assessed according to Liet al.(2011). Pairwise distances were calcu-lated in Mega5 (Tamura et al., 2011) using the Kimura 2-parameter model (Kimura, 1980) to assess intra- and inter-species differences. We compared the interspecific pairwise divergences between species for single and com-bined analyses with different markers, using permutation procedures for comparison between means with 10,000 permutations. To evaluate species discrimination, the crite-ria “Best Match” and “Best Close Match” implemented in the program TaxonDNA (Meieret al., 2006) and neigh-bor-joining analyses (Saitou and Nei, 1987) were done us-ing sus-ingle or different combinations of regions. Combined analyses were done only for samples in which the four
re-gions were successfully sequenced. Only species for which multiple specimens were sequenced were used for the anal-yses in TaxonDNA and the threshold for “Best Close Match” was calculated for each region (single and com-bined analyses) using the “Pairwise Summary” function. In neighbor-joining (NJ) analyses, the successful discrimina-tion of species was assessed by considering the specific monophyletic groups for species for which multiple speci-mens were sequenced and that showed bootstrap values³ 70%. The NJ analyses were done in Mega5 (Tamuraet al., 2011) using the Kimura 2-parameter model (Kimura, 1980) and pairwise-deletion for indels. Internal support for the branches was calculated using the bootstrap method with 1000 replicates (Felsenstein, 1985).
Results
Seventy-two ITS sequences were obtained for 24 Sapotaceae species, 78matKsequences for 26 species, 80 rbcLsequences for 26 species and 69trnH-psbAsequences for 25 species of Sapotaceae. The primers for these markers displayed high amplification rates for Sapotaceae (Ta-ble 2). In the sequencing reactions,rbcLandmatKgave the best results, followed by ITS andtrnH-psbA. All of the markers produced matrices > 500 bp in size after the se-quences were aligned. Indels were found for ITS,matKand trnH-psbA(Table 2). In the interspecific pairwise compari-sons (single and combined analyses), the ITS region was the most divergent and therbcLregion the least divergent (p < 0.01) (Figure S1 and Table S2). The average inter-specific distance calculated based on the ITS region was 40 times greater than the intraspecific distance. The overlap between intra- and interspecific distances in plastid mark-ers was quite pronounced, whereas in ITS these distances were not pronounced. Figure 2 shows the genetic compari-sons of the intra- and interspecific divergences.
For identification at the species level, the ITS per-formed the best among all of the markers tested (Table 3). ThematK had the second best performance, followed by
Region Primer Sequence 5’–3’ Reference
ITS ITS-18SF1 GAACCTTATCGTTTAGAGGAAGG Rydinet al.(2004)
ITS-26SR1 CCGCCAGATTTTCAGGCTGGGC Rydinet al.(2004) ITS ITS42 TCCTCCGCTTATTGATATGC Whiteet al.(1990)
ITS52 GGAAGTAAAAGTCGTAACAAGG Whiteet al.(1990)
matK 3F_KIM f CGTACAGTACTTTTGTGTTTACGAG KJ Kim, unpublished 1R_KIM r ACCCAGTCCATCTGGAAATCTTGGTTC KJ Kim, unpublished
rbcL rbcLa_f ATGTCACCACAAACAGAGACTAAAGC Kress and Erickson (2007) rbcLaj634R GAAACGGTCTCTCCAACGCAT Fazekaset al.(2008)
trnH- psbA trnHf_05 CGCGCATGGTGGATTCACAATCC Tate and Simpson (2003)
psbA3 f GTTATGCATGAACGTAATGCTC Sanget al.(1997)
trnH-psbAandrbcL. In the combined analyses, none of the combinations outperformed the ITS in single analyses. Com-binations involving ITS showed the same performance, whereas the matK/rbcL combination proposed by CBOL Plant Working Group (2009) performed poorly (Table 3).
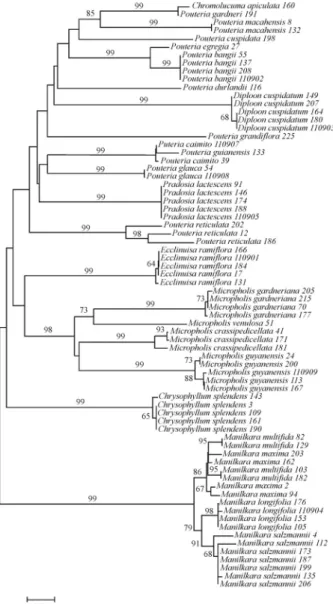
Based on NJ analyses, the ITS identified the follow-ing species: Chrysophyllum splendens, Diploon cuspidatum,Ecclinusa ramiflora,Manilkara longifolia,M. salzmannii, Micropholis crassipedicellata, M. gardneriana,M.guyanensis,Pouteria bangii,P.glauca,P. macahensis,P.reticulataandPradosia lactescens, repre-senting 13 monophyletic groups that were supported by
high bootstrap values (Figure 3). OnlyManilkara maxima, M.multifida,Pouteria caimitoandP.guianensiswere not discriminated using this phylogenetic method (Figure 3). The speciesPouteria cuspidata,P.egreria,P.durlandii,P. grandifloraandMicropholis venulosashowed high levels of divergence and were distinct from other Sapotaceae spe-cies for which multiple specimens were analyzed (Fig-ure 3).
Discussion
The successful discrimination of plant species using the regions proposed for DNA barcoding by CBOL Plant
Vivaset al. 665
Table 2- Evaluation of four genomic markers for the molecular identification of Sapotaceae species.
Marker
Parameter ITS matK rbcL trnH-psbA
PCR success 97.5% 98.8% 100% 100%
Sequencing success 92.3% 98.7% 100% 86.3%
Aligned sequence length (bp) 687 789 586 691
Indels 1-33 bp 6 bp 0 1-156 bp
Number of variable sites 321 41 13 61
Mean intraspecific K2P distance (range) 0.003 (0 to 0.038) 0.0004 (0 to 0.003) 0.0005 (0 to 0.007) 0.001 (0 to 0.008) Mean interspecific K2P distance (range) 0.122 (0.005 to 0.174) 0.008 (0 to 0.019) 0.002 (0 to 0.009) 0.019 (0 to 0.047)
DNA
barcoding
in
Sapotaceae
species
bor-joiningA(%)
Correct Ambiguous Incorrect Correct Ambiguous Incorrect No match Threshold
Single analyses
ITS 81.3 (13/16) 100 (64/64) 0 0 95.3 (61/64) 0 0 4.7 (3/64) 1.09
matK 23.5 (4/17) 47.8 (33/69) 52.2 (36/69) 0 47.8 (33/69) 52.2 (36/69) 0 0 0.25
rbcL 0 (0/17) 36.6 (26/71) 63.4 (45/71) 0 36.6 (26/71) 63.4 (45/71) 0 0 0.51
trnH-psbA 21.4 (3/14) 41.4 (24/58) 48.3 (28/58) 10.3 (6/58) 41.4 (24/58) 46.6 (27/58) 10.3 (6/58) 1.7 (1/58) 0.58
Combined analyses
ITS+matK 78.6 (11/14) 100 (56/56) 0 0 94.6 (53/56) 0 0 5.4 (3/56) 0.65
ITS+rbcL 78.6 (11/14) 100 (56/56) 0 0 94.6 (53/56) 0 0 5.4 (3/56) 0.76
ITS+trnH-psbA 78.6 (11/14) 100 (56/56) 0 0 94.6 (53/56) 0 0 5.4 (3/56) 0.80
matK+rbcL 28.6 (4/14) 51.8 (29/56) 48.2 (27/56) 0 50 (28/56) 46.4 (26/56) 0 3.6 (2/56) 0.14
matK+trnH-psbA 35.7 (5/14) 55.4 (31/56) 37.5 (21/56) 7.1 (4/56) 55.4 (31/56) 35.7 (20/56) 7.1 (4/56) 1.8 (1/56) 0.23
rbcL+trnH-psbA 21.4 (3/14) 58.9 (33/56) 37.5 (21/56) 3.6 (2/56) 57.1 (32/56) 35.7 (20/56) 3.6 (2/56) 3.6 (2/56) 0.27
ITS+matK+rbcL 78.6 (11/14) 100 (56/56) 0 0 94.6 (53/56) 0 0 5.4 (3/56) 0.45
ITS+matK+trnH-psbA 78.6 (11/14) 100 (56/56) 0 0 94.6 (53/56) 0 0 5.4 (3/56) 0.47
ITS+rbcL +trnH-psbA 78.6 (11/14) 100 (56/56) 0 0 94.6 (53/56) 0 0 5.4 (3/56) 0.52
matK+rbcL+trnH-psbA 28.6 (4/14) 57.1 (32/56) 39.3 (22/56) 3.6 (2/56) 53.5 (30/56) 39.3 (22/56) 3.6 (2/56) 3.6 (2/56) 0.16
ITS+matK+rbcL+trnH-psbA 78.6 (11/14) 100 (56/56) 0 0 94.6 (53/56) 0 0 5.4 (3/56) 0.36
AMonophyletic groups for species with multiple specimens sequenced using bootstrap values
³70%. Values in parentheses indicate the number of species identified using neighbor-joining analyses.BValues in
Working Group (2009) may vary in plants (Hollingsworth et al., 2009; Newmaster and Ragupathy, 2009; Zhanget al., 2012). Depending on the taxon in question, the use of addi-tional markers may be needed for discrimination (CBOL Plant Working Group, 2009). This is particularly relevant to the Sapotaceae, in which the plastid markers do not have particularly good resolution. Despite having a lower perfor-mance thanmatKandrbcLin sequencing reactions, the ITS showed high specific resolution.
Desirable features for DNA barcoding include the universality of primers, success in sequencing, and species discrimination (Kresset al., 2005; CBOL Plant Working Group, 2009; Hollingsworthet al., 2011). In this work, all of the tested markers showed high rates of amplification. With regard to the sequences obtained, therbcLmarker was the most effective, supporting the findings of Renet al. (2010) and Gu et al. (2011). This result was closely
matched bymatK, which failed in only one sample. Impor-tantly, we observed that the lower performance of trnH-psbAcompared to the other markers resulted from the difficulty in sequencing this marker in Sapotaceae, proba-bly because of the presence of mononucleotide repeats (> 10 bp) that undermined the sequencing reactions. Deveyet al.(2009) reported the occurrence of these repeats in many species and demonstrated how these microsatellites inter-fere in obtaining high quality sequences, exactly as ob-served here. For ITS, the success rate for sequencing was reasonable but lower than for thematKandrbcLmarkers. However, the ITS was highly discriminatory and useful for the molecular identification of Sapotaceae species.
The most desirable characteristic of DNA barcoding is successful species discrimination. Based on this crite-rion, the ITS was useful in the Sapotaceae because of its high interspecific distances and low values in intraspecific comparisons. In addition, the ITS region showed little over-lap between the intra- and interspecific Kimura 2-para-meter distances, culminating in high specific resolution. NJ analyses showed that only four species (M. maxima, M. multifida, P. caimitoandP. guianensis) were not identified using ITS-derived data. This result suggests recent diver-gence beyond retaining ancestral polymorphisms for the ITS in original populations and may limit its usefulness for species identification in these cases. In addition, low rates of divergence may be observed in some groups of tree spe-cies because of the long generation time, resulting in lower rates of mutation (Kayet al., 2006).
Manilkara salzmanniishowed great phenotypic plas-ticity in vegetative characters despite high values of intra-specific divergence. The high values of intraintra-specific diver-gence observed in P. reticulata, coupled with the large phenotypic plasticity of its vegetative characters, suggests that this group may represent a complex of species, but this hypothesis requires further studies. The species Chromolucuma apiculataandPouteria gardneri(both sus-tained based on morphological characters) showed very low divergence (0.5%), indicating that they may belong to the same genus; this could reflect homoplasy in the mor-phological characters used to delimit the genus Chromolucuma.
In a preliminary analysis of a portion of the ITS re-gion, Yoccoz et al.(2012) reported that this region was more efficient in discriminating Sapotaceae species than plastid markers. Furthermore, Gonzalezet al.(2009) indi-cated the potential of ITS for molecular identification of Sapotaceae species in the Amazon region. Our results cor-roborate those of Renet al.(2010) forAlnusspp., Yanet al. (2011) for Primula spp., Guo et al. (2011) for Hedyotis spp., and Duet al.(2011) for Potamogetonaceae. In these studies, the ITS region showed good discrimination of spe-cies. For example, Singhet al.(2012) reported a specific resolution of 100% using samples of the genus
Dendro-Vivaset al. 667
bium, indicating that in some cases this region alone is suf-ficient for the molecular identification of plant species.
The plastid markerstrnH-psbA,matKandrbcLhad a weaker performance compared with ITS alone, with low interspecific distances, and overlaps with intraspecific distances (Figure 2). For example, inManilkara, no spe-cies were identified with these markers. The low success in identifying species using plastid markers limits their usefulness for molecular identification in Sapotaceae. This result can be explained by the low mutation rate ob-served for this genome compared with the nuclear genome (Wolfeet al., 1987). In the combined analyses, the combi-nation proposed by CBOL (matK+rbcL) performed poorly as a plant barcode, as did other combinations that did not include the ITS. Combined analyses using ITS worked successfully but were never superior to the indi-vidual ITS analyses. This finding further strengthens the potential usefulness of ITS by itself as a plant barcode for future work with Sapotaceae.
Taxonomic status is an essential consideration in adopting the appropriate conservation strategies and man-agement plan for a given species. The use of the ITS by it-self for the molecular identification of Sapotaceae species provides new opportunities for studies involving species of this family, with the possibility of easier and faster identifi-cation from sterile material. In view of estimates that > 50% of the species in this family are not yet known to science (Joppaet al., 2010), this technique may help troubleshoot specific taxonomic problems and be useful in the initial screening of potential new species for further taxonomic characterization. Based on the results of this study, we sug-gest the ITS region as the best option for the molecular identification of Sapotaceae species in the Atlantic Forest, and highlight the potential of this marker for the identifica-tion of other species of this family. The use of an integrated taxonomic approach for studying the Sapotaceae should help uncover the hidden diversity in this family.
Acknowledgments
We thank José Lima da Paixão, Dr. Roberto Tarazi, Veracel Celulose S.A., Reserva Ecológica da Michelin, Instituto de Estudos Sócio-Ambientais do Sul da Bahia (IESB) and Secretaria do Meio Ambiente de Ilhéus-BA for support in the field. We thank Dary Rigueira MSc and Marília Mascarenhas MSc for providing samples, Dr. Elisa Suganuma for tips on obtaining plastid sequences, Dr. Leandro L. Loguercio for suggestions on the manuscript, the Instituto Chico Mendes de Biodiversidade (ICMBIO) and Instituto do Meio Ambiente e Recursos Hídricos da Bahia (INEMA) for providing collection authorizations, UESC (grant PROPP#00220.1100.876) and FAPESB (grant PNX0014/2009) for financing the project, and CNPq, FAPESB and CAPES for the scholarships granted to FAG, CB, RCSM and CVV.
References
Bartish IV, Swenson U, Munzinger J and Anderberg AA (2005) Phylogenetic relationships among New Caledonian Sapo-taceae (Ericales): Molecular evidence for generic polyphyly and repeated dispersal. Am J Bot 92:667-673.
CBOL Plant Working Group (2009) A DNA barcode for land plants. Proc Natl Acad Sci USA 106:12794-12797. Devey DS, Chase MW and Clarkson JJ (2009) A stuttering start to
plant DNA barcoding: Microsatellites present a previously overlooked problem in non-coding plastid regions. Taxon 58:7-15.
Doyle JJ and Doyle JL (1987) A rapid DNA isolation procedure for small amounts of fresh leaf tissue. Phytochem Bull 19:11-15.
Du ZY, Qimike A, Yang CF, Chen JM and Wang QF (2011) Testing four barcoding markers for species identification of Potamogetonaceae. J Syst Evol 49:246-251.
Edgar RC (2004) Muscle: Multiple sequence alignment with high accuracy and high throughput. Nucleic Acids Res 32:1792-1797.
Fazekas AJ, Burgess KS, Kesanakurti PR, Graham SW, Newmaster SG, Husband BC, Percy DM, Hajibabaei M and Barrett SCH (2008) Multiple multilocus DNA barcodes from the plastid genome discriminate plant species equally well. PLoS One 3:e2802.
Felsenstein J (1985) Confidence limits on phylogenies: An ap-proach using the bootstrap. Evolution 39:783-791. Forzza RC, Baumgratz JFA, Bicudo CEM, Canhos DAL,
Car-valho Jr AA, Costa A, Costa DP, Hopkins M, Leitman PM, Lohmann LG,et al.(2010) Síntese da diversidade brasileira. In: Forzza RC, Baumgratz JFA, Bicudo CEM, Carvalho Jr AA, Costa A, Costa DP, Hopkins M, Leitman PM, Lohmann LG, Maia LC,et al.(eds) Catálogo de Plantas e Fungos do Brasil. Vol. 1. Instituto de Pesquisas Jardim Botânico do Rio de Janeiro, Rio de Janeiro, pp 21-42.
Gonzalez MA, Baraloto C, Engel J, Mori SA, Pétronelli P, Riéra B, Roger A, Thébaud C and Chave J (2009) Identification of Amazonian trees with DNA barcodes. PLoS One 4:e7483. Gu J, Su JX, Lin RZ, Li RQ and Xiao PG (2011) Testing four
pro-posed barcoding markers for the identification of species withinLigustrumL. (Oleaceae). J Syst Evol 49:213-224. Guo X, Simmons MP, But PPH, Shaw PC and Wang RJ (2011)
Application of DNA barcodes in Hedyotis L.
(Spermacoceae, Rubiaceae). J Syst Evol 49:203-212. Hebert PDN and Gregory TR (2005) The promise of DNA
barcoding for taxonomy. Syst Biol 54:852-859.
Hebert PDN, Cywinska A, Ball SL and deWaard JR (2003a) Bio-logical identifications through DNA barcodes. Phil Trans R Soc Lond B Biol Sci 270:313-321.
Hebert PDN, Ratnasingham S and deWaard JR (2003b) Barcoding animal life: Cytochrome c oxidase subunit 1 di-vergences among closely related species. Phil Trans R Soc Lond B Biol Sci 270:96-99.
Hollingsworth ML, Andra Clark A, Forrest LL, Richardson J, Pennington RT, Long DG, Cowan R, Chase MW, Gaudeul M and Hollingsworth PM (2009) Selecting barcoding loci for plants: Evaluation of seven candidate loci with spe-cies-level sampling in three divergent groups of land plants. Mol Ecol Resour 9:439-457.
Joppa LN, Roberts DL and Pimm SL (2010) How many species of flowering plants are there? Phil Trans R Soc Lond B Biol Sci 278:554-559.
Kay KM, Whittall JB and Hodges SA (2006) A survey of nuclear ribosomal internal transcribed spacer substitution rates across angiosperms: An approximate molecular clock with life history effects. BMC Evol Biol 6:e36.
Kimura M (1980) A simple method for estimating evolutionary rate of base substitutions through comparative studies of nu-cleotide sequences. J Mol Evol 15:111-120.
Kress WJ and Erickson DL (2007) A two-locus global DNA barcode for land plants: The codingrbcLgene complements the non-codingtrnH-psbAspacer region. PLoS One 2:e508. Kress JW, Wurdack KJ, Zimmer EA, Weigt LA and Janzen DH
(2005) Use of DNA barcodes to identify flowering plants. Proc Natl Acad Sci USA 102:8369-8374.
Li DZ, Gao LM, Li HT, Wang H, Ge XJ, Liu JQ, Chen ZD, Zhou SL, Chen S, Yang JB,et al.(2011) Comparative analysis of a large dataset indicates that internal transcribed spacer (ITS) should be incorporated into the core barcode for seed plants. Proc Natl Acad Sci USA 108:19641-19646. Meier R, Shiyang K, Vaidya G and Ng PKL (2006) DNA
barc-oding and taxonomy in Diptera: A tale of high intraspecific variability and low identification success. Syst Biol 55:715-728.
Myers N, Mittermeier RA, Mittermeier CG, da Fonseca GAB and Kent J (2000) Biodiversity hotspots for conservation priori-ties. Nature 403:853-858.
Newmaster SG and Ragupathy S (2009) Testing plant barcoding
in a sister species complex of pantropical Acacia
(Mimosoideae, Fabaceae). Mol Ecol Resour 9(s1):172-180. Oliveira LC, Hankerson SJ, Dietz JM and Raboy BE (2010) Key
tree species for the golden-headed lion tamarin and implica-tions for shade-cocoa management in southern Bahia, Brazil. Anim Conserv 13:60-70.
Pennington TD (1990) Sapotaceae. Flora Neotropica Monograph 52. New York Botanical Garden Press, New York, 770 pp. Ren BQ, Xiang XG and Chen ZD (2010) Species identification of
Alnus(Betulaceae) using nrDNA and cpDNA genetic mark-ers. Mol Ecol Resour 10:594-605.
Ribeiro MC, Metzger JP, Martensen AC, Ponzoni FJ and Hirota MM (2009) The Brazilian Atlantic Forest: How much is left, and how is the remaining forest distributed? Implications for conservation. Biol Conserv 142:1141-1153.
Rydin C, Pedersen KR and Friis EM (2004) On the evolutionary history ofEphedra: Cretaceous fossils and extant molecules. Proc Natl Acad Sci USA 101:16571-16576.
Saitou N and Nei M (1987) The neighbor-joining method: A new method for reconstructing evolutionary trees. Mol Biol Evol 4:406-425.
Sang T, Crawford DJ and Stuessy TF (1997) Chloroplast phylog-eny, reticulate evolution, and biogeography of Paeonia
(Paeoniaceae). Am J Bot 84:1120-1136.
Singh HK, Parveen I, Raghuvanshi S and Babbar SB (2012) The loci recommended as universal barcodes for plants on the basis of floristic studies may not work with congeneric spe-cies as exemplified by DNA barcoding ofDendrobium spe-cies. BMC Res Notes 7:e42.
Staden R, Beal KF and Bonfield JK (1999) The Staden package, 1998. In: Misener S and Krawets SA (eds) Bioinformatics
Methods and Protocols. Humana Press, Totowa, pp 115-130.
Swenson U, Bartish I and Munzinger J (2007) Phylogeny, diag-nostic characters and generic limitation of Australasian Chrysophylloideae (Sapotaceae, Ericales): Evidence from ITS sequence data and morphology. Cladistics 23:201-228. Swenson U, Richardson J and Bartish I (2008) Multi-gene phy-logeny of the pantropical subfamily Chrysophylloideae (Sapotaceae): Evidence of generic polyphyly and extensive morphological homoplasy. Cladistics 24:1006-1031. Tamura K, Peterson D, Peterson N, Stecher G, Nei M and Kumar
S (2011) MEGA5: Molecular Evolutionary Genetics Analy-sis using maximum likelihood, evolutionary distance, and maximum parsimony methods. Mol Biol Evol 28:2731-2739.
Tate JA and Simpson BB (2003) Paraphyly ofTarasa philippi
(Malvaceae) and diverse origins of the polyploid species. Syst Bot 28:723-737.
Terra-Araujo MH, Faria AD, Ribeiro JELS and Swenson U (2012) Flower biology and subspecies concepts in
Micropholis guyanensis(Sapotaceae): Evidence of ephem-eral flowers in the family. Aust Syst Bot 25:295-303. White TJ, Bruns T, Lee S and Taylor JW (1990) Amplification
and direct sequencing of fungal ribosomal RNA genes for phylogenetics. In: Innis MA, Gelfand DH, Sninsky JJ and White TJ (eds) PCR Protocols: A Guide to Methods and Ap-plications. Academic Press, Inc., New York, pp 315-322. Wolfe KH, Li WH and Sharp PM (1987) Rates of nucleotide
sub-stitution vary greatly among plant mitochondrial, chloro-plast, and nuclear DNAs. Proc Natl Acad Sci USA 84:9054-9058.
Yan HF, Hao G, Hu CM and Ge XJ (2011) DNA barcoding in closely related species: A case study of Primula L. sect. Proliferae Pax (Primulaceae) in China. J Syst Evol 49:225-236.
Yoccoz NG, Bråthen KA, Gielly L, Haile J, Edwards ME, Goslar T, Von Stedingk H, Brysting AK, Coissac E, Pompanon F,et al. (2012) DNA from soil mirrors plant taxonomic and growth form diversity. Mol Ecol 21:3647-3655.
Zhang CY, Wang FY, Yan HF, Hao G, Hu CM and Ge XJ (2012) Testing DNA barcoding in closely related groups of
LysimachiaL. (Myrsinaceae). Mol Ecol Resour 12:98-108.
Supplementary Material
The following online material is available for this article:
Figure S1 - Boxplot of K2P distances between the Sapotaceae spe-cies considered in this study using ITS, matK, rbcLand
trnH-psbAmarkers.
Table S1 - Voucher information and GenBank accession numbers for Sapotaceae species from the Atlantic Forest in southern Bahia.
Table S2 - Significance of pairwise comparisons for single and combined analyses with ITS,matK,rbcLandtrnH-psbA, us-ing interspecific pairwise K2P distances, obtained from the Sapotaceae species used in this study.
This material is available as part of the online article from http://www.scielo.br/gmb.
Data Access
NCBI GenBank accession numbers: JQ413809, JQ413811–JQ413829, JQ413832–JQ413943, JQ434137–JQ434187, JQ434189–JQ434198,
JQ434200–JQ434250, JQ434254–JQ434261, KF943829–KF943871, KM036003–KM036006.
Associate Editor: Fabrício Rodrigues dos Santos